DRAW Blog
Exploring weather and all it entails
Welcome to the DRAW Blog! Our focus here is to introduce topics related to DRAW and weather. This could be background information about parts of the project (such as symbols), discussion on weather issues (such as climate change), or may simply be a way to get to know the DRAW team further. Check in regularly for new posts!
In Dark Times Laughter Can Be the Best Medicine

The headlines on October 6th, 1930, were gloomy, as the previous day the airship R101 crashed over France in a thunderstorm. A disaster even more deadly than Hindenburg. In sharp contrast, the McGill convocation on October sixth was marked by fair weather and a focus on laughter. In his Founder’s Day address, principal and vice-chancellor of McGill university, Sir Arthur Currie said “You will laugh at one another. The professors will laugh at some of you; and perhaps you will think you can laugh at some of the professors. Neither you nor anyone else will be hurt by that. Laughing is good exercise, especially if a man learns to laugh at himself.” Sir Arthur’s remarks struck a balance between reminding the students of McGill’s grand purpose; to advance learning, while also warning them not to become conceited. The weather was warm enough at between 50 and 64 degrees Fahrenheit that at least some of the ceremony took place outdoors.


The event was held in Moyse Hall. 26 degrees and six diplomas were awarded. Many of these were granted in absentia. One of the 6 diplomas awarded was from the library school. Its recipient, Elizabeth Ann Brown, is potentially pictured below.

Sir Arthur said, he wouldn’t believe any charges of snobbery or immorality of the students “so long as there is evidence that you have not forgotten how to laugh.” Based on the student publications of the time there was little chance of that. McGill students of 1930 seemed to be a fun-loving bunch. In an issue of the McGill daily published later that October there was a proposal for the founding of a “Humorous paper” that would be edited by the undergraduate students. The sense of humor of McGill students was also on full display in the McGill yearbooks. The profiles of students are frequently amusing. One that I find particularly funny is, Favourite expression: “Heard about any new buildings?”. The yearbooks are also filled with fun additions like short comics and even caricatures of faculty members.

It was a grim day, the front page of the Montreal Gazette reported not just the R101 disaster, but another 3 unrelated plane crashes, 2 of which had no survivors. However, Montreal itself was sunny, and the convocation was the sole bright spot in the dreary headlines.
Sources
Arts Building and Moyse Hall McGill University, Montreal, Canada. Published by Montreal: International Fine Art Co. Ltd., [between 1925 and 1940] Source BANQ https://collections.banq.qc.ca/ark:/52327/2551122
English: Photograph of the wreckage of the R101 airship which was probably taken not long after the crash on 4 October 1930 in Allonne, Picardie (France). (n.d.). [Graphic]. Transferred from en.wikipedia to Commons. The photograph was scanned from Finn, C. J. et al. (2004). Air Publication 3003. HMSO. Retrieved 13 February 2026, from https://commons.wikimedia.org/wiki/File:R101_wreckage.jpg
Honorary degree recipients with Principal Currie and Chancellor Edward Beatty 10/6/1930 Retrieved from https://www.archives.mcgill.ca/aspfile/searchphoto4.asp?f1=convocation+1930&choosedb=2&Orderby=Date&recsperpage=100&fileName=photosearch.htm
October 7, 1930 (page 4 of 24). (1930, Oct 07). The Gazette (1867-2014) Retrieved from https://proxy.library.mcgill.ca/login?url=https://www.proquest.com/newspapers/october-7-1930-page-4-24/docview/2158645664/se-2
1923 Yearbook (n.d.). McGill Yearbooks. https://yearbooks.mcgill.ca/viewbook.php?campus=downtown&book_id=1929#mode/2up
1930 Yearbook (n.d.). Retrieved 13 February 2026, from https://yearbooks.mcgill.ca/viewbook.php?campus=downtown&book_id=1930#page/34/mode/2up
Convocation at the Capitol Theatre

McGill University. (1928). Programme of the Annual Convocation for Conferring Degrees. McGill University Archives, Montreal, QC, Canada. https://public-content.library.mcgill.ca/MLAC/MUA/MG4319/convocation/mua_conv_1928-05-30_annual.pdf#:~:text=SIR%20WILFRED%20THO~IASON%20GRENFELL%2C%20C.M.G.%2C,(Presented%20by%20Dr.
Convocation Day at McGill arrived with expectations of pleasant weather to congratulate the newest crop of graduates. The Gazette’s forecast called for moderate westerly winds, mostly fair skies, and slightly warmer temperatures for May 30th, 1928. The McGill Observatory confirmed it: mostly fair, with a high of 66°F (18.9°C) (“Weather Report”, 1928).

The Gazette, Vol. CLVII, No. 129. May 30, 1928. https://www.proquest.com/pagelevelimagepdf/2158588548/pagelevelImagePDF/$N/1?sourcetype=Newspapers

The Gazette, Vol CLVII , No. 130. May 31, 1928. https://www.proquest.com/pagelevelimagepdf/2158536038/pagelevelImagePDF/$N/1?accountid=12339&t:lb=t&sourcetype=Newspapers
The ceremony was held at the Capitol Theatre, at the time one of Montreal’s most opulent and imposing venues. Opened in 1921, the Capitol could fit 2,600 spectators and was spectacularly decorated with marbled columns and a brilliant 50-foot domed ceiling (Montreal Concert Poster Archive). Amplifying the theatre’s grandiosity was its 27-piece orchestra and iconic Warren organ, regarded by famed theatre organist Charles Wright as the most beautifully toned theatre organ in the city at the time (Wright, 1972). It was in this luxurious setting, no doubt accompanied by that lovely organ, that the afternoon’s most honored guests rose to receive their honorary degrees.

The Capitol Theatre, Ste. Catherine St., Montreal, Quebec, about 1925. Photographer: Unknown. Date: About 1925. Origin: Canada. Object Number: MP-0000.587.144. Collection: McCord Museum. https://collections.musee-mccord-stewart.ca/en/objects/110595/theatre-capitol-rue-saintecatherine-montreal-quebec-ver?ctx=655c38d3120f4096fe71172c12a95fc93c64af23&idx=1
The first to rise and receive their Honorary Degree of Doctor of Laws was Dr. William Reid Blair. Graduating from McGill with a degree in veterinary surgery in 1902, he became the first full time veterinarian at the newly opened New York Zoological Park (better known as the Bronx Zoo) just a year after his graduation. He served in this position 23 years, and in 1926 Dr. Blair rose to become Zoo Director (Calle, 2020).

William Reid Blair, McGill Yearbook, 1902, p 142. https://yearbooks.mcgill.ca/viewbook.php?&campus=downtown&book_id=1902#page/146/mode/1up
Next to take the stage was Reverend Canon Henry John Cody. A clergyman, ex-Minister of Education for Ontario, and chairman of the board of governors at the University of Toronto, Reverend Cody was an emblem of the partnership between church, state, and higher education in early-1900s Canada (Stamp, 2007).
Sir Wilfred Thomason Grenfell was honored third, a medical doctor whose humanitarian work was so vital that he was granted a knighthood by King George V. Born in England, Sir Grenfell was sent by the Royal National Mission to Deep Sea Fisherman to Newfoundland in 1892 to improve the medical and social services of the region’s isolated fishing communities (Canadian Medical Hall of Fame). Grenfell founded the International Grenfell Association, which would shamefully later participate in the operation of Newfoundland’s genocidal residential school system, complicating Grenfell’s legacy (Bartlett, 2017).

Grenfell Hospital, Battle Harbour, NF, 1908. Photographer: William McFarlane Notman (1857-1913). Date: 1908. Origin: Canada. Object Number: VIEW-4586 Collection: McCord Museum.
Then came George Iles, described as a “litterateur” and author, known for his “Little Masterpieces”, non-fiction works on the sciences and autobiographies of important artists, writers, and historical figures (Librivox).
Last to be honored was Julian Cleveland Smith, vice-president and General manager of the Shawinigan Water and Power Company. Smith oversaw many of the hydroelectric projects of the time in Quebec, and became highly influential in Canadian industry, sitting on the boards of directors of the Royal Bank of Canada, Heat and Power Company, and several others (Bellavance, 2019).
The beautiful Capitol Theatre is long gone now, demolished in 1973 to make room for development (Gyulai, 2015). So is the McGill Observatory, and all of the honorees celebrated on May 30th, 1928. What allows us to remember and reconstruct these places, people, and events of the past in detail are the records that have been preserved so that we can revisit these moments that would otherwise have been lost.
Sources
Bartlett, G. (2017, November 24). Tearful Justin Trudeau apologizes to N.L. residential school survivors. CBC. https://www.cbc.ca/news/canada/newfoundland-labrador/justin-trudeau-labrador-residential-schools-apology-1.4417443
Bellavance, C. (2019). Julian Cleveland Smith. Dictionary of Canadian Biography (16). University of Toronto. https://www.biographi.ca/en/bio/smith_julian_cleveland_16E.html#citations
Calle, P. (2020, February 13). A Tradition of Excellent Veterinary Care: William Reid Blair. Wildlife Conservation Society. https://blog.wcs.org/photo/2020/02/13/william-reid-blair-a-tradition-of-excellent-veterinary-care-bronx-zoo-orangutan/
Canadian Medical Hall of Fame. (n.d.) Sir Wilfred Grenfell, MD. https://www.cdnmedhall.ca/laureates/wilfredgrenfell
Librivox. (n.d.). George Iles. https://librivox.org/author/10987?primary_key=10987&search_category=author&search_page=1&search_form=get_results&search_order=alpha
Gyulai, L. (2015, February 27). Loss of Montreal’s Capitol Theatre was a bitter pill for many. The Gazette. https://montrealgazette.com/news/local-news/loss-of-montreals-capitol-theatre-was-a-bitter-pill-for-many
Montreal Concert Poster Archive. (n.d.). Capitol Theatre (Montreal). https://montrealconcertposterarchive.com/capitol/#histoire
Stamp, R. (2007). Henry John Cody. The Canadian Encyclopedia. Historica Canada. https://thecanadianencyclopedia.ca/en/article/henry-john-cody
Weather Report. (1928, May 30th). The Gazette, p. 1. https://www.proquest.com/pagelevelimagepdf/2158588548/pagelevelImagePDF/$N/1?sourcetype=Newspapers
Weather Report. (1928, May 31st). The Gazette, p. 7. https://www.proquest.com/pagelevelimagepdf/2158536038/pagelevelImagePDF/$N/1?accountid=12339&t:lb=t&sourcetype=Newspapers
Wright, C. (1972). Nostalgic Memories. Journal of the American Theatre Organ Society, 14(5), 33. https://journals.shareok.org/theatreorgan/article/view/1859
Montreal in July - approaching the dog days of summer
On July 19, 1931, Montreal was approaching the dog days of summer. Regular classes were out for the year, but the McGill Observatory was dutifully continuing to record data. The day began with a cooler 68.5 °F (20.3 °C), and a note reading ‘Cloudy and warm’. The temperature rose to 85.5 °F (30 °C) by mid-afternoon and finally settled into a comfortable 78.5 °F (25.8 °C) in the evening.
Let’s dive into some of the summer activities taking place across the city on days like these. Wading pools were a popular, accessible spot for children to meet with friends and take a break from the weather. The Kiwanis Club, an international club founded in 1915, was a driving force in supporting these kinds of institutions. It was formed in the United States, but quickly spread to Canada, and began to direct its efforts towards improving the lives of children through play and activity. You might recognize the name – as of 2024, the institution is associated with 14,346 adult and youth clubs internationally (Kiwanis Club, 2024).

Description: Children enjoying Montreal Kiwanis Club wading pool and shower, c. 1941. Public domain. McGill Archives, PU025391.
The following newspaper segment, which ran in The Gazette on October 6, 1930, describes some of the year-round activities that Kiwanis Club engaged in:

Description: Clipping from The Gazette article “Kiwanis Exposition Will Open Tonight”, published 6 October 1930. Author unknown.
Older children also had the opportunity to bond over summer activities. The photo below is from the Trafalgar Institute, a private school for teenage girls. This group of tennis players at the Institute likely came from a wealthier background and may have used the summer holidays to continue honing their skills.

Description: Tennis group, Trafalgar Institute, Montreal, QC, 1932. Wm. Notman & Son Ltd. McCord Stewart Museum, Object Number II-304426.
Of course, industry continued throughout other parts of town. At McGill, summer classes were not unusual. Below is a small group of students who spent the summer months engaged in learning about librarianship.

Description: Summer Library School, 1931. Public domain. Street photo. McGill Archives, PR001529.
The exact date of this photograph, as listed in McGill Archives, is somewhat debatable. Before becoming accredited by ALA and instituting an official master’s degree, McGill’s library school operated as a summer library course. Its website cites 1904 to 1927 as the full span of the summer course operation, but the above photo is dated 1931 by McGill Archives. Whatever the truth is, it is certain that students from many faculties could still found on campus throughout the summer.

Description: New Tram Tracks on Dorchester Street, Looking East, Montreal, Quebec, 1931. Photographer unknown. McCord Stewart Museum, Object Number MP-1999.6.49. Gift of J. Norman Lowe.
For those hoping to get around in Montreal, the development of new transportation infrastructure would have been a subject of interest. In 1931, these tram tracks were installed on Dorchester Street. Don't recognize the name? For the most part, the street is now called René Lévesque Boulevard, though there is still a section in Westmount that maintains its original name.
The cityscape is a little different these days, but this photo actually shows one of the more recognizable places around Montreal. Look to the top right – notice the statues? This is the Mary, Queen of the World cathedral. The big building on the left is the Sun Life building, which would have just been completed. Out of sight behind the photographer is Dorchester Square – which kept its name even when the Dorchester Street's name changed in 1987.

Description: Procession of the Holy Sacrament, Notre-Dame Street, Lachine, QC, June 14, 1931. Photographer unknown. McCord Stewart Museum, Object Number MP-1978.107.80.
Larger parades and events were also taking place. The above is a Catholic procession which took place in June of 1931, barely a month before weather observers were recording the July 19th temperatures at McGill. The photo shows the involvement of all kinds of people, from clergymen to uniformed officers to bystanders on the street. All of this against the backdrop of flags, banners, and a bustling city.
Sources
Kiwanis Club. (2024). Just the facts. https://www.kiwanis.org/wp-content/uploads/2025/05/Just-the-Facts-update_EN.pdf
October 6, 1930 (page 11 of 32). (1930, Oct 06). The Gazette (1867-2014) Retrieved from https://proxy.library.mcgill.ca/login?url=https://www.proquest.com/newspapers/october-6-1930-page-11-32/docview/2158707383/se-2
Sun Life Building. (n.d.) History. https://www.sunlifebuilding.ca/history/
Wikipedia contributors. (2025, March 23). René Lévesque Boulevard. In Wikipedia, The Free Encyclopedia. https://en.wikipedia.org/w/index.php?title=Ren%C3%A9_L%C3%A9vesque_Boulevard&oldid=1281987245
McGill’s 1926 Convocation: A Day for History Books
The weather forecast for October 6, 1926, predicted a relatively cool and comfortable day, although it warned that a little rain might enter the picture (“Weather Forecast,” 1926). Despite that possibility, it appears that everything went as planned at McGill’s convocation, with graduates parading down Sherbrooke Street towards the Royal Victoria College for a 4 p.m. ceremony (Convocation for Conferring Degrees, 2026). Photographs from the graduation procession on October 6 appear dark and slightly unclear, pointing to the possibility that an overcast sky resulted in underexposed film. What the cameras didn’t capture was the presence of a special guest that day. There to receive the honorary degree of Doctor of Laws was Viscount Willingdon, the new Governor General of Canada. Lord Willingdon also held the title of Visitor, a supervisory role assigned to Canada’s Governor General by the royal charter that established McGill as a University (“Lord Willingdon,” 1926).

Reference 6.10.1926, McGill University Archives, PN038158, Fall convocation parade entering Royal Victoria College, 1926.
Prior to being selected for the office of Canada’s Governor General, Lord Willingdon, an Englishman, had already twice served as a governor in British India (Wikipedia Contributors, 2026). After finishing his post in Canada, he would go on to serve as Viceroy of India in the 1930s. Lord Willingdon’s time as Viceroy would be marked by his action to imprison 80,000 activists, including Mahatma Ghandi. Even before his post in Canada and before his Viceroyship, Willingdon had been part of a government in India that had raised taxes on farmers and confiscated property during a time of serious famine (Wikipedia Contributors, 2026).

Viscount Freeman Thomas Willingdon (1866-1941), Governor General of Canada (1926-1931), and Viscountess Willingdon with their staff and Mistie, Lady Willingdon's dog, 1926, National Archives in Montreal, Charles Robert William Gordonsmith Collection, BAnQ.
Whether Canadians or the University’s officials were aware of Lord Willingdon’s record as governor of British India at the time of his appointment to Governor General, or whether they approved of it, is unclear. It appears likely that most people were unaware. Consider, for instance, the description in the Montreal Gazette published a day after the convocation ceremony. In his own words, Willingdon suggested upon receiving his degree that not much beyond rumour was known about him within the university (“Lord Willingdon honoured by McGill,” 1926).

Lord Willingdon honored by McGill at convocation. (1926, October 7). The Gazette (1867– 2014), 155(240), 4. ProQuest
More telling, still, is an article from the McGill Daily that happened to be published on October 2, just four days before the convocation ceremony. In it, the author describes meeting with a visiting scholar from India: “The Professor was startled by the apparent ignorance on the part of people both here and in the U.S. regarding India and Indian affairs […] Even college students […] manifested a deplorable knowledge of things Indian.” The author goes on to propose an exchange system for students and professors to promote “better understanding between the Empire nations” (“McGill and the empire,” 1926).
If this article is any indication, Canadians might not have been especially tuned into what was happening in certain parts of the British Empire. But it’s hard to say if that was the case for sure.

McGill and the empire. (1926, October 2). The McGill Daily, 16(003), 2. Internet Archive (McGill University Libraries).
What does emerge from the news clippings here is a sense of how much more present Britain was in Canadian affairs and in Canadian identity almost 100 years ago. Canada’s relationship with Britain during the time of Lord Willingdon’s post as Governor General would undergo significant changes, but on the day of the convocation ceremony in October 1926, that connection held strong (Wikipedia Contributors, 2026). Even the convocation program shows traces, with the chant, “God Save the King!” inserted at the end of O Canada’s lyrics (Convocation for Conferring Degrees, 2026).

Convocation for Conferring Degrees in the Royal Victoria College on Wednesday, October 6th, 1926 at 4 p.m. [Order of Proceedings], McGill University, 6.10.1926, McGill University Archives, MG4319.
Sources
Convocation for conferring degrees in the Royal Victoria College on Wednesday, October 6th, 1926, at 4 p.m. [Order of proceedings]. (2026, October 6). McGill University. McGill University Archives (MG4319). https://public-content.library.mcgill.ca/MLAC/MUA/MG4319/convocation/mua_conv_1926-10-06_convocation.pdf
Lord Willingdon. (1926, October 6). The McGill Daily, 16(006), 2. Internet Archive (McGill University Libraries).
Lord Willingdon honored by McGill at convocation. (1926, October 7). The Gazette (1867– 2014), 155(240), 4.
McGill and the empire. (1926, October 2). The McGill Daily, 16(003), 2. Internet Archive (McGill University Libraries).
PN038158. (2026). [Graphic]. McGill University Archives. https://www.archives.mcgill.ca/aspfile/searchphoto4.asp?f1=1926&choosedb=allphoto&Orderby=Date&recsperpage=100&fileName=photosearch.htm
Viscount Freeman Thomas Willingdon (1866–1941), Governor General of Canada (1926–1931), and Viscountess Willingdon with their staff and Mistie, Lady Willingdon’s dog. (1926). [Graphic]. Bibliothèque et Archives nationales du Québec (National Archives in Montreal, Charles Robert William Gordonsmith Collection). https://numerique.banq.qc.ca/patrimoine/details/52327/3283375
Weather forecast. (1926, October 6). The Gazette (1867–2014), 155(239), 1.
Wikipedia contributors. (2026). Freeman Freeman-Thomas, 1st Marquess of Willingdon. In Wikipedia, The Free Encyclopedia. https://en.wikipedia.org/w/index.php?title=Freeman_Freeman-Thomas,_1st_Marquess_of_Willingdon&oldid=1337465141
May 30th, 1924: Turbulent Weather, Turbulent Times
The day was May 30th, 1924. Some, primarily male, Montrealers were waking up in anticipation for their graduation from McGill University! The time to walk ceremoniously from stage left to right, symbolizing the completion of sleepless nights cramming and endless days writing on campus had finally arrived. The students adorned in suits, caps, and gowns crowded the campus and were greeted by a mild forecast for May, showing a high of 11.1 and low of 5.6 degrees (Montreal Weather in 1924, n.d.).

May 30, 1924 (Page 7 of 24). Abstract from McGill Meteorological Records (1924, May 30). The Gazette (1867-2014) https://www.proquest.com/hnpmontrealgazette/pagelevelimagepdf/2158564498/pagelevelImagePDF/528F9E47DEC04BD8PQ/1?t:lb=t&accountid=12339&sourcetype=Newspapers
Others in the province were more focused on how to prepare for more volatile weather after the destructive thunderstorms which came down upon Quebec City one day prior, on May 29th.

May 30, 1924 (Page 1 of 24). Lightning Struck House (1924, May 30). The Gazette (1867-2014) https://www.proquest.com/hnpmontrealgazette/pagelevelimagepdf/2158565222/pagelevelImagePDF/$N/1?t:lb=t&accountid=12339&sourcetype=Newspapers
The unpredictability of the weather seemed to be a general theme of the times. One of our favorite discoveries from that day’s paper is a small science column explaining the origin of cloud bursts. The article describes rain not as something that simply falls, but as something suspended in the sky by stubborn air currents. Tiny droplets form, but they’re too small to reach us. They hover, are pushed upward, “oscillating backwards and forwards,” growing heavier, more burdened, more inevitable. Only when the upper air current suddenly stops does everything come down at once. What might have been “a few harmless showers,” the paper warns, becomes a “devastating deluge.” It’s hard not to read this as a metaphor as much as the weather.

May 30, 1924 (Page 7 of 24). Last exhibition of the Season and Exhibition of English Etchings (1924, May 30). The Gazette (1867-2014) https://www.proquest.com/hnpmontrealgazette/pagelevelimagepdf/2158564498/pagelevelImagePDF/528F9E47DEC04BD8PQ/1?t:lb=t&accountid=12339&sourcetype=Newspapers

May 30, 1924 (Page 7 of 24). Last exhibition of the Season and Exhibition of English Etchings (1924, May 30). The Gazette (1867-2014) https://www.proquest.com/hnpmontrealgazette/pagelevelimagepdf/2158564498/pagelevelImagePDF/528F9E47DEC04BD8PQ/1?t:lb=t&accountid=12339&sourcetype=Newspapers
The weather wasn’t the only thing surprising and enticing Montrealers at the time. According to the Montreal Gazette (1924), there were two exciting exhibitions taking place around the heart of downtown. The 1920s in Montreal is remembered as an exciting, bustling and promiscuous time. The jazz scene in Little Burgundy was attracting music lovers and socialites from around the world, as well as the visual art exhibitions in the Golden Square Mile.

Sainte-Catherine Boulevard on the corner of Peel Street in the 1920s. Screenshot of Montreal Then & Now website taken Feb 11, 2026 by Lucy Earle https://map.montrealthenandnow.com/
Something we noticed about both the advertisements for art shows, was that they were both organized by male artists or dealers and curators. This boys club also seemed to dominate in the McGill graduating class. As apparent in the photo of the graduating class from the Arts Department, all the students are wearing long coats, caps or top hats, and not a single dress or long-haired colleague is in sight.

McGill Arts Graduating Class of 2024, old McGill yearbook https://yearbooks.mcgill.ca/viewbook.php?campus=downtown&book_id=1925#page/54/mode/2up
The April 29 publication of the McGill Daily contains detailed information about the convocation that would end up taking place on May 30. On the same front page containing articles about McGill recent news, such as the unfortunate drowning of a student in a canoe accident and a dean’s retirement, is a piece promising an enjoyable convocation dance taking place the night before. It is interesting to see the way the graduating class committee write as if they are marketing the event, promising a good, larger venue, with good food and an orchestra. In another article, they refer to their own planning, writing “elaborate preparations foretell success” (McGill University, 1924). This article also describes the intention behind the yearbook and its illustrations, plus comments on the annual “renowned tree planting” as part of the graduation ceremonies (McGill University, 1924).

McGillLibrary-mcgill-daily-convocation-number-april-29-1924-6956. Graduating Class Committee. Internet Archive https://archive.org/details/McGillLibrary-mcgill-daily-convocation-number-april-29-1924-6956/mode/2up
In keeping with our observations that the photos of graduates consist entirely of men, right beneath the list of the committee’s names, they chose to include a somewhat distasteful joke…

Song of the Arts ‘24, old McGill yearbook https://yearbooks.mcgill.ca/viewbook.php?campus=downtown&book_id=1924#page/28/mode/2up
In celebration of their time within the Faculty of Arts, the graduating Class of 1924 has composed the Song of Arts. The carefully penned lyrics stand as a tribute to their shared experiences, intellectual growth, and the bonds formed during their years of study. Within these lines, we glimpse both the pride of accomplishment and the enduring spirit of this remarkable class at McGill University…
Sources
1924 Yearbook. (n.d.). Retrieved February 12, 2026, from https://yearbooks.mcgill.ca/viewbook.php?campus=downtown&book_id=1924#page/28/mode/2up
1925 Yearbook. (n.d.). Retrieved February 12, 2026, from https://yearbooks.mcgill.ca/viewbook.php?campus=downtown&book_id=1925#page/54/mode/2up
May 30, 1924 (Page 1 of 24). (1924, May 30). The Gazette (1867-2014) https://proxy.library.mcgill.ca/login?url=https://www.proquest.com/newspapers/may-30-1924-page-1-24/docview/2158565222/se-2
May 30, 1924 (Page 7 of 24). (1924, May 30). The Gazette (1867-2014) https://proxy.library.mcgill.ca/login?url=https://www.proquest.com/newspapers/may-30-1924-page-7-24/docview/2158564498/se-2
McGill University, D. P. S. (with McGill University Library). (1924). The McGill Daily Convocation Number: April 29, 1924. Montréal : McGill University, Daily Publications Society,. http://archive.org/details/McGillLibrary-mcgill-daily-convocation-number-april-29-1924-6956
Montreal Weather in 1924. (n.d.). Retrieved February 12, 2026, from https://www.extremeweatherwatch.com/cities/montreal/year-1924#may
“A Permanent Record, a Brief Statement of the Case”: An Incomplete History of the Royal Victoria College
At the intersection of Sherbrooke and University, along one massive block, sits a stunning, imposing, distinctly collegial building. The Royal Victoria College, oft-abbreviated as RVC to those who know her well, is a five-story statement piece cloaked in grey Montreal limestone (Canadian Architecture Collection 1995). It was built in 1899 in the British chateau style by an American architect, Bruce Price, and named after Queen Victoria (Canadian Architecture Collection 1995).
The RVC was built to house the women of McGill, who were first admitted in 1884, over 60 years after the university’s founding (McGill Bicentennial 2021). Like many women’s universities of the late 19th century, the RVC was meant as both housing and classroom, providing educational facilities alongside dormitories (McGill Archives 2004). All women who attended McGill were actually officially students at the Royal Victoria College, a rule which remained until the 1970s (McGill Archives 2004).

Page 151, The Royal Victoria College Undergraduate Society, 1931. Old McGill Volume 34. 1931 Print. McGill University Archives.
By October of 1931, the RVC was over capacity; housing close to 1,000 students (McGill Alumni Quarterly 2008; McGill Bicentennial 2021), it had well exceeded its original intended residency of around 700 young women (Canadian Architecture Collection 1995). Indeed, construction had already begun on the Vaughan Wing, a four-story addition to the building as overseen by Professor of Architecture Percy Nobbs (Canadian Architecture Collection 1995), to accommodate the overflow

Page 139, Letter “The Status of Women at McGill”, 1931. Old McGill Volume 34. 1931 Print. McGill University Archives.
Women had, at this time, been received with varying levels of enthusiasm. A main concern of the female undergraduates at McGill was not necessarily treatment or opportunity, but rather representation; the founding of the all-male Students’ Council in 1908 replaced the co-ed Alma Mater Society, leaving the women of McGill to create their own Women’s Students’ Society (Vaughan 1931, p. 149). Despite the unfair bureaucracy of the University, the women of McGill continued to make their mark.

Page 166, Royal Victoria College Hockey Team, 1931. Old McGill Volume 34. 1931 Print. McGill University Archives.
For example, the residents of Royal Victoria College created their own sports teams, including both basketball and hockey (McGill 1931). McGill also had a surprisingly large student population in its School of Physical Education, comprised entirely of women (McGill 1931). Still, women found themselves underrepresented in most areas of student life — a glance through the 1931 yearbook shows pages upon pages of departments and organizations whose makeup is almost entirely men, with rare exceptions for traditionally feminine vocations such as nursing, social work, and librarianship (McGill 1931). Flipping through this yearbook paints a vivid picture of a campus that was certainly co-educational, but almost entirely segregated by gender. To be a female student at McGill in the early 20th century was likely no easy feat, but women forged communities of their own despite the obvious difficulties.

Anonymous, Female students studying for final exams, on back gallery of Royal Victoria College annex on University Street, 1928. McGill University Archives. PN038155.
The 6th of October 1931 marked convocation for some such female students. It was a day described as “fair and cooler” for early fall, with a high of 68ºF (20ºC) and a low of 47ºF (8.5ºC) (DRAW Weather Report, 1931). The sun shone for nearly nine hours, and a light rain of around half an inch (barely more than a centimeter) did not seem to deter the students as they made their way to the ceremony (DRAW Weather Report, 1931). A Montrealer would look at those temperature numbers and call the day nigh-balmy, perhaps even tropical; even as far back as the 1920s, there exist photos of McGill students lounging on porches outside while bundled up in heavy furs, undeterred by the distinctive chill seldom found outside a Montreal winter.

Royal Victoria College, 1935 Sutcliff, H. (c. 1935). Royal Victoria College, McGill University, Montreal, QC, ca. 1935. McCord Stewart Museum. https://www.musee-mccord-stewart.ca.
You may recognize the Royal Victoria College as you pass by it on Sherbrooke Street. As of early 2026, the façade is now cloaked in tarps and chain-link, a promise of a newly restored building sometime in the not-too-distant future. Now, however, only the westernmost side of the building remains student housing, having kept the name RVC, and only a small wing of that in turn is reserved for women. The rest, now called the Strathcona Music Building, houses classrooms, practice rooms, and rehearsal spaces. You may also see, on the far east side of the block, a towering rectangle of glass attached to what was once the Royal Victoria College. Christened the Elizabeth Wirth Music Building and opened in 2005 (Schulich 2026), the two now comprise the Schulich School of Music. In 1884, when what would eventually become Schulich was founded, it, too, was reserved for women (Turbide et al. 2011). Over a century later, its imposing presence between University and Aylmer Streets serves as a reminder of what McGill has been, where it is now, and where it may go next.
References
Ana, R., & Kim, J. (2019). “Something that feels like a community”: the role of personal stories in building community-based participatory archives. Archival Science, 19(1), 27-49. https://doi.org/10.1007/s10502-019-09302-2
Burr, G., Podolsky, L. and Lapointe, Y. “Redrawing historical weather data and participatory archives for the future”. Comma, Volume 2021, Number 2 (2023). https://doi.org/10.3828/coma.2021.28
History—Important Dates. (n.d.). McGill Schulich School of Music. Retrieved February 13, 2026, from https://www.mcgill.ca/music/about-us/history
Huvila, I. (2015). The unbearable lightness of participating? Revisiting the discourses of “participation” in archival literature. Journal of Documentation, 71(2), 358-386. https://doi.org/10.1108/JD-01-2014-0012
McGill News: The 1930s. (n.d.). Retrieved February 13, 2026, from https://mcgillnews-archives.mcgill.ca/news-archives/1999/winter/1930s/index.html
McGill University. (1931). Old McGill Volume 34. Print. McGill University Archives.
McGill University. (2026). Wikipedia. https://en.wikipedia.org/w/index.php?title=McGill_University&oldid=1335268917
Music at McGill University. (n.d.). Retrieved February 13, 2026, from https://thecanadianencyclopedia.ca/en/article/music-at-mcgill-university-emc
Photograph women studying. (1928). Unknown Collection (PN038155), McGill University Photo Archives. https://www.archives.mcgill.ca/resources/db/photosearch.htm.
Sutcliff, H. (c. 1935). Royal Victoria College, McGill University, Montreal, QC, ca. 1935 [silver salts on paper, gelatin silver process]. McCord Stewart Museum, Montreal, Quebec, Canada. https://www.musee-mccord-stewart.ca/en/
Royal Victoria College > McGill Facts and Institutional History > McGill History > Outreach (n.d.). Retrieved February 13, 2026, from https://archives.mcgill.ca/public/hist_mcgill/rvc/rvc.htm
Royal Victoria College—The Early Years. (n.d.). Retrieved February 13, 2026, from https://cac.mcgill.ca/campus/buildings/Royal_Victoria_College_Early_Years.html
Weather Report. (1931, October 7). Montreal Gazette, 7. https://www.proquest.com/publication/2069637/citation/D1A949F320C74D8CPQ/1?accountid=12339&parentSessionId=fMQELI0YEP4feG9W2402ukf%2FH3f9J77XkCuK1pwTcSM%3D&decadeSelected=1930%20-%201939&yearSelected=1931&monthSelected=10&issueNameSelected=
Women admitted to McGill. (n.d.). Bicentennial - McGill University. Retrieved February 13, 2026, from https://200.mcgill.ca/history/women-are-allowed-to-attend-mcgill-as-full-time-students-f or-the-first-time/
1923 Convocation: unremarkable weather not a sign of an unremarkable day
The weather on Tuesday, May 29th, 1923 was forecast to have “light winds; fair and moderately warm,” and the temperature report from the following day seems to bear this out, with a high of 68°F (20°C) and a low of 49°F (9°C), slightly cooler than the same day the year before.

Weather Forecast. (1923, May 29). The Gazette, 152(128), 1. https://proxy.library.mcgill.ca/login?url=https://www.proquest.com/newspapers/may-29-1923-page-1-22/docview/2158526623/se-2

Weather Forecast. (1923, May 30). The Gazette, 152(129), 1. https://proxy.library.mcgill.ca/login?url=https://www.proquest.com/newspapers/may-30-1923-page-1-22/docview/2158495700/se-2
This clear day proved advantageous for the McGill Convocation ceremony, with neither rain nor heat ruining the procession. The mild weather did not reflect a mildness of spirit. The McGill Daily announced that the Convocation would be preceded by a week’s worth of festivities, including two baseball games, a dance and tea, tree planting and a night of theatre. This year’s Convocation was also the first year that five faculties (Arts, Science, Law, Dentistry, and Commerce) graduated together, with a separate Medicine convocation scheduled for June.

Many Activities Will be Staged at Graduation. (1923, April 28). The McGill Daily: Convocation Issue, 12(128), 1. https://archive.org/details/McGillLibrary-mcgill-daily-v12-n128-april-28-1923-6954/mode/2up

R. V. C. Will Lose Many in Graduation. (1923, April 28). The McGill Daily: Convocation Issue, 12(128), 1. https://archive.org/details/McGillLibrary-mcgill-daily-v12-n128-april-28-1923-6954/mode/2up
The Royal Victoria College also participated in the May 29th convocation, graduating the largest number of female graduates in its history up to that point. In total, more than 400 graduates received their degrees on the 29th. Of note is that throughout the McGill Daily, the graduating class is referred to, interchangeably, as the Class of 22’ and the Class of 23’. This numerical quirk is reflected in the McGill Yearbooks at the time as well, where the Juniors of a particular year are the ones whose photographs are displayed.

McGill University Archives. (1923). Exterior Graduates Convocation Procession. [Photograph]. McGill University Archives Photo Collection, PR032264. https://www.archives.mcgill.ca/aspfile/searchphoto4.asp?f1=Convocation&choosedb=2&Orderby=Date&recsperpage=100&fileName=photosearch.htm.
The world was much smaller in 1923, and print media much better funded. Newspapers across Quebec reported on their resident’s travels plans and life events in the “Social and Personal” section in their newspapers. A week before convocation, on May 21st, 1923, the Sherbrooke Daily Record announced that “Mr. Jack McCaw, High Street, left this morning for Montreal to be present during convocation at McGill University.” A similar notice today in a local paper is almost unthinkable.
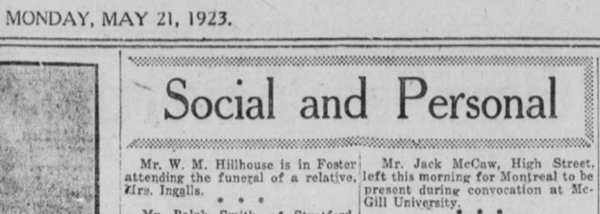
Social and Personal. (1923, May 21). Sherbrooke Daily Record, 5. https://numerique.banq.qc.ca/patrimoine/details/52327/3102390?docsearchtext=mcgill
Elsewhere, the city of Dresden in Weimar Republic Germany was undergoing political upheaval. The Montreal Gazette announced that the city was “at the mercy of a Communist gang of terrorists,” and feared that ‘“the Communists intend to declare all stores public property [on the 29th], and that they will seize the government with the aid of the unemployed”.

Dresden City Terrorized by Communists. (1923, May 29). The Gazette, 152(128), 1. https://proxy.library.mcgill.ca/login?url=https://www.proquest.com/newspapers/may-29-1923-page-1-22/docview/2158526623/se-2
The events that would unfold in Dresden this May would inspire retaliation across Germany, and later, the world. Later in 1923, Weimar Germany would see the Nazi party attempt to take over the government in Berlin. Although this coup failed, and its leaders would be arrested, it raised the profile of a certain Adolf Hitler, who would end up leading Germany and sparking World War II (Rollyson, 2023).

Student’s Society of McGill University. (1923). Old McGill Yearbook. (pp. 70). https://yearbooks.mcgill.ca/viewbook.php?&campus=downtown&book_id=1923#page/84/mode/1up.
One member of the 1923 Class of McGill Graduates who was a part of the convocation would later face the horrors of World War II firsthand. Lindsay Foss, a Class of ‘23 B.Sci.. graduate, claimed he would “rather like to be a mining engineer”, a dream that brought him to England 5 years before the war broke out. The son of a First World War veteran, he would become a Major with the 172nd Tunnelling Company and die, at the age of 45, in Gibraltar in 1943.

McGill University Archives. (1943). Dieppe Casualties [Archive Document]. Series File Folder (Recto), 0000-0481.01.2.e0876. https://www.archives.mcgill.ca/public/exhibits/mcgillremembers/results.asp?id=100
References
Rollyson, C. (2023). Beer Hall Putsch. EBSCO Knowledge Advantage. https://www.ebsco.com/research-starters/history/beer-hall-putsch
The Very Questionable Origin Story of “Rubbers”

1903 McGill Yearbook, Page 219. Description: A rainy street scene during the Annual Field Day. Date: 1903. Source: McGill Yearbooks.
Do you know where “rubbers” come from? According to one charming story, their origin can be traced back to a man, the hero, who once saved the life of a rubber tree by giving it a drink of water on a hot day. Later, he was on his way to visit his girlfriend, but it began to rain. He cannot catch a cold because, if so, his girlfriend would not kiss him good night, or in any case. So, he leaned against the very same tree to think of a solution. And guess what, the tree “returned a favour” by offering the man a pair of rubbers — just in time to keep his feet dry, or more importantly, to secure his goodnight kiss. And this is supposedly how rubbers were born.

1940.Copyright: Public Domain. Repository: Internet Archive Collections: McGill Daily. The poem “Pome” from the “Odd Verse” section. The McGill Daily Vol.30 No.026: November 5, 1940, Page 1.
Obviously, this story is not meant to be taken seriously. It comes from the McGill Daily as a humorous anecdote complaining about the rainy winter season in Montreal. Instead of explaining the real origin of rubbers, the piece uses playful invention to introduce a common issue: the persistent inconvenience and discomfort of wet and slushy weather. It talks about how frustrating it can be to wear rubbers: rubber boots are too hard to put on and take off, and “half-rubbers,” which seem to promise protection, make things worse by trapping water inside, leaving the owner with two pools of water.
The core of this article is less about footwear and more about how people cope with unpleasant weather conditions. The January thaw, rain, melting snow, and muddy streets disrupt routines and affect mobility. Even more unfortunately, the rubbers, what meant to solve the problem, often bring new ones. The article also points out another shared frustration that you can never really be sure that the pair of rubbers you are wearing is the same one you started the season with. You can build on this point by looking at the kinds of notices appeared in the Daily.

Date: 1942. Copyright: Public Domain. Repository: Internet Archive Collections: McGill Daily. A missing item notice from the “Notices” section. The McGill Daily Vol. 32 No. 053: December 15, 1942, Page 4.

Date: 1942. Copyright: Public Domain. Repository: Internet Archive Collections: McGill Daily. A lost item notice from the “Notices” section. The McGill Daily Vol. 31 No. 083: February 23, 1942, Page 4.
Many of them describe people taking the wrong pair of rubbers, losing theirs, or asking others to return a pair that was taken by mistake. Some try to identify them by size or minor differences, but the problem is clear: most rubbers look almost identical. In such weather, when people were in a hurry and focused on getting out of the rain, it was easy to grab the wrong pair or even end up with two of the same side. Rather than a humorous exaggeration, this suggests a collective experience shaped by the weather
The way the article is written also reveals the writer’s state of mind. The overall exaggerated tone and the absurd story feel like a reaction to being constantly annoyed by the weather. Instead of just complaining directly, the writer turns it into something humorous. It gives the sense that the weather was frustrating enough that the only way to deal with it was to laugh at it a bit. This sense of frustration is also echoed in a short poem titled “Pome” from the “Odd Verse” section in another volume, which captures the experience of dealing with rain more directly. As the poem says, “the smattering, splattering, scattering rain dampens your humour,” describing not only physical discomfort but also the effect on mood. It goes on to mention “there’s trouble of putting on rubbers, which often as not belong to some others,” reflecting the same issue of inconvenience and mix-ups.
Beyond footwear, the poem expands the problem to everything else affected by the weather. Rain drips down collars, soaks clothes, and even turns hats into “a natural pool,” while wind “plays havoc with people’s umbrellas,” which honestly feels very on point for Montreal’s current rainy season. The result is a situation where, no matter what you wear or do, you end up wet anyway. Like the article, the poem doesn’t try to solve the problem; it simply captures the feeling that rainy weather creates a kind of unavoidable, shared mess.
Sources
The McGill Daily Vol. 27 No. 063: January 26, 1938
The McGill Daily Vol. 30 No. 026: November 5, 1940
Ads image and Notice pictures of Lost & Found:
The McGill Daily Vol. 32 No. 053: December 15, 1942
The McGill Daily Vol. 26 No. 075: February 12, 1937
The McGill Daily Vol. 31 No. 083: February 23, 1942
The McGill Daily Vol. 28 No. 040: November 25, 1938
“Do Not Drift:” Convocation at an Uncertain Time
On the day of convocation, May 12, in 1921, students gathered to celebrate their graduation from McGill University. However, something marked the occasion to give it more significance than just a regular convocation at McGill. McGill University was founded in March 1821 by James McGill, making the 1921 convocation ceremony also the 100th year of the university’s existence, its centenary.
Students gathered for convocation on a clear day, with a high of 70F and a low of 46F, according to the Montréal Gazette. The address to students was given by Professor Ira Allan MacKay of the McGill Faculty of Law. He urged students, “Do not throw away your standards because you cannot attain them and above all do not drift. Cease to plan and you will soon cease to perform.”

Montreal Gazette, Friday May 13th Issue Page 5
Many of the students from McGill’s graduating class of 1921 went on to fight in WWII, giving these lofty ideas new relevance and meaning for students. And despite WWII not officially beginning until September 1, 1939, 1921 was a time of great political and social change globally, marked by the start of the Russian famine, the rise of fascism in Italy under Mussolini, and Hitler becoming head of the Nazi party. Though, it was also a year of significant postwar recovery after the end of WWI in November, 1918. The Returned Undergraduates Association Executive was a club that was dedicated to helping male students adjust to returning to civilian life after WWI, shown here in the McGill 1921 yearbook

McGill Yearbook 1921 Page: 276 Description: Picture of the Returned Undergraduates’ Association Executive, the club that was dedicated to helping male students adjust to returning to school and life after their experiences on the front-line during WWI
Progress prevailed in scientific realms; insulin research at the University of Toronto in Canada led by Frederick Banting and Charles Best led to the discovery of insulin in July 1921, a little after the convocation ceremony in May. The first BCG vaccination against tuberculosis was administered in Paris. Women’s suffrage continued to expand, and women in Canada exercise the right to vote for the first time in a federal election, though Indigenous and Asian women were still largely excluded.
At McGill, women navigated increased access to higher education, with 1884 being the first year women were admitted, but still faced restrictions in academic and professional life. The McCord Museum (now McCord Stewart Museum) opened later in the year on October 13, 1921, helmed by female curators including Mary Dudley Muir and Dorothy Warren, the latter of whom focused on a careful inventory of all of the museum’s objects. The postcard of the museum circa 1930 reflects its temporary space,

Description: Postcard- McCord Museum (temporary building) Date: 1930ca Copyright: Public Domain Photo #: PU010193 McGill University Archives- Photo Collection Database
while the photo of the Student Union building from 1925 shows the museum’s current home, as it looked in the 1920s.
Description: Student Union Building (now McCord Museum) Date: 1925 Photographer: Canadian Pacific Copyright: Public Domain Photo #: PR026548 McGill University Archives- Photo Collection Database
As the May 12, 1921 Convocation Program states, the events started with a prayer, a report of the Dean of the graduating class, and a presentation of honours, medals, certificates, and prizes. Convocation was not so different than it is today, though the enrollment of McGill is much higher today—a whopping 40,000 undergraduates and graduates. The total student enrollment at McGill in 1921 was 3,286. In fact, the iconic Roddick Gates, erected in memory of Sir Thomas Roddick, former Dean of Medicine, didn’t exist until 1925, and the University Bookstore didn’t open until 1950.
In 1921, only 13 graduate degrees were conferred. Speaking as a graduate student set to graduate in 2026, hopefully the same won’t be true this year! Additionally, all of the graduate students were from Canada; today, 38% of the 10,200 graduate students at McGill are international students, hailing from over 150 countries. The Foreign Students’ Society Executive posed for a photo for the McGill 1921 Yearbook

McGill Yearbook 1921 Page: 273 Description: Picture of the Foreign Students’ Society Executive
McGill formerly had longstanding quotas on the number of Jewish students admitted to the University, which persisted until the late 1960s, a topic which McGill Professor Judith Szapor in the Department of History and Classical Studies has published extensively about. During this time, the Jewish population in Montréal was growing significantly, reaching 51,287 in 1921, the third largest ethnic group in Montréal. Many of them were recently arrived immigrants from Eastern Europe, especially Russia, Poland, and Romania, fleeing pogroms and other forms of oppression and discrimination.
Non-white students at McGill faced similar barriers, but though small, the Black student population at McGill in the 1920s, 30s, and 40s fought for recognition and inclusion, and as the publication “Black McGill” notes, “These limits did not keep out all exceptional students. Despite obvious racial discrimination, McGill may have offered more opportunities for Black students than many American institutions.” Many of these students also enlisted in the Canadian Military during the First World War, but were often segregated, including in the No. 2 Construction Battalion, the largest Black unit in Canadian history.
Despite being a time of immense social and political change, 1921 was also a key post-war recovery year, which was reflected in the spirit of hope for the future in the Convocation remarks by MacKay. And a sense of humor still prevailed, as vice-principal emeritus Dr. C.E. Moyse stated in an article for the Montréal Gazette: “Unless a University teaches useless things, it is not a University.” Perhaps students today can see their own concerns, stories, and experiences reflected in the convocation ceremony of yore.
Sources
Canada. (2024, October 23). Women in Canadian history: A timeline. Women and Gender Equality Canada. https://www.canada.ca/en/women-gender-equality/commemorations-celebrations/ womens-history-month/women-history-canada-timeline.html
Caputo, A. (2025, February 12). “Quotas: The ‘Jewish Question’ and Higher Education in Central Europe, 1880-1945” edited by Judith Szapor and Michael L. Miller. McGill University Faculty of Arts. https://www.mcgill.ca/arts/article/quotas-judith-szapor
History of McGill Project. (n.d.). McGill University milestones — 1921–1950. McGill University. https://www.historyofmcgillproject.mcgill.ca/1921-1950.html
JGH Archives. (n.d.). Chapter 1: Montreal and the Jewish community in the 1920s (JGH Tribute Book, Chapter 1) [PDF]. CIUSSS Centre-Ouest de Montréal. https://cdn.ciussscentreouest.ca/documents/hgj/JGH_Archives/tributebook/pdf/ch apter1.pdf
Joost, M. (2022, August 17). No. 2 Construction Battalion. The Canadian Encyclopedia. https://thecanadianencyclopedia.ca/en/article/no-2-construction-battalio
McCord Stewart Museum. (n.d.). History of the McCord Stewart Museum. https://www.musee-mccord-stewart.ca/en/history/
Parks Canada. (n.d.). Discovery of insulin National Historic Event. Government of Canada. https://parks.canada.ca/culture/designation/evenement-event/decouverte-insuline-insulin-discovery
UMass Diabetes Center of Excellence. (n.d.). Banting & Best: The discovery of insulin. UMass Chan Medical School. https://www.umassmed.edu/dcoe/diabetes-education/patient-resources/banting-an d-best-discover-insulin/
Montréal June 15th to 17th Weather and Cultural Report
Citation for blog: Elsworthy, Tess, Kozbur, Motrya, Savoie, Mégane, & David, Marie-France. (2026, April 11). Montréal June 15th to 17th - Weather and Cultural Report. Data Rescue:Archives and Weather Blog.https://draw.geog.mcgill.ca/en/connect/blog#Blog153
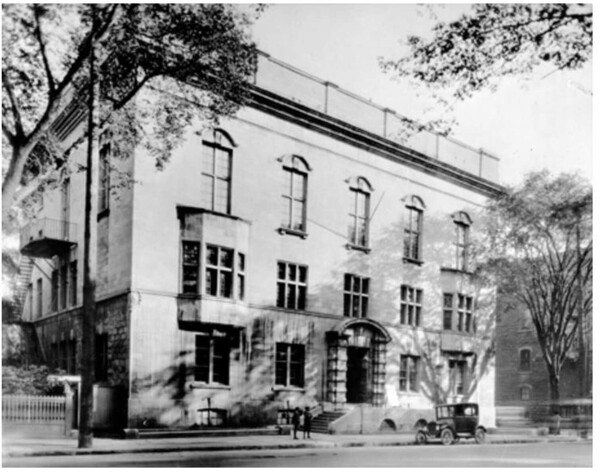
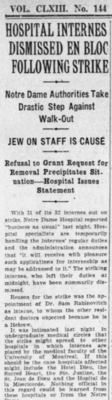
According to data from the DRAW database, clouds filled the sky on the morning of Thursday, June 15th, 1934. That day, Dr. Samuel Rabinovitch, a promising young graduate from the Université de Montréal, walked up the steps to start his internship at the Hôpital Notre-Dame on Sherbooke street. Dr. Rabinovitch may have felt a sense of unease as he entered the building. As the only Jewish intern at the hospital, his fellow interns had already circulated a petition calling for his dismissal, arguing that his place should be given to a Catholic student instead (The Gazette, 1934a). By afternoon, drizzle set in, but the temperature reached a warm 23.3 °C. Tension stirred amidst the temperate weather. At midnight, as the temperature cooled, the other thirty-one interns declared a strike, refusing to perform their duties until Dr. Rabinovitch was removed. This was Canada’s first medical strike, now known as the ‘Days of Shame’ (Days of Shame, 2026).

A photograph of Dr. Samuel Rabinovitch dated June 22nd, 1934, Montreal. Groszman L, Weisz G. A history of the Antisemitic 1934 Montreal Hospital Strike. Can Med Educ J. 2025 Feb 28;16(1):116. doi: 10.36834/cmej.79539. PMID: 40135125; PMCID: PMC11931191
For June 15th, La Presse predicted a cloudy day with evening showers, which did not materialize. As the antisemitic strike continued, data from DRAW shows clouds, “comfortable conditions,” and a high of 21.8 °C. Administrators did not cave to the strikers’ demands, providing a small source of comfort for Dr. Rabinovitch. He should have been looking forward to a pleasant summer, perhaps eating lunch outside in the sunshine and taking short strolls in beautiful Parc La Fontaine, across the street from the hospital. Instead, he was forced to accept that his fellow interns were willing to violate the Hippocratic Oath to exclude him.
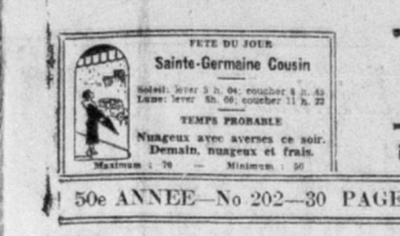
Probable weather for the day is located at the top left of the La Presse front page (1934, June 16th). Partiellement nuageux et plutôt frais. La presse, 1934-06-16, Collections de BAnQ. p.17. https://collections.banq.qc.ca/ark:/52327/2897722
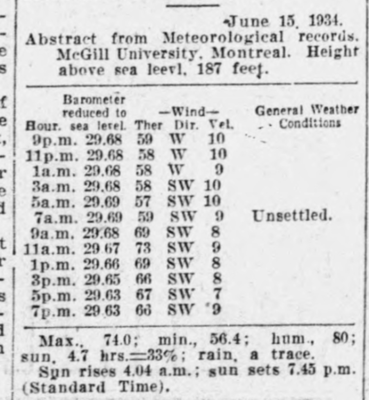
Abstract from the Meteorological records made by McGill University for June 15, 1934. (1934, Jun 16). The Gazette (1867-2014). P. 7 https://proxy.library.mcgill.ca/login?url=https://www.proquest.com/newspapers/june-16-1934-page-7-24/docview/2158755474/se-2
By June 17th, the antisemitic strike spread to four other Montreal hospitals (St. Jean de Dieu, Ste. Justine, Hotel Dieu and Misericorde), with 75 interns choosing not to fulfill their duties, disrupting healthcare for hundreds of patients (The Gazette, 1934d). Finally, on June 19th, Dr. Rabinovitch resigned, explaining that he was motivated by “1st. The direct insult which the Jewish race has just received; 2nd. The plight of those unfortunate and suffering patients of this and other hospitals, who are suffering through lack of proper care occasioned by the strike of the internes; 3rd. The embarrassing position in which the directors of the hospital, who have stood so nobly by me and behaved so decently towards me, are finding themselves in” (Quoted in The Gazette, 1934c, p. 11).
Excerpt from The Gazette concerning the Notre Dame Hospital strike. June 16, 1934 (page 5 of 24). (1934, Jun 16). The Gazette (1867-2014). Retrieved from https://proxy.library.mcgill.ca/login?url=https://www.proquest.com/newspapers/june-16-1934-page-5-24/docview/2158755751/se-2
The strike at Hôpital Notre-Dame in the early summer of 1934 offers a window into the issue of antisemitism in medical education in Montreal in the 1930s, and Jewish community responses to it. Dr. Rabinovitch had been top of his class at l’Université de Montréal, where only six percent of Medicine students for the 1933-34 school year were Jewish. The administration had placed no restrictions on the enrollment of Jews, who tended to gravitate towards McGill alongside fellow graduates of Montreal’s Protestant schools. At McGill, Jews composed about a quarter of the students in the Faculty of Medicine from 1924 to 1927, but the introduction of unofficial restrictions meant that by 1935, only ten percent of Medicine students were Jewish (Anctil, 2006, p. 143). As historian Pierre Anctil notes, while antisemitism at l’Université de Montréal was expressed loudly from the bottom up, discrimination at McGill was enacted quietly from the top down (2006, p. 147).
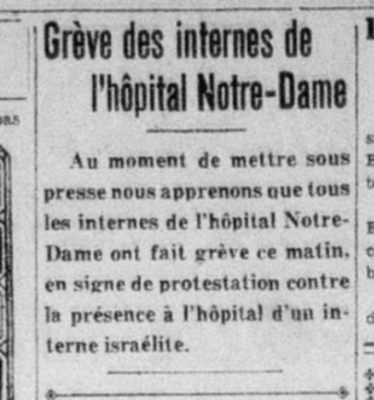
Last-minute addition to the edition of La Presse the day of the strike, stating the start of the strike in the morning. Grève des internes de l’hôpital Notre-Dame. La presse, 1934-06-15, Collections de BAnQ, p.26. https://collections.banq.qc.ca/ark:/52327/2897714
For its part, by 1934, Montreal’s Jewish community had been busy fundraising and constructing the Sir Mortimer B. Davis Jewish General Hospital, a teaching institution where Jewish doctors and allied health professionals could develop and practice their skills without fear of the kind of hiring discrimination Dr. Rabinovitch faced. On 8 October 1934, Canada’s Governor-General, the Earl of Bessborough, placed the last stone of the hospital as thousands of spectators looked on. Jewish General Hospital president Allan Bronfman emphasized “Charity knows not the limitation of race or creed, and it is but natural that this haven of health be open to all” (The Gazette, 1934b, p. 3).
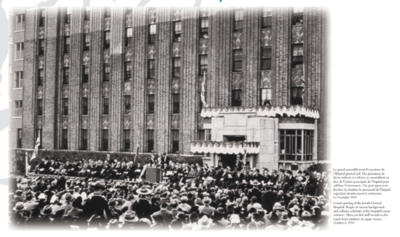
Grand opening of the Jewish General Hospital. The JGH at 75: A Retrospective 1934, part of a collage poster. The JGH at 75: A retrospective. Hôpital Général Juif. (n.d.). https://www.jgh.ca/about-us/jgh-historical-archives/exhibits-digitized-works/online-exhibits/the-jgh-at-75-a-retrospective
McGill Medicine students began doing clerkships at the Jewish General Hospital in 1939, but the University’s relationship to Jewish students remained marked by discrimination. McGill’s ceiling on Jewish admissions to Medicine would remain in effect for at least another decade (Groszman and Weisz, 2024). Despite restrictions, those Jewish students who managed to enrol at McGill distinguished themselves and contributed to student life.
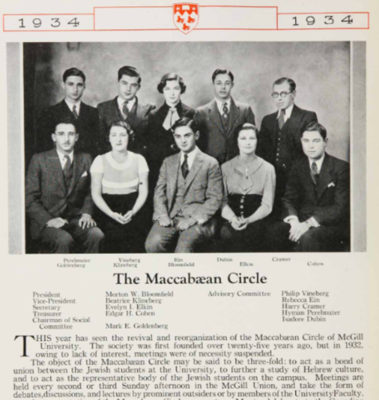
The revival and reorganization of the Maccabaean Circle of McGill University (1934). Old McGill 1934 (vol. 37) (1934). McGill University, p. 266. https://yearbooks.mcgill.ca/viewbook.php?campus=downtown&book_id=1934#mode/2up
In 1934, as Dr. Rabinovitch prepared for his internship, McGill saw the revival of the Maccabæan Circle, a club for Jewish students. Its advisory committee included Isador Dubin, who would graduate with a medical degree from McGill in 1935 and go on to become a renowned pathologist and expert on liver diseases, co-discovering what became known as Dubin-Johnson Syndrome in 1954 (The Gazette, 1980). Despite the antisemitic obstacles they faced, Dr. Rabinovitch, Dr. Dubin, and other Jewish medical graduates enriched the field of Medicine in Montreal and beyond.

Old McGill Yearbook entry for Isador Nathan Dubin, 1935. Old McGill 1934 (vol. 37) (1934). McGill University, p. 22. https://yearbooks.mcgill.ca/viewbook.php?campus=downtown&book_id=1934#mode/2up
Sources
1934 Three hospitals in one year: St. Mary’s. The Jewish General and the Neuro. (2021). McGill Faculty of Medicine and Health Sciences: 200 Years, 200 Stories. https://200.mcgill.ca/faculties/faculty-of-medicine-and-health-sciences/jewish-general-hospital-st-marys-neuro/
Anctil, P. (2006). Interlude of Hostility: Judeo-Christian Relations in Quebec in the Interwar Period, 1919-39. In A. Davies (Ed.), Antisemitism in Canada: History and Interpretation (pp. 135–165). Wilfrid Laurier University Press
Days of Shame. (2026). In Wikipedia. https://en.wikipedia.org/wiki/Days_of_Shame
Dubin, I. N., & Johnson, F. B. (1954). Chronic idiopathic jaundice with unidentified pigment in liver cells. Medicine, 33(3), 155–198. https://doi.org/10.1097/00005792-195409000-00001
Dubin, Isador Nathan. (1935). In Old McGill (p. 22). McGill University. https://yearbooks.mcgill.ca/viewbook.php?&campus=downtown&book_id=1935#page/28/mode/1up
Groszman, L., & Weisz, G. (2024). A history of the Antisemitic 1934 Montreal Hospital Strike. Canadian Medical Education Journal. https://doi.org/10.36834/cmej.79539
Hospital internes dismissed en bloc following strike. (1934a, June 16). The Gazette, 5.
Hospital opening by Bessborough is colorful occasion. (1934b, October 9). The Gazette, 3.
Interne strike won as Hebrew resigns office. (1934c, June 19). The Gazette, 1.
Obituaries. (1980, November 13). The Gazette, 86.
The hospital strike. (1934d, June 20). The Gazette, 12.
The Maccabæan Circle. (1934). In Old McGill (p. 266). McGill University. https://yearbooks.mcgill.ca/viewbook.php?campus=downtown&book_id=1934#page/304/mode/2up
Valentine's Day on the McGill Campus – 100 years ago

AI Image created using approved McGill CoPilot software inspired by an image in the Old McGill , Student Yearbook, 1926 p. 32 https://yearbooks.mcgill.ca/viewbook.php?campus=downtown&book_id=1926#page/32/mode/2up
The St. Valentines Day weather on February 14th, 1926 in Montreal was forecast as cloudy with moderate winds and a light snowfall. The temperature on the day had a high of 29F (-2 C) and a low of 17F (-8C). (The Gazette. 1926-02-15 [p 1]. The Gazette. 1926-02-13 [p 1].)
This was the weather data printed in the Gazette but taken directly from the definitive source for weather information in Montreal, the McGill Observatory located on the University downtown campus near the Arts Building.

McGill Observatory in Winter, 1962. MUA PR0355572. McGill University Archives
Ads in the Montreal Gazette focusing on Valentine’s Day included an announcement from Birks Diamond Merchants in Philips Square stating " The young man presenting his fiancée with her ring on St Valentines Day is but following the ... customs of 'centuries. From the early days of Rome, young people have chosen their "Valentines this- - day." (The Gazette. 1926-02-13 [p 2].)
Canadian Pacific announced a Special Ski Train to Shawbridge on Sunday, February 14th with 6 departures from 8.35-10.15 and return by 8:30 for from the Montreal and Mile End stations. As an extra enticement the railway allowed parties of skiers could bring their skis with them in the train car and not have to place them into checked baggage. (The Gazette. 1926-02-13 [p 7].)
The records of the McGill student newspaper, the McGill Daily, also reveal that students on the McGill Campus were also celebrating Valentine’s Day. Ads highlighted a Celebration Gala at the Venetian with ballons, and party favors as well as a Tea Dance sponsored by the McGill student Scarlet Key Society founded in 1925 to help manage social events at the University.

mcgill-daily-v15-n102-february-13-1926 (2) Ads for Parties. Internet Archive
In addition, there was a headline in the McGill Daily on the History of Valentine cards with an article written by a Daily female reporter.

mcgill-daily-v15-n102-february-13-1926. Headline. Internet Archive
The article provides some insight into how Valentine’s Day was viewed in 1926 as voiced by this reporter. The reporter provided steadfast ties to the history and depth of this social tradition including some poetry. The reported waxed poetically about the receipt of Valentine cards when she was a young girl and how seeing these cards again brought back positive childhood memories. Looking back to the cards created in the Victorian era she portrayed them as tokens of real affection elegantly decorated with flowers, arrows and handwritten poetry.

McGill Daily Staff 1926 McGill Daily Staff 1926 Old McGill yearbookhttps://yearbooks.mcgill.ca/viewbook.php?campus=downtown&book_id=1926#page/30/mode/2up
Citing the research of Alice Van Leer Carrick (an American antique collector and author who wrote an article in February 1923 titled “Valentines of our Grandmothers’ Day” for Ladies’ Home Journal) she traced the creation of handwritten rudimentary cards back to Roman times, followed up with the development of the card tradition in Europe to the 17th century and supplied examples of the poetry used in these gifts. She characterized Victorian cards as both sentimental and virtuous with churches and Union jacks in very card. After praising the sentimentality of a card consisting of an image of a mirror decorated with laurel leaves and a verse ‘Reflect in the mirror see All that is beautiful to me’, the reporter announced looking forward to both receiving and sending Valentines and encouraged students to go to the nearest bookstore to purchase and send cards. Of special note in the image of the McGill Daily staff in 1926 one can see the rarity of woman student reporters and subsequently the dearth of women's narrative voices in 1926 McGill. /p>
Sources
Aeron MacHattie, Archivist, Rare Books & Special Collections Sweater Weather: Cozy Notes from the Archives, Library Matters, December 2, 2020 https://news.library.mcgill.ca/sweater-weather-cozy-notes-from-the-archives/
February 13, 1926 (page 1 of 28). (1926, Feb 13). The Gazette (1867-2014) Retrieved from https://proxy.library.mcgill.ca/login?url=https://www.proquest.com/newspapers/february-13-1926-page-1-28/docview/2158546086/se-2
February 15, 1926 (page 1 of 22). (1926, Feb 15). The Gazette (1867-2014) Retrieved from https://proxy.library.mcgill.ca/login?url=https://www.proquest.com/newspapers/february-15-1926-page-1-22/docview/2158599960/se-2
Introducing new DRAW member: McGill School of Information Studies Practicum student Zoe Hu
Introducing…
Who:
Zoe Hu
From:
Nanjing, China
Role at DRAW:
My role is to conduct weather-related and community-based research for DRAW, specifically for the McGill community in the pre-1900 era. I also contribute to outreach through blog writing, social media content creation, and user interface improvement.
Favourite part of DRAW?
I like how DRAW connects research with community engagement and social media. This kind of integration is something I’ve always wanted to try before. I also find weather-related topics interesting.
Favourite Season?
Autumn
Favourite Weather Symbol? (with image) Why?

Lunar corona. This symbol looks like a mystical symbol. I’m particularly interested in mysticism, especially lunar-related, so this symbol is really appealing to me.
Favourite Cloud Type? Why?
I like stratocumulus clouds for their soft, clustered forms and low height in the sky. These attributes always evoke a sense of texture and make them feel tangible. You could imagine how they would feel when you touch on it, like cotton balls.

Source: Stratocumulus perlucidus clouds over the midwestern United States, by Arun Kulshreshtha, CC BY 3.0 US, via Wikimedia Commons
Coolest thing you’ve learned while participating in DRAW?
Learning how historical weather records from centuries ago were documented and transcribed is fascinating! I enjoy researching weather data and its impact at that time, and connecting them with the present. Working with these records also makes that era feel much closer, and I also realized how systematic the observation and research already were at the time.
And of Course:
Sweet or Salty?
Sweet
Star Wars or Star Trek?
Star Trek
Cats or Dogs?
Dogs
Favourite Animal?
Sika deer
Favourite place in Montreal?
A sewing supply store called Rix Rax. It has a giant button on its storefront that feels magical. It is filled with all kinds of accessories like antique silks, lace, flowers, buttons and beads. I love remaking objects and clothes, so this place is like a rabbit hole to me.
Mercury Reaches Highest Point in Forty Januaries: 1932 Winter time??
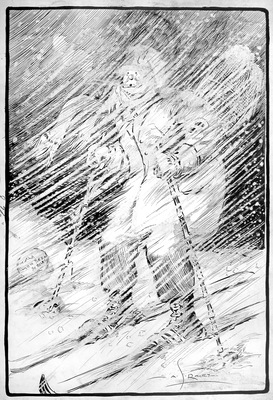
Skiing to Montreal. Artist: Arthur George Racey (1870-1941). Date1920-1930.Origin Montreal, Quebec.Canada. Object NumberM2005.23.72. Collection McCord Museum. Credit: Gift of Susan Racey Godber and Margaret Racey Stavert.
In contrast to this image of a harsh winter in Montreal there was often a temporary reprieve in January in the form of a thaw. This led to a reporter from the McGill student newspaper, the McGill Daily, to investigate the history of January thaws in Montreal under the front-page headline “Mercury Reaches Highest Point in Forty Januaries”. (McGill Daily January 15th, 1932.)
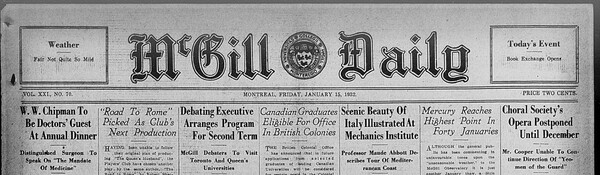
McGill Daily.mcgill-daily-v21-n070-p.1 Internet Archive.
This headline was the lead into a humorous view of the weather supplied in a short article that has been reproduced (after some editing using the poor OCR rendition of the article) below.
Although the general public has been commenting in unfavorable tones upon the “unseasonable” weather, to the McGill Observatory it is just another January thaw—a little milder than usual perhaps, but no occasion for excitement.
Today the thermometer registered 53 degrees (Fahrenheit or 12 degrees Celsius), a high temperature not reached in January since 1890. However, colder weather is predicted in a day or two, so prospective skiers may have some fun this weekend after all.
Scientists have been known to remark that as we get farther from the Ice Age, the winters become milder, and statistics certainly seem to bear them out. At that rate, in a few thousand years snow will be quite unknown to Canada. However, as such a lamentable state is still some distance away, we can count on Jack Frost for a few years yet.
The influence of the scientific weather data produced by then on-campus and often consulted McGill Observatory was clearly shown by the precision on the information supplied. From the weather data garnered from the Observatory’s logbooks the student was able to trace back from 1932 to 1890 to find the last time this temperature was reached.
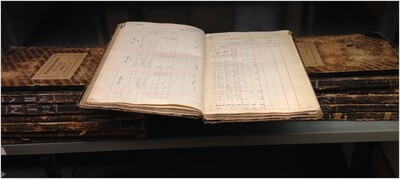
Photo of McGill Observatory Weather Ledgers, taken in 2017 by Gordon Burr.
The same weather data that the DRAW (Data Rescue: Archives and Weather) project seeks to reclaim and make available to scientists in data base form was being used by the student reporter to provide factual accuracy to the story and ease concern about weather change.
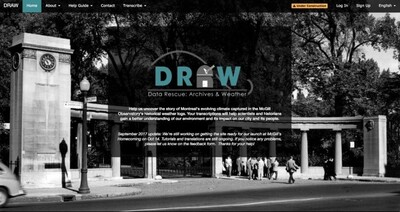
Screen shot of DRAW (Data Rescue: Archives and Weather) web page taken by Gordon Burr in 2025.
The reporter mused that as humanity moves “farther from the Ice Age,” winters grow milder—an observation confirmed by scientists of the time. The end of the Ice Age was caused by natural stable cycles over thousands of years causing the ice to retreat, thereby enabling humans to establish themselves in a variety of social settings. The reporter was exaggerating this in a humorous way to imply that the disappearance of snow was a possibility, however the reality today in 2026 is far different based on a factor not as evident in 1930s the current impact of humans on climate change.
The reporter’s usage of the symbol of Jack Frost as the personification of winter is quite an apt one to help reassure his 1932 readership of the return of winter. However, modern global warming stoked by industrialization inducing contaminants such as carbon dioxide into the atmosphere has left us far closer to having less snow and ice cover and exposure to extreme weather events then the thousands of years envisioned in this article.
In a very positive note the reporter noted that skiers would be pleases to have the colder weather in order pursue their pastime.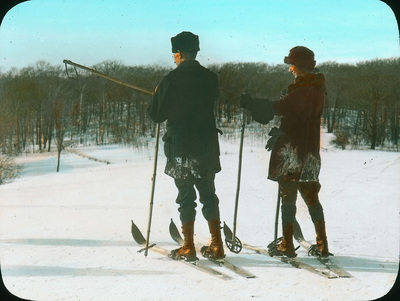
Transparency. Skiers on Mount Royal, Montreal, QC, about 1930.Date About 1930. Origin Canada: Object NumberMP-0000.25.1022. Collection: McCord Museum. Credit: Gift of Stanley G. Triggs
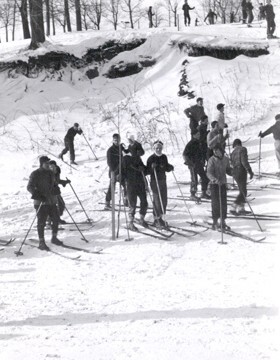
Description: Skiers on Mount Royal. Date:1936. Copyright: Public Domain. Photo #: PU025504. MUA McGill University Archives.
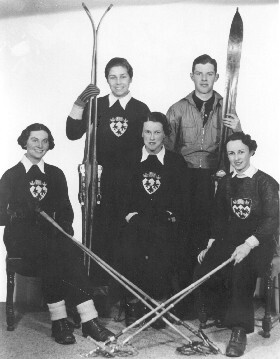
Description: Ski team of 1935-1936. Date:1936. Photographer: L. Boris. Copyright: Public Domain. Photo #: PR001127. MUA McGill University Archives.
Copping with winter is often portrayed as engaging with the snow and cold as an intrinsic part of Canadian life and skiing is a key element in this view. McGill University alumni and students were important part of the creation of the Quebec skiing infrastructure through the Red Birds Ski Club founded in 1928. The Red Birds set up ski races in the Laurentians, encouraged cross country and ski jumping and trained the McGill student ski team. In late 1932 the Red Birds and the McGill Ski Team went to St. Moritz in Switzerland to compete with the Oxford-Cambridge ski teams.

Description: The Red Birds Ski Club, also known as the McGill ski team, in St. Moritz, Switzerland, including William Ball and Frederick B. Taylor. Date: 193201.Copyright: Public Domain. Photo #: PU027511. MUA McGill University Archives.
Sources
https://archive.org/details/McGillLibrary-mcgill-daily-v21-n070-january-15-1932-8088/mode/2up?q=%22thaw%22
https://skimuseum.ca/memorable-moments/the-mcgill-red-birds-ski-club/
https://redbirdsskiclub.com/history/
Frosty Financing: Weather Stock on the Temperature Exchange

Headline Frosty Financing mcgill-daily-v24-n068-january-31-1935_2 .Internet Archive.
In January of 1935 a McGill Daily reporter, under the nom de plume of McParlfootin, produced a short satirical piece with the headline banner of Frosty Financing, laced with weather related humor to take everyone's mind away from the freezing snowy winter in Montreal. The hero of the story was an enterprising commerce student who was unable to escape the winter by voyaging to the warmer climes of Bermuda and sought to sell stock on the fictional Temperature Exchange styled as a worthy competitor to the Montreal Stock Exchange.
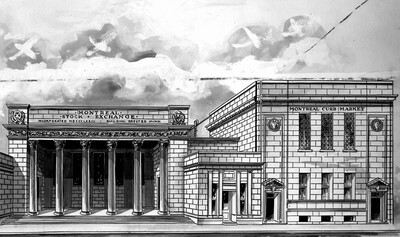
Rendering of the Montreal Stock Exchange and Canadian Stock Exchange.1928 https://www.m-x.ca/en/about-us/mx/historical-highlights Montreal Exchange
The concept was simple to buy and sell degrees Fahrenheit through stocks aptly titled Westmont Heights Preferred, and Montreal West Exaggerated. Like the real-life trading on the Montreal Stock Exchange; the investor sought to buy low and sell high. For example, the Westmount Heights Preferred was purchased at two below Fahrenheit and then sold the next day at thirty-six above Fahrenheit thereby making a killing in degrees of temperature by selling the shares at a significantly higher price after their purchase
The stock exchange expertise of the commerce student was also on display in the next transaction where the investor speculated with Montreal West Exaggerated stock by selling short on this investment. The stock was not owned by the entrepreneur, but the student held a right to purchase it by a certain date. Waiting until the stock decreased in value the next day based on a hunch that snow was coming, thereby lowering the temperature, the student then purchased it at a lower price

Temperature Exchange. Jpg Created by Gordon Burr on December 1 using McGill University MS CoPilot.
The investment strategy of the commerce student suffered a severe setback by following poor investment advice from an unreliable source causing the purchase of Griffintown Gazionim stock at 86 degrees Fahrenheit in the middle of a heat wave and then only selling it the wintertime on the Manitoba market at 52 degrees Fahrenheit below zero. The stock investment career in ruins the student returned to the University and resumed the previous doomed scheme of selling armaments to clients staunchly opposed to the arms race.
As a parting piece of advice, the student reporter ironically states; "Let it be known that we do not favor gambling in any form. But if you must, try the Canadian climate. It’s grand!”
Sometimes the stereotypes utilized to exaggerate the point in humor also reflect real life issues and problems. In this article the reporter supplied an analogy of the poor business sense of the commerce student by seeking to sell arms to two anti-war supporters; the League Against War and Fascism and the well-known Indian leader and pacifist Mahatma Ghandi.
The League Against War and Fascism is an interesting choice and certainly already well known to the McGill student reporter for its McGill campus activities before the creation of the weather investment story. The League was an international movement created in the early 1930s to oppose fascism and militarism by bringing together groups opposed to this political agenda.

Headline Pacifists Meeting mcgill-daily-v24-n028-november-08-1934_1. Internet Archive.
In the McGill Daily of November 8th, 1934, a headline signaled the arrival of the League on Campus by announcing “Pacifists At McGill Hold First Meeting : Gathering in Strathcona Hall Next Monday Night” describing the League as having groups at various Canadian and American Universities and heralded the support of some McGill professors for this effort. (McGill Daily Vol. 24 No. 028 1934, November 08.) Although the professors were not named McGill professors such as Eugene Forsey and Frank Scott were among those who had an impact on student campus activities. See blog by Raffaella Cerenzia on the impact of socialist professors on students in the 1930’s.

Headline Students and War Part 1 mcgill-daily-v24-n028-november-08-1934_2. Internet Archive.
Later in the same issue an editorial was featured supporting the peace effort positing no large-scale public support for war and blaming the armament manufacturers for pushing this agenda for their one profits. While acknowledging that as part of the British Empire a declaration of war by Britain would mean in effect war for Canada the editorial couched student movements for peace as a positive voice to place pressure on Canadian politicians to keep Canada out of a war. Events made it impossible for Canada to stay out of the Second World War just a few years away in 1939
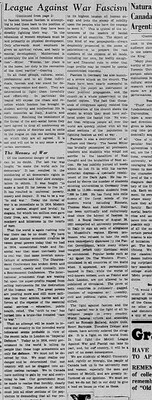
Headline Students and War Part 2 mcgill-daily-v24-n028-november-08-1934_4. Internet Archive.
Sources
McGill Daily Vol. 24 No. 028 1934, November 08) https://archive.org/details/McGillLibrary-mcgill-daily-v24-n028-november-08-1934-8378
https://archive.org/stream/McGillLibrary-mcgill-daily-v24-n028-november-08-1934-8378/mcgill-daily-v24-n028-november-08-1934_djvu.txt
McGill Daily Vol. 24 No. 068 (1935, January 31) https://archive.org/details/McGillLibrary-mcgill-daily-v24-n068-january-31-1935-8418/page/n1/mode/1up
Raffaella Cerenzia https://activehistory.ca/blog/2025/06/27/professors-or-propagandists-mcgills-socialist-professors-and-their-students-in-the-1930s/ . Accessed June 25, 2025.
McGill University Archives – Finding aid – The Montreal Exchange https://archivalcollections.library.mcgill.ca/index.php/montreal-stock-exchange-la-bourse-de-montreal-fonds
McGill Observatory stormed by a nosy McGill Daily reporter!
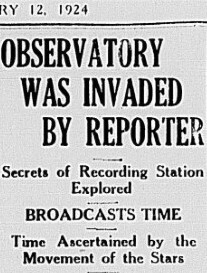
Headline -The McGill Daily Vol. 13 No. 075 (1924, Jan 12) https://archive.org/details/McGillLibrary-mcgill-daily-v13-n075-january-12-1924-7032
A headline in the McGill Daily announces the invasion of the Observatory by a student reporter. The humor laced undertones of the report make some specific references to the weather, as well as supplying a glimpse into the workings and equipment used by the Observatory. The interview with the Director of the Observatory Prof. A.J. Kelly whom the student affectionally called the weather man was eventful as the mysteries and secrets of the Observatory were revealed to the gate crasher.
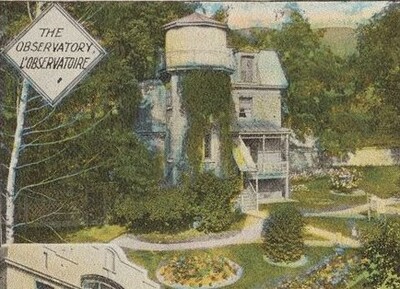
McGill University = Université McGill : observatory = observatoire : engineering building = génie civil : new medical building = faculté de médecine : arts building = beaux arts / Éditeur :[Brooklyn, New York] :[Miller Art Co.],[entre 1922 et 1927?]. Genre :Cartes postales. Description matérielle :1 carte postale : couleur ; cm. Notice détaillée :0004746347. Lien: https://collections.banq.qc.ca/ark:/52327/2551031
The importance of the Observatory, from its campus location just west of the Arts Building’s Molson Hall, as the Montreal weather forecaster generating all the weather reports published daily in Montreal newspapers was nicely highlighted.

Ingrid Birker Blog 2009 https://www.mcgill.ca/meteo/files/meteo/the_nations_timekeeper_mcgill_and_the_dominion_observatory-_mcleod.pdf
The reporter was keen to mention another lesser-known role played by the Observatory as a time keeping and broadcasting station. The chronograph maintained by the Observatory and utilizing the data created by the movement of the stars over the McGill meridian could help ensure the accuracy of the time kept by the station’s master clock.

An old chronograph at the McGill Observatory, still in use. 1962ca. Date: 1962ca.Photo PR010548. McGill University Archives
The clock carefully encased in a partial vacuum produced the most accurate time standard in Canada. This time data could then be sent by telegraph tickers across the city to the Observatory in Toronto and at 11:00am to all the railway stations in North America. The McGill Clock did indeed ensure the accuracy of train scheduling across the country.
Clock used for time signals at the McGill Observatory. Date: 1962 11. Photo PU010568 McGill University Archives.
Not all the weather gathering equipment was in the station itself with some adjacent to the station in what many students mistook to be bird houses or beehives, according to the reporter. These enclosures housed thermographs and barometers to track atmospheric pressure and temperature. There was also a thermometer that monitored the heat from the sun and a rain gauge to collect data on both the intensity and extent of the precipitation.

The Observatory, McGill University, Montreal, Canada. Publisher: Province of Quebec, Tourist Bureau; [194-?]. Postcards Subject : McGill University.Physical description:1 postcard: col. Detailed instructions:0004443046.https://collections.banq.qc.ca/ark:/52327/2386317
The Observatory had also constructed a tower on Mount Royal with a device to capture wind velocity connected directly to a gauge in the on campus building.
This final humorous weather prediction by the Daily reporter playing weather forecaster reveals how the state of winter weather was on everyone's mind in January of 1924. Just as it is in November of 2025 in Montréal just after our first snowstorm of the year.
"All in all the adventure was so exciting and Interesting that the enthusiastic reporter forgot to ask about the weather forecast. However, he predicts that we will get a very heavy snowstorm but declines to reveal just when it will arrive."
For everyone who reads this blog and has had the pleasure of rescuing weather data from the images of the weather registers, these are the instruments used to gather this precious resource.
Sources
The McGill Daily Vol. 13 No. 075 (1924, Jan 12) https://archive.org/details/McGillLibrary-mcgill-daily-v13-n075-january-12-1924-7032
Nancy Bignall, McGill Observatory Through 100 Years, McGill News, Summer 1962 Reprint from the McGill News- Nancy Bignall 1962 https://cmosarchives.ca/History/McGillObservatory1965.pdf
Ingrid Birker Blog 2009 https://www.mcgill.ca/meteo/files/meteo/the_nations_timekeeper_mcgill_and_the_dominion_observatory-_mcleod.pdf
https://reporter.mcgill.ca/measuring-climate-and-its-change-at-mcgill-since-1874/
Winter Snowstorms and Fictional Railroad Transportation Disruptions in 1925
Winter blizzards cause disruption to service along the railroad transportation system in Canada but since the 1850’s the railroads had developed special ploughs attached to the front of one or more locomotives to help dislodge the snow from the tracks.
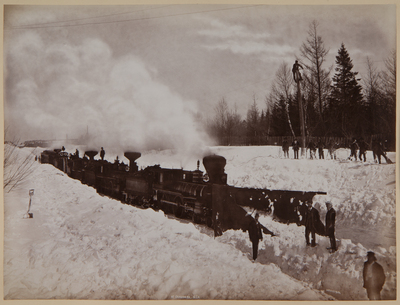
Description: Grand Trunk Train in Snow, Chaudière, near Quebec City, QC, 1869. Photographer: Alexander Henderson. https://collections.musee-mccord-stewart.ca/en/objects/106709/train-du-grand-tronc-dans-la-neige-chaudiere-pres-de-quebe?ctx=5cafedc4a1943c87f70db9252e987be2222401d8&idx=0
The use of comedy to lampoon extreme weather events, such as winter blizzards, speaks to the power of humans to endure by poking fun at ourselves and thereby coping with the predicaments that we often find ourselves in. In this case, the McGill Daily student newspaper reporter posits the absurdity of the situation by drawing the analogy of trains arriving on crutches because of snowstorms.
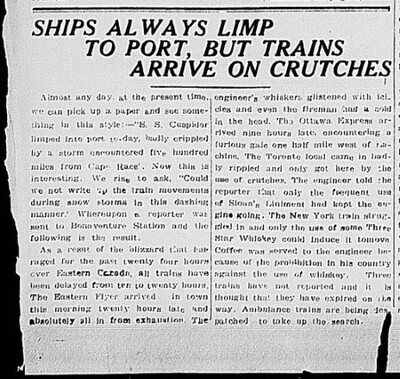
Headline McGill-daily-v14-n088-february-04-1925_1
This speaks to the image of the struggles on trains to make their scheduled runs in the face of extreme weather, but it also serves as a metaphor for resilience. Despite the difficulties caused by snow on the tracks delaying the arrival of trains, the train crews both in the narrative of the reporter and in real life managed to succeed, albeit more slowly than usual by demonstrating flexibility and recovery in the face of adversity.
The McGill Daily student newspaper reporter seeking to investigate how an analogy like the one applied to ships damaged at seas as limping into port could be applied to late arriving trains in snowstorms. In the best tradition of investigative reporting, the reporter journeyed to the Bonaventure train station in Montreal and provided this humorous somewhat exaggerated and imaginary report based on this research.
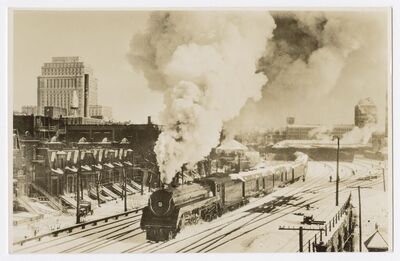
[C.P.R. Windsor Station : leaving Montreal, winter 1928]. Allston, Mass. :Railroad photographs,[1928]. Cartes postales.: Collection Pierre Monette https://collections.banq.qc.ca/ark:/52327/4254958
"As a result of this blizzard raging for the past twenty-four hours over Eastern Canada, all trains have been delayed from ten to twenty hours. The Eastern Flyer arrived in town this morning twenty hours late and the crew was absolutely all in from exhaustion. The engineer's whiskers glistened with icicles and even the fireman had a cold in the head. The Ottawa Express arrived nine hours late, encountering a furious gale one half mile west of Lachine." Quote from McGill Daily article cited in sources
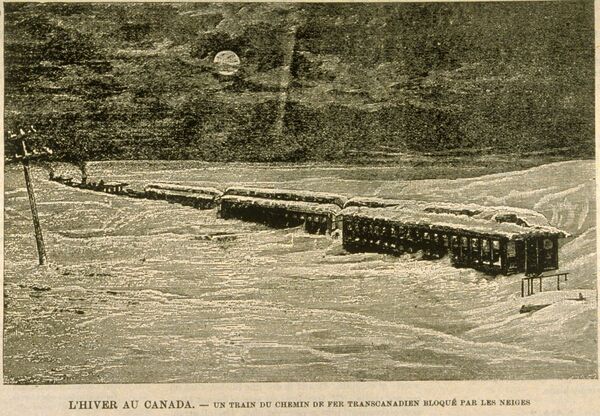
L'hiver au Canada Un train du chemin de fer transcanadien bloqué par les neiges. Le Monde illustré, Vol. 17, no 876 (16 février 1901), p. 710.https://collections.banq.qc.ca/ark:/52327/2074027
"The Toronto local came in badly crippled and only got here using crutches. The engineer told the reporter that only the frequent use of Sloan’s ointment had kept the engine going. The New York Irwin train struggled in and only the use of some Three Star Whiskey could induce it to move. Coffee was served to the engineer because of the prohibition in his country against the use of whiskey. Three trains have not reported, and it is thought they have expired on the way. Ambulance trains are being dispatched to take up the search." Quote from McGill Daily article cited in sources
The text of this account comes from the text-based document created by the full text page feature of the Internet Archive which was then edited to remove characters captured incorrectly in the OCR and their replacement by the correct character. Due to the poor quality of the original microfilm image the OCR program had problems capturing the characters correctly and produces noise such as ” Could \ve not write •;»» the train movements”.
The reporter applied the analogy of trains arriving on crutches in the case of the Toronto local train’s snowstorm experience and used this in the headline for the article. Although all the events reported upon have been exaggerated for comedic effect, we can still feel personally how major disruptive events like snowstorms or blizzards have disrupted our everyday life. Moreover, in the case of 2025, one hundred years after this report given the revolution in transportation systems in Canada we are far more likely to have experienced this type of inconvenience at airports rather than railway stations.
Sources
The McGill Daily Vol. 14 No. 088 (1925, Feb 4) https://archive.org/details/McGillLibrary-mcgill-daily-v14-n088-february-04-1925-7171
Canadian Rail (Newsletter) published monthly by the Canadian Rail Association, St. Constant, Quebec. No.361, February 1982. https://exporail.org/canrail/canadian_rail_1962_1989/canadian-rail-361-1982.pdf
Help the McGill Faculty of Arts Ship is Sinking!
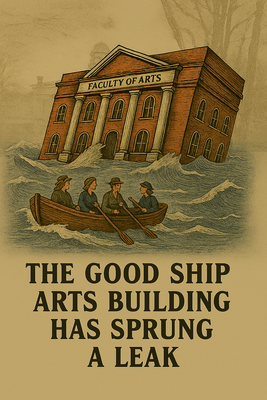
Leaky Arts graphic design vintage photo with PR028704 from the MUA as background created by Gordon Bur on Nov.1 2025 using McGill approved CoPilot Chat box.
The use of humor to enable humans to persevere in difficult conditions is another tool in the arsenal of societal resilience to keep carrying on despite the disturbance and chaos engendered by disruptive weather conditions. (Sachs, Stay Cool, Prologue) (Mergen, Weather Matters, conclusion). The themes of humor and resistance to weather calamities come together in a short article in the McGill Daily in 1926 written by a student clearly fed up with the impact of winter weather on classroom activities in the Faculty of Arts Building.
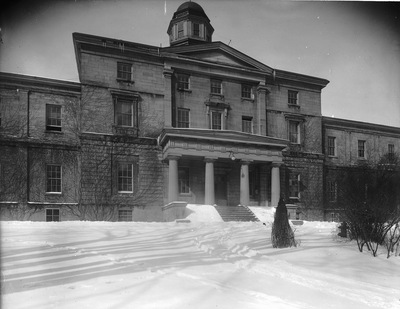
Arts Building, McGill University, Montreal, QC, 1913.Wm. Notman & Son (1882-1919).Date1913.Origin Montreal, Quebec, Canada. Object Number VIEW-12873. https://collections.musee-mccord-stewart.ca/en/objects/141446/pavillon-des-arts-mcgill-college-montreal-qc-1913?ctx=a5e58200893a9098e29b3258615bedda0a15d385&idx=14
The student presents this weather-oriented analogy to link the situation in the Arts Building to a sinking ship and utilizes maritime illusions to exaggerate the chaos with this headline:

McGill-daily-v06-n122-march-10-1917_0000 Headline
The student spun a short tale about the leakage of water into a classroom on the first floor of the building and described how the janitor had been mopping up or catching the dripping water in pails and bathtubs for quite a while. Before any professor can give a course in Room 113 the janitor had to mop up and empty the receptacles.
He describes how the University had personnel clearing the roof of ice and snow for the entire winter, but a recent thaw had dramatically increased the volume of water cascading into the classroom. The change was described as from a drip in a hole in the ceiling to now “pour(ing) through in a miniature cataract, which makes it necessary to change bathtubs and pails every hour.” (McGill Daily Vol. 06 No. 122 (1917, March 10).
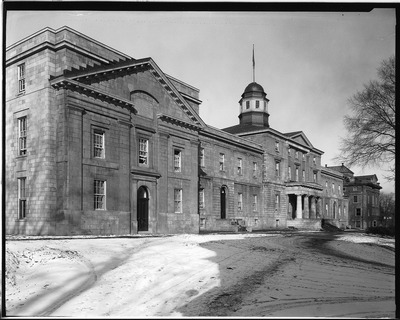
Arts Building, McGill University, Montreal, QC, 1926-27.Wm. Notman & Son Ltd. (1919-1954. Date1926-1927. Origin Montreal, Quebec, Canada Object NumberVIEW-23798 https://collections.musee-mccord-stewart.ca/en/objects/103732/pavillon-des-arts-mcgill-college-montreal-qc-19261927?ctx=785c727a65595fcd48df14b5ff0f8ca286a7a047&idx=26
The drama for the story is heightened through a description on how the water flowed into desks rendering them unusable with the sheer volume of water causing the “ceiling in one place (to be) in imminent danger of collapse. And that explains why so many groups of students, with a professor at their head, may be seen these days wandering about the Arts building in search of a classroom which is vacant and at the same time weather-tight.” (McGill Daily Vol. 06 No. 122 (1917, March 10)
The chaos and damage caused by this leaky ceiling in a classroom in the McGill Arts Building was portrayed in a comedic manner including poking fun at the University administration for a failure to take more effective remedial action beyond catching the water in bathtubs and mopping the floors. The infrastructure problems of this oldest building at McGill were addressed only in 1926 when the interior was completely reconstructed. (McGill Milestones, 1914-1938 section)
Sources
The McGill Daily Vol. 06 No. 122 (1917, March 10) https://archive.org/details/McGillLibrary-mcgill-daily-v06-n122-march-10-1917-6190
Editorial Monthly Weather Review. The Unexpected Humor of Monthly Weather Review. Sean Potter and David M. Schultz. DOI: https://doi.org/10.1175/MWR-D-22-0212.1 Page(s): 2207–2211
Bernard Mergen, Weather Matters, An American Cultural History since 1900, University of Kansas University Press, 2008
Sachs, A. (2023). Stay cool : why dark comedy matters in the fight against climate change. New York University Press. https://public.ebookcentral.proquest.com/choice/PublicFullRecord.aspx?p=30180157
Peter F. McNally, 7th edition, 2023 https://www.mcgill.ca/jms/mcgill-milestones/1914-1938
Winter Weather Playing Pranks on Everyone!
The report from the Gazette in November of 1926 announced unexpected but welcome news of exceptionally mild weather for the day of 66 degrees (Fahrenheit) or 19 degrees Celius).

Headline November 17, 1926 (Page 5 of 22). (1926, Nov 17). The Gazette (1867-2010) Source -ProQuest database.
The typical Montreal winter, as depicted in the images below, was usually snowy and cold.
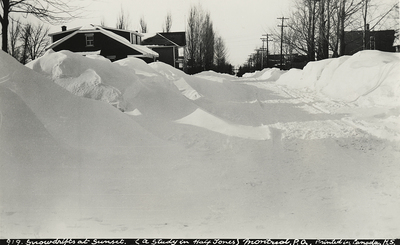
"Snowdrifts at Sunset" on residential street, Montreal, QC, ca. 1925.Photographer: Harry Sutcliffe (1878-1942).Date: About 1925.Object NumberM2011.64.2.2.394 https://collections.musee-mccord-stewart.ca/en/objects/354293/snowdrifts-at-sunset-on-residential-street-montreal-qc?ctx=3147b55cbc05aa2ac631208c752f89c0664b9085&idx=671
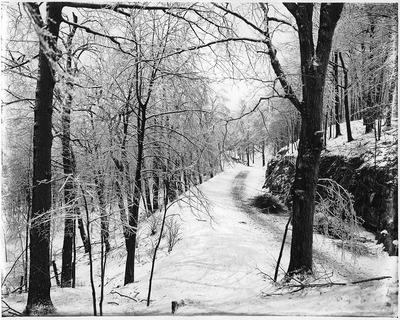
Winter in Mount Royal Park, Montreal, QC, about 1920.Photographer: Wm. Notman & Son (1882-1919).Date: About 1920.Object NumberVIEW-6438 https://collections.musee-mccord-stewart.ca/en/objects/137181/lhiver-dans-le-parc-du-montroyal-montreal-qc-vers-1920?ctx=a0a2760e6d4e0b8d3ba874a9ac595d3de0dab14e&idx=66
Relying on research garnered by the McGill Observatory, the reporter could report that the mild weather in the month of November had been exceeded only twice in the past 52 years. This evidence was based on the keeping of weather data by the Observatory back to its origins in the 19th century. Drawing upon these records and an interview with an Observatory staff member, the reporter could provide the exact dates in November of 1883 and 1888 when the temperature slightly exceeded the current readings. The rationale for the current increase in temperature was ably supplied as the prevalence of southerly winds for more than 24 hours and the prediction by the Observatory of heavy rain during the day happened at about 3:00 pm.
The key societal role of the Observatory as the purveyor of scientific data to the Montreal community was clearly shown with this interaction but of course part of the interest in weather is its unpredictability and the constant tension between order and disorder as a metaphor for the human condition. (Mergen, Weather Matters, p.320-321).
This tension caused the reporter to classify the surprising changes in weather in terms as being “tricky of late”. The observatory official (not named) raised the issue of the surprises found in the weather despite the scientific predictions for example “Over last weekend the barometric readings indicated that, to all intents and purposes, the weather should have been fair. But the weather man chose to be contrary, and snow fell nearly all Saturday afternoon and evening.” The same official presented the weather in a humorous fashion as playing tricks.
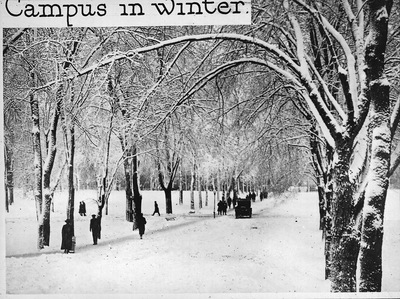
Campus and Avenue in Winter, McGill University, Montreal, QC, about 1925.Photographer/Unknown.Date About 1925.Object NumberMP-0000.25.244 https://collections.musee-mccord-stewart.ca/en/objects/165459/campus-et-avenue-en-hiver-universite-mcgill-montreal-qc?ctx=1d8daebb730b7e11e57ac0e5beaa318c4b8bddbf&idx=26
Weather is used to describe how life feels. Just like the weather can be calm for one moment and stormy the next, our lives can shift between feeling peaceful and chaotic. Sometimes things go as planned and sometimes they do not. We are all vulnerable to disruptive weather events from blizzards to winter thaws and heavy downpours due to ever shifting weather patterns, but the use of humor is one way that we can respond to show human resilience as a community to the chaos and uncertainty of weather. The Montreal weather may not be as bad as it appears in this cartoon, but we can perhaps find a chuckle in the obvious over exaggeration utilized!
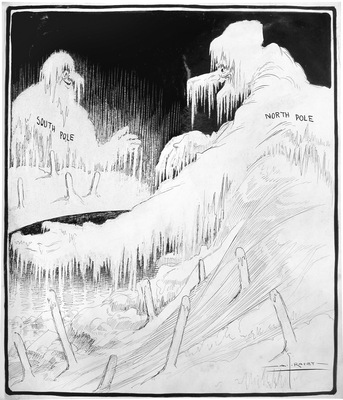
The Meeting of North and South Poles. Artist: Arthur George Racey (1870-1941).Date1911?.Origin Montreal, Quebec, Canada.Object NumberM2005.23.11 https://collections.musee-mccord-stewart.ca/en/objects/229356/la-rencontre-des-poles-nord-et-sud?ctx=9d771fdc14669af3f93cb33b5254714ee0202ceb&idx=401
Sources
November 17, 1926 (Page 5 of 22). Weather Playing Pranks (1926, Nov 17). The Gazette (1867- 2010) https://proxy.library.mcgill.ca/login?url=https://www.proquest.com/historical- newspapers/november-17-1926-page-5-22/docview/2158574041/se-2
Bernart Mergen, Weather Matters, An American Cultural History since 1900, University of Kansas University Press, 2008
1926 Heat Wave in Montreal – News from the Observatory
The headline in the Saturday Gazette on July 31st 1926, Torrid Weather May be Looked For, announced the type of hot weather Montrealers had been experiencing for the entire month of July and the reporter was looking forward to predicting weather for August. Since this heat was clearly on everyone's mind the Gazette reporter for this story went to the best weather source in the city, the McGill Observatory, to interview the Director Prof Albert J. Kelly and procure records to set the facts straight on just how bad July of 1926 really was and to procure the forecast for the month of August.

July 31, 1926 (Page 5 of 20). Torrid Weather (1926, Jul 31). The Gazette (1867-2010) https://www.proquest.com/docview/2158525159?sourcetype=Newspapers
In the 1920s, the residents showed resilience in the face of this hardship within the context of this era’s urban landscape (no air conditioning), communication technologies (newspapers) and societal norms by seeking solace when and where they could. The network of city parks such as Mount Royal and La Fontaine Park provided shade and open green spaces for social events and quiet relaxation.
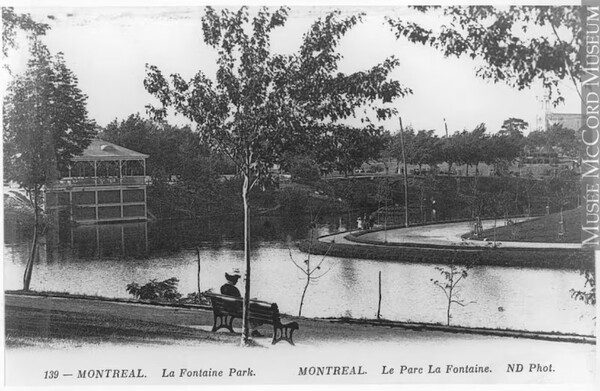
La Fontaine Park in Montreal, circa 1910. (Neurdein Frères/McCord Museum) https://www.cbc.ca/news/canada/montreal/parc-lafontaine-photos-timeline-archives-montreal-1.3553528
If the person could travel, they could cool off by swimming in rivers or lakes close to the city or take advantage of the informal community pools that popped up in the urban streets when hoses were attached to fire hydrants and children joyfully played in the water supplied.
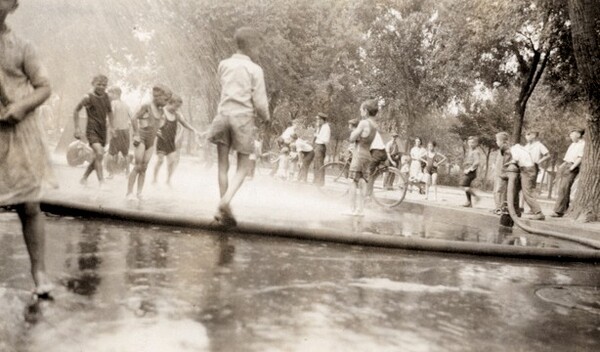
Children in Street with water supplied from a fire hydrant, ca. 1930. McGill University Archives. PU025623

Children in Street in wading pool, ca. 1930. McGill University Archives. PU02562.
Refreshments were also available including ice cream vendors and cold beverages.
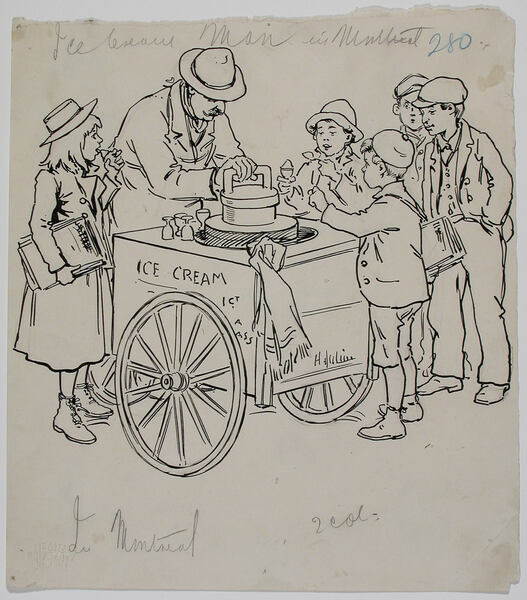
Drawing Ice Cream Man in Montreal by Artist Henri Julien (1885-1908) Object Number M2559 https://collections.musee-mccord-stewart.ca/en/objects/11162/vendeur-de-creme-glacee-a-montreal?ctx=5b8fa4961410d5dc56ea05fba53e741f513bd58b&idx=2

Bleury Street, 1921: A bustling Montreal street with advertisements for ice cream—suggesting its popularity during hot months. Ihttps://www.thevintagenews.com/2016/02/20/amazing-vintage-photographs-of-montreal-from-between-the-1910s-and-1920s-2/
Refrigeration was generated through blocks of ice, delivered throughout the city, which could also serve to alleviate the effects of the heat. If one ventured to the west end of the island in Cartierville, families could take advantage of both the amusement rides and shade in Belmont Park.

Belmont Park, which opened in 1923 in Cartierville, offered amusement rides and shaded areas, attracting families during the summer months. BANQ - Fonds La Presse https://m1.quebecormedia.com/emp/emp/06M_P833S3D0733_0004_14050ce9c-1a68-4166-95cc-d9ba656def35_ORIGINAL.jpg?impolicy=crop-resize&x=0&y=0&w=1500&h=1080&width=925
The other respite for the weather was to have a better understanding of the relationship of this seemly overwhelming heat wave in the actual context of scientific facts supplied by Kelly to the Gazette reporter. For example, the feeling that this was the hottest July ever had to be measured against facts gathered from the records of the Observatory.
From Kelly the reported learned that the mean temperature for the current July was only one degree cooler than July of 1925. The hottest day during the month of July 1926 (87.2 degrees Fahrenheit) was easily surpassed in 1921, and 1925 with the highest temperature ever recorded for July being 95.8 degrees Fahrenheit in 1916. Although the temperature remained high for 5 days in the week of July 13 and perceived as a heat wave by Montrealers this temperature level was still less than in other years. In short not the hottest July ever!
By consultation of the rich data held in the handwritten ledgers of the Observatory, Kelly revealed that the 90-degree Fahrenheit plateau during the month of July was reached in twenty-five of the last 50 years. In relation to previous weather events this July also had almost the same amount of sunshine as in previous years. The rainfall, however, was one inch lower than the norm with the heavy rains from July 8 through 10th of 2.25 inches, which made up 82% of the monthly precipitation and the wind velocity also was not as high as in previous years.
The value of these records in 1926 to help understand climate change has not diminished over time and once the DRAW project is completed scientists will have access to this data in a database form to create the missing historical data sets from prior to 1950. When Kelly spoke of the highest temperature in July over a fifty-year period, he was referring to the data created by the Observatory and captured in their handwritten weather registers since its founding in 1874. He also supplied the key weather-related elements of the headline to the prediction of the Observatory of probably 90-degree Fahrenheit weather in August based on his analysis of the past statistics.
The Observatory played a key role in supplying current weather conditions and predictions for the Montreal community and as part of the Canadian Meteorological Service for all of Canada.
Sources
July 31, 1926 (Page 5 of 20). Torrid Weather (1926, Jul 31). The Gazette (1867-2010) https://www.proquest.com/docview/2158525159?sourcetype=Newspapers
McGill Observatory Weather Expert testifies in 1924 Delorme Murder Trial
The Montreal murder trials of Father Adélard Delorme presented a scandalous and controversial legal case. The first 1924 trial held early in the year was the third of four trials concerning the murder of Raoul Delorme, a 24-year-old commerce student, and the youngest son of a wealthy Montreal family. Raoul was found dead of multiple gunshot wounds in January of 1922 in the Snowden area of Montreal. The person charged in each of these trials was a Roman Catholic priest and the victim’s half-brother, Father Adélard Delorme. In this third trial, the jury could not arrive at a verdict but in the fourth trial in October 1924 Father Delorme was acquitted. Subsequently Delorme inherited his brother’s estate, including a large insurance policy that had been taken just before his brother’s demise.

On January 7, 1922, the lifeless body of Raoul Delorme was found in a vacant lot in Montreal’s Snowdon neighborhood. Aged 24, the victim had been shot six times in the neck and head, at least once at point-blank range. The Delorme Case: A Century-Old Legal Scandal https://educaloi.qc.ca/en/believe-it-or-not/the-delorme-case-a-century-old-legal-scandal/
The themes of the power of the church, ethnic and linguistic tensions within Quebec society were hallmarks of the literature concerning this event. The innovations in the presentation of circumstantial evidence included the use of ballistic forensics and a model of the crime scene. Due to public interest in the case, the court visitors felt they could not abandon their seats during the two-hour lunch break and consumed their meal in the courtroom to keep their attendance place safe.
In the major work on this case, by J. Monet, The Cassock and the Crown : Canada's Most Controversial Murder Trial, published a summary of the Observatory report given in court as “Someone from the McGill Observatory testified that a mixture of frozen rain and snow covered the roads on 5 January 1922 and froze hard on the day of the sixth as the temperature dropped by about 30° Fahrenheit” (Monet, p.106).
Headlines of the trial from the Gazette on the third trial provided much more information including identifying the Observatory person providing evidence as Professor Albert J. Kelly the Director of the McGill Observatory and providing both his testimony and cross examination by Alban Germain, K.C., senior counsel for the defense.
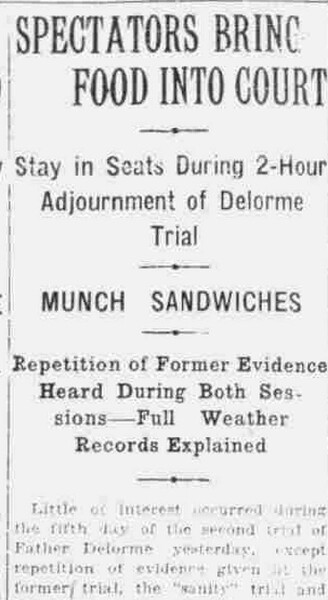
March 1, 1924 (Page 4 of 24). McGill Meteorologist Testifies in Court (1924, Mar 01). The Gazette (1867-2010) https://proxy.library.mcgill.ca/login?url=https://www.proquest.com/historical- newspapers/march-1-1924-page-4-24/docview/2158532747/se-2
Kelly’s weather information was tied by the prosecution to the state of the roads in Montreal and the transportation of the body by car. In the courtroom Kelly read out the official weather reports including temperature and wind conditions for the days in question. Then Germain, the defense lawyer, who systematically challenged all the forensic evidence supplied in the case asked Kelly a series of questions concerning the Observatory’s operations.

McGill Observatory, 1962. McGill University Archives. PU010567
When asked by Germain if the meteorological instruments were constantly observed, Kelly replied “certainly not” and recounted that the observations were made four times at regular intervals during the day and night. Germain also asked if it rain or snow fell on nearby Maisonneuve Street could this be missed by the observatory. Kelly conceded the possibility but that the precipitation would have had to been slight.
In response to the question posed by Germain on the reliability of the instruments gathering the data, Kelly replied "There is no reason why they should (fail to supply the data) unless they are broken." He also revealed that there was also a second thermometer utilized for comparative backup purposes.
The witness Albert J. Kelly nicknamed “McGill’s Weatherman,” was born May 15th, 1888, in Edmonton, Alberta. He graduated from McGill University with a B.Sc in Civil Engineering in 1911. He then went on to join the Observatory staff the next year as assistant to Professor C.H. McLeod, and as well as a professor in the Department of Surveying and Geodesy. After serving as an infantry officer in Princess Patricia’s Canadian Light Infantry during World War I he then returned to McGill becoming the Director of the Observatory in 1922.
This glimpse into the record keeping practices of the Observatory provides insight on how the records were kept and the use of these same records goes far beyond helping to predict the weather to providing a legal evidential opinion in court cases.
These same records were so carefully kept according to meteorological best practices for one hundred years but with time became buried in handwritten ledgers in archives. Now, due to crowdsourcing by volunteers at the Data Rescue Archives and Weather project website, these records are being transformed into machine readable database form.
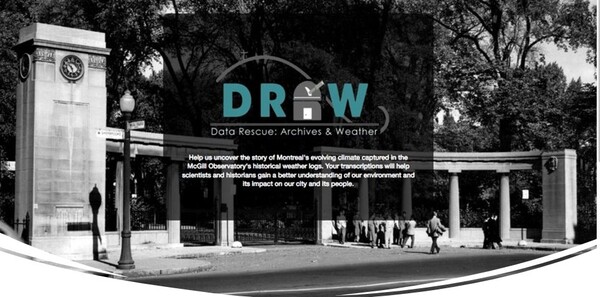
DRAW (Data Rescue Archives and Weather web landing page). Screenshot of DRAW website taken June 1, 2024 by Gordon Burr
The legacy created by all the students and professors of McGill who worked at the Observatory can now be used to enable deeper, more nuanced research into climate change.

Data Transcription bar process with a tool that hovers/moves over page with four categories of original column headings. The data is then rescued to database fields in the bar. Screenshot of DRAW website taken June 1, 2024 by Gordon Burr
Sources
March 1, 1924 (Page 4 of 24). McGill Meteorologist Testifies in Court (1924, Mar 01). The Gazette (1867-2010) https://proxy.library.mcgill.ca/login?url=https://www.proquest.com/historical- newspapers/march-1-1924-page-4-24/docview/2158532747/se-2
Monet, J., 1996. The Cassock and the Crown : Canada's Most Controversial Murder Trial, McGill-Queen's University Press. Canada. Retrieved from https://coilink.org/20.500.12592/jqq6hk on 20 Oct 2025. COI: 20.500.12592/jqq6hk.
The Delorme Case: A Century-Old Legal Scandal https://educaloi.qc.ca/en/believe-it-or-not/the-delorme-case-a-century-old-legal-scandal/
1912 July Heat Wave in Montreal
The heat wave hitting Montreal in July 1912 for the first 11 days of the month was both unprecedented and dangerous for the city's population. The headlines from the Gazette spoke of tragedies engendered by the weather including Four Fatalities from Great Heat. Yesterday Produced Greatest Casualty List During Present Hot Wave. Six Serious Prostrations and Score of Minor Cases. Many Horses Were Overcome on Streets.
The six severe cases were described in detail and portrayed men and women overcome by heat at work or simply walking along the street and their subsequent transfer to various hospitals in Montreal. Once in the hospital they would have been placed in open wards with many other patients.
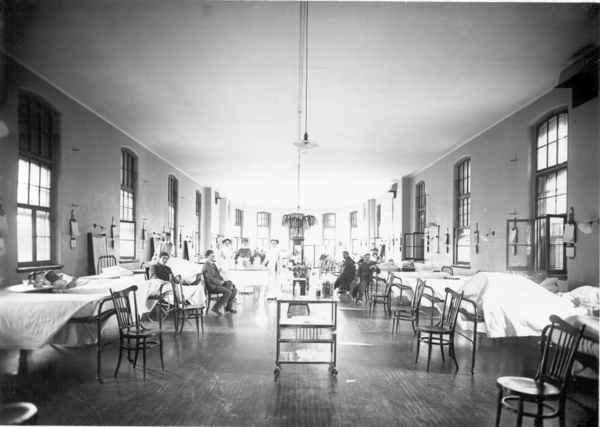
Patients and nurses in a hospital ward.1910ca.Public Domain.PR026168.
More numerous minor cases were handled in the outpatient facilities of the hospitals. No doubt their transfer to the hospitals was done via a horse drawn ambulance.
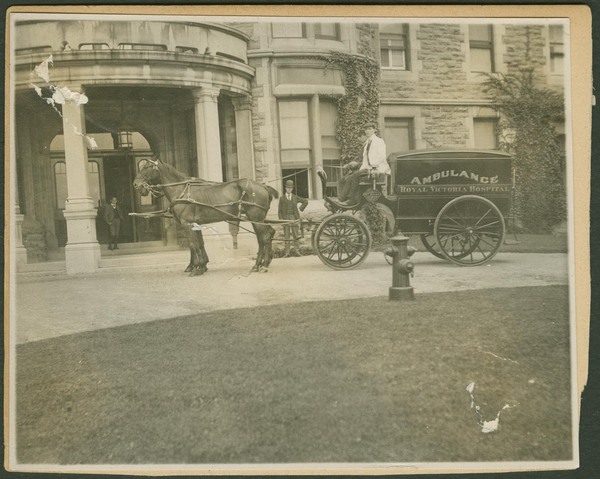
Royal Victoria Hospital. Ambulance. 1903.Public Domain.PU023644.
The crucial role of horses in the transport of people and goods in Montreal was also threatened by the heat wave as scores of horses succumbed to heatstroke both on the wharves and in the city streets. Their drivers tried to revive their fallen animals by using cakes of ice applied to the horses’ head between their ears. The ambulance service of the S.P.C.A. was fully occupied in aiding in the treatment of these causalities. The S.P.C.A had been established in Montreal in 1869, and its early years were devoted to procuring humane treatment for work horses including providing this ambulance service.

BANQ Scènes de rues à Montréal.[Vers 1900-1930].6 éléments. Collection Nelson Cazeils. de l'angle des rues Saint-Laurent et Craig.
At the turn of the 20th century the safety measures for heat waves were relatively simple including seeking cooler shaded areas to rest, drinking water and using ice and cool water to mitigate the effects of the heat. In Montreal the heat in the city streets usually 5 degrees Fahrenheit hotter than anywhere else had been alleviated since 1870 by wagons spraying water onto the streets.
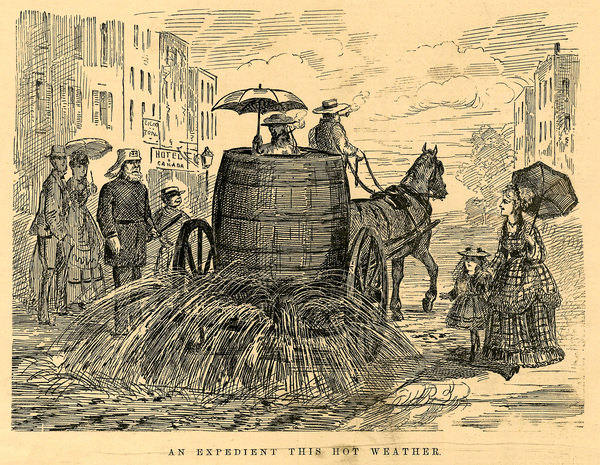
An Expedient in this Hot Weather. Artist Anonymous. Publisher Canadian Illustrated News.Date1870/07/16. Object NumberM993X.5.855. Public Domain. McCord Museum.
Unfortunately, in this heat wave with daily highs of plus 90 degrees Fahrenheit, this sprinkling had to be curtailed due to a lack of available water and this caused even more dust to accumulate when added to the lack of wind and high humidity made the situation worse for all the citizens of Montreal.
Without the high-tech solutions we have at our disposal in 2025 to combat heat waves including air conditioning and instant social media communication for alerts. the Gazette reporters looked to the best sources they could find concerning the weather. They used the temperature and barometer data obtained from the McGill Weather Observatory to provide on July 11th the hour-by-hour account of the weather as the temperature fell from the 90 plus Fahrenheit range to demonstrate that the worst of the heat wave had passed.
The data also buttressed predictions from the Canadian Meteorological Service (the McGill Observatory was a key station in the network headquartered in Toronto) for “clear and cooler weather, with moderate northwest winds in place of the scorching southwest breezes which have prevailed for the past ten days.” All Montrealers could celebrate the advent of this cooler weather! The Observatory’s key role as a lynchpin of valuable current scientific data as once again demonstrated.
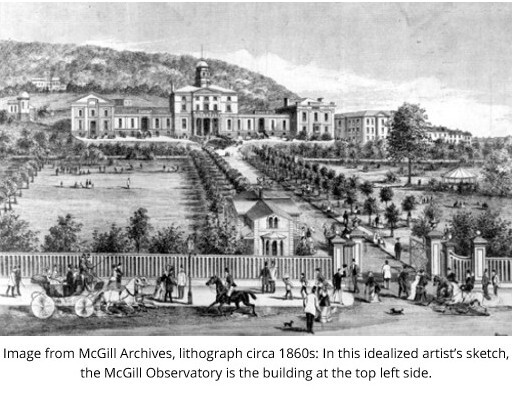
As appeared in 2009 Blog by Ingrid Birker.https://www.mcgill.ca/meteo/files/meteo/the_nations_timekeeper_mcgill_and_the_dominion_observatory-_mcleod.pdf
Sources
July 11, 1912 (Page 4 of 16). Four Fatalities from Great Heat (1912, Jul 11). The Gazette (1867- 2010) https://proxy.library.mcgill.ca/login?url=https://www.proquest.com/historical- newspapers/july-11-1912-page-4-16/docview/2149568120/se-2
An Expedient in this Hot Weather. Artist Anonymous. Publisher Canadian Illustrated News.Date1870/07/16. Object NumberM993X.5.855. Public Domain. McCord Museum. https://collections.musee-mccord-stewart.ca/en/objects/87636/utile-par-temps-chaud?ctx=84ba45de3790463f08f28300f047c975422bff23&idx=7
2025 City of Montreal advice https://montreal.ca/en/articles/tips-to-follow-during-heat-wave-5120
BANQ Scènes de rues à Montréal.[Vers 1900-1930].6 éléments. Collection Nelson Cazeils. Les images versées au dossier traitent de la gare-hôtel et du square Viger; de l'angle des rues Saint-Laurent et Craig [...]
Ingrid Birker Blog 2009 https://www.mcgill.ca/meteo/files/meteo/the_nations_timekeeper_mcgill_and_the_dominion_observatory-_mcleod.pdf
https://www.spca.com/en/the-spca-celebrates-144-years-of-proudly-serving-the-animals-of-quebec/
The Weather and Why - Weather Forecasting in 1908
This weather forecasting talk was given at McGill University’s Physics Building in December of 1908, as reported on in the Montreal Gazette, by Dr. Robert F. Stupart, the Director of the Toronto Observatory and Superintendent of the Dominion Meteorological Service, who revealed to his audience how weather prognostications were created and how it had become almost an exact science.
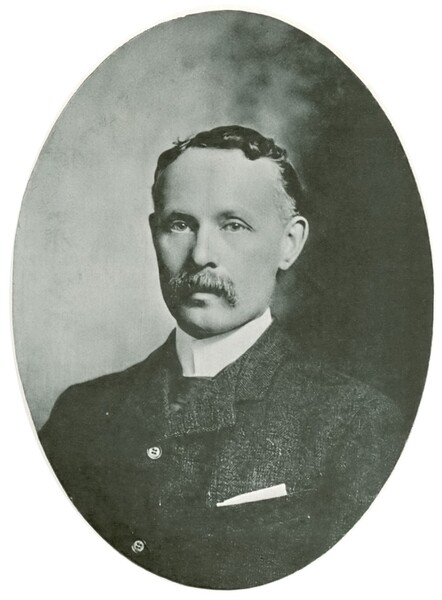
Robert Frederick Stupart, Director of the Toronto Observatory and Superintendent of the Dominion Meteorological Service, F.R.A.S.C., and president 1902-03.This photo was published in the RASC 1904 Selected Papers and Proceedings.
Although a clear scientific message was provided the reporter observed that the goal was to disseminate scientific knowledge about why weather forecasting was important and the role of the network of observatories across Canada and beyond.
Technology was a key element in the process of prognostication, and the prediction of the weather was possible because of past innovations such as the barometer and then current ones including using kites to launch instruments into higher levels of the atmosphere to obtain useful data.
Stupart was mindful of how to present a message understand by the McGill students and academics as well as the lay audience spoke about developments in theory and technical advancements but left no doubt that with the aid of a barometer, telegraph communication and the weather networks the weather could be predicted in a timely fashion in local communities.
The means of disseminating this outreach message was also a key element in the lecture. The talk supplied both an educational and entertainment value with the support of the then cutting-edge technology of stereopticon slides shown in a magic lantern projection of photographic images for everyone in the audience.
“In Spite of all the difficulties, however, Dr. Stupart modestly admitted that the observatory forecasts can be right eighty-five times 'out of a hundred". In effect anyone could tell by reading the morning paper if they should require a fur overcoat or an umbrella. (The Gazette December 9, 1908, page 8 of 12)
The attendance for this event was large thanks in no small measure to the weather forecast supplied in the Gazette as "Mostly fair and cold with a few light snowfalls" and quite unlike the winter storm shown below.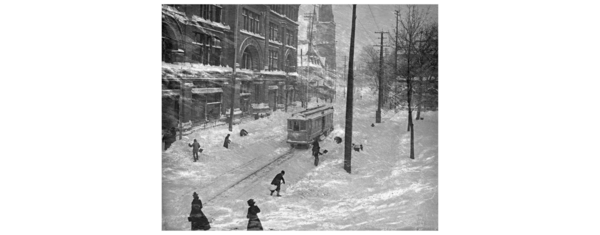
Stormy day, St. Catherine Street, Montreal, QC, 1901 Photographer William Haggerty, Notman and Son Studio, Public Domain.
At the end of the address the large audience showed their appreciation with loud applause and the speaker was thanked by the Director of the McGill Observatory, Clement H. “Bunty” McLeod who served in this post from 1873 to 1917.
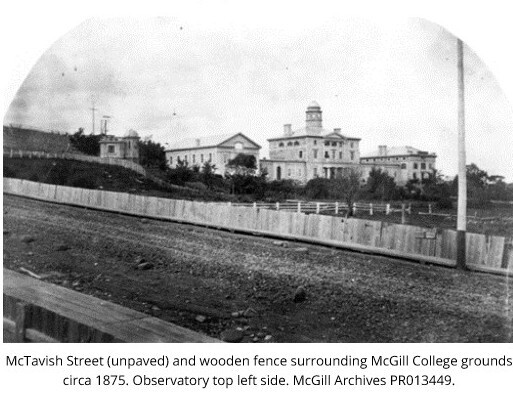
As appeared in 2009 Blog by Ingrid Birker.https://www.mcgill.ca/meteo/files/meteo/the_nations_timekeeper_mcgill_and_the_dominion_observatory-_mcleod.pdf
The McGill Observatory had become part of a Canadian network of metrological observers spread across Canada in 1874 and telegraphed data to the Toronto Observatory every three hours. This data was then compiled with the results of other stations to enable nation wide weather observations. This was particularly important in the case of dangerous large storms especially those generated in the Atlantic. This compilation of figures was also aided by data supplied by weather stations in the Bahamas.
McLeod had been a part of the first graduating class in engineering in 1873 and worked in the Observatory as a student replacing Charles Smallwood as Director when Smallwood died suddenly in1873. A civil engineer by training, he engaged with Prof. H.T. Barnes of the McGill Physics Department on temperature research. He utilized the seven-foot telescope of the Observatory to do astronomical measurements and in 1882 formed part of an international project to track the transit of Venus.
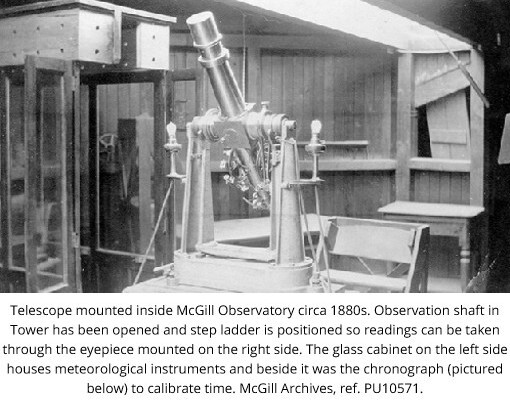
As appeared in 2009 Blog by Ingrid Birker.https://www.mcgill.ca/meteo/files/meteo/the_nations_timekeeper_mcgill_and_the_dominion_observatory-_mcleod.pdf.
His chief claim to fame was his calculation of the exact longitude of the McGill Observatory and thereby establishing the standard time for railway schedules across Canada earning the moniker “The Nation’s Timekeeper”.

As appeared in 2009 Blog by Ingrid Birker.https://www.mcgill.ca/meteo/files/meteo/the_nations_timekeeper_mcgill_and_the_dominion_observatory-_mcleod.pdf.
Bibliography
December 9, 1908 (page 8 of 12). (1908, Dec 09). The Gazette (1867-2014) Retrieved from https://proxy.library.mcgill.ca/login?url=https://www.proquest.com/newspapers/december-9-1908-page-8-12/docview/2149544784/se-2
https://en.wikipedia.org/wiki/Robert_Frederic_Stupart
https://www.rasc.ca/robert-stupart
https://articles.adsabs.harvard.edu/pdf/1941JRASC..35..137C
https://azure-archivalcollections.library.mcgill.ca/index.php/clement-henry-mcleod-fonds
Ingrid Birker, Blog 2009, https://www.mcgill.ca/meteo/files/meteo/the_nations_timekeeper_mcgill_and_the_dominion_observatory-_mcleod.pdf
https://collections.musee-mccord-stewart.ca/en/objects/134571/journee-de-tempete-rue-saintecatherine-montreal-qc-1901?ctx=135bee1a7fc9e906a8c415ecfd91f807d5ebfedc&idx=22
H.T. Barnes - 1926 Iceberg Research Expedition to Newfoundland: A Resounding Success (Part 2)
All three thermite tests produced positive results leading to the breaking up of the icebergs in Newfoundland.
The first iceberg selected was 500 feet long and as wide and 75 feet high. When the 100-pound charge of thermite occurred, ice was expelled from the iceberg and the cracking sound coming from the iceberg provided the first evidence of its effectiveness.
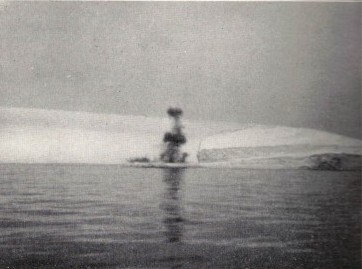
Barnes, Ice Engineering, p. 338. Fig: 62. Ice exploding under a charge of 100 lbs. of thermit.
Over the next few days, the breakup became more evident as the mass of the berg diminished due to the ongoing effect of the high temperature of the thermit explosion continuing to work through and then disrupt the internal structure of the iceberg.
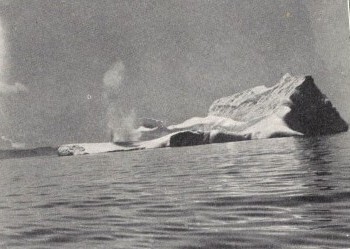
Barnes, Ice Engineering, p. 339. Fig. 64 Same Iceberg Fig. 62 two days after the use of thermit
In the case of the second iceberg selected Barnes used a 500 lb. charge on an iceberg grounded in a cove in the Twillingate Harbour. Barnes always mindful of having an audience for his spectacle chose to set off the thermit at sundown to give the local inhabitants a chance to see a burning iceberg. The charge expelled flames and ice hundreds of feet in a spectacular fashion which Barnes observed in poetic more than scientific terms as “a wonderful sight when the mighty charge fired and roared lighting up iceberg and the surrounding hills like Vesuvius in eruption”. (Barnes, Physical Property of Icebergs, p. 164).
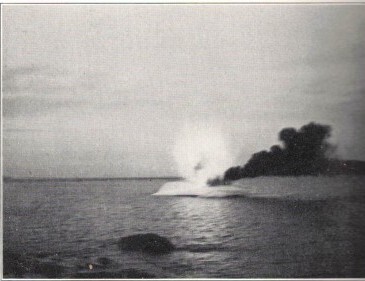
Barnes, Ice Engineering, p. 340. Fig. 66. Iceberg exploding and burning under the fierce heat of a thermit charge
The results of the explosion can clearly be seen the next morning when the iceberg had been split into two sections.
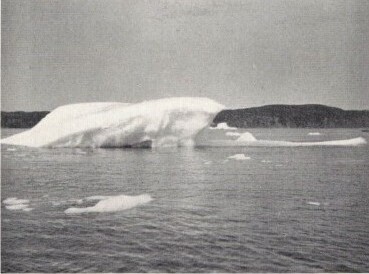
Barnes, Ice Engineering, p. 341. Fig.67. Same iceberg as Fig. 66 the morning after the treatment.
For Barnes, his experience with the icebergs was not just a scientific one but an emotional almost mystical one. For example, he described the top of the largest of the icebergs, only viewable once one climbed to it, as a fairyland with a four-foot-deep lake ringed by blue filled with green water adorned by a mound of white ice shaped like an ice cream cone surrounded by towering cliffs of white porcelain ice. (MG1016, Unpublished Account, p.9).
Barnes quite cheerily announced the experiment a success in his article published by the Royal Society of Canada and addressed partly the chief weakness of this approach the potentially difficulty in landing individuals on unstable icebergs by suggesting a practical solution through the use of a rock drill directly from a boat to place the thermit charge 50 to 100 feet in the ice. (Barnes, Physical Property of Icebergs, p. 164 ).
He recounts having to explain to the local population of Twillingate his interest in destroying icebergs to protect their life and how they completely understood the value of his desire to control and destroy icebergs. This attitude he contrasts sharply with the criticism he had received from “eminent officials and even scientists of Europe and America” for his efforts. (MG1016, Unpublished Account, p.7).
Despite the success of Barnes’ experiments the delivery systems utilized by the Ice Patrol up into the late 20th century never found a successful way of dismantling the iceberg menace directly through destruction but instead relied more upon reporting of iceberg positions to make ships and the individuals sailing on them safe.
His 1926 triumph was announced in a banner headline of the Montreal Star in September after his return to Montréal.
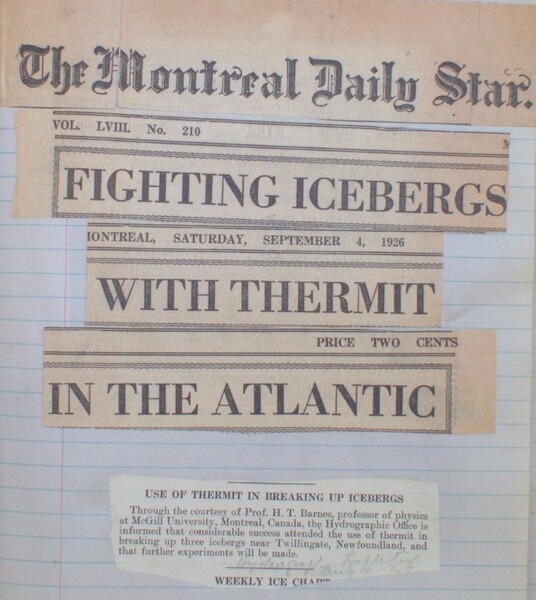
Barnes, Notebook – Seventh Iceberg Research Expedition, Newfoundland, 1926, p185. Montreal Star, Headline, Fighting Icebergs with Thermit, Sept. 4, 1926.
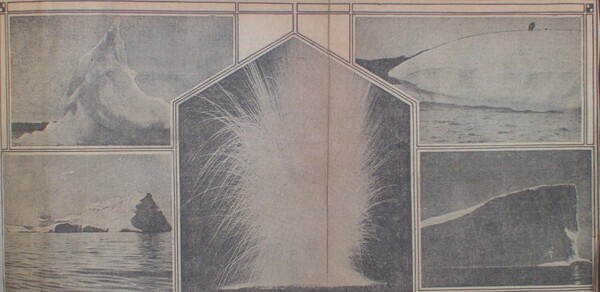
Barnes, Notebook – Seventh Iceberg Research Expedition, Newfoundland, 1926. P.187. Montreal Star, Photos of Barnes’ work in Newfoundland, 1926.
Bibliography
Howard Turner Barnes, Ice Engineering, Renouf Publishing House, Montreal, 1928
Howard Turner Barnes, “Some Physical Properties of Icebergs and a Model for their Destruction”, Royal Society of Canada, November 4, 1926
Thomas P. Ostrom, The United States Coast Guard and National Defence: A History from the First World War to the Present. McFarland & Company, Inc., Publishers, Jefferson, North Carolina and London, 2012.
Archival Sources
McGill Archives, Howard Turner Barnes fonds, MG1016, Item 668/5 Notebook on Seventh Iceberg Research Expedition Newfoundland, 1926 includes insert of 13 pp, typescript account of the trip, June 27th to July 15th, 1926, titled “Experimenting with Icebergs” by H.T. Barnes.
H.T. Barnes - 1926 Iceberg Research Expedition to Newfoundland: Setting the Stage for the Thermit Experiments (Part 1)
In 1926 H.T Barnes after successfully testing his thermit explosion idea to dislodge ice jams in the St. Lawrence River system journeyed ice again to Newfoundland to test the thermit with experiments on icebergs. Barnes on his previous research expedition in 1924 had made tests and observations about the impact of the heat of the sun in the early morning on the dry iced over iceberg causing some cracks in the structure. This led him to the hypothesis that the intense heat of thermit explosions could disrupt the internal structure of icebergs.
While he had sailed with the Ice Patrol’s United States Coast Guard ship to do his experiments in 1924 this time, he blithely noted that the funding was not from the government but from the private sector without specifying the source. (Barnes, Ice Engineering, p.335). The lack of government funding was a bit of a sore point for Barnes who complained in this unpublished account of the trip about the lack of encouragement for his research from the “skeptical and incredulous officialdom” (MG1016 Experimenting with Icebergs” by H.T. Barnes. p. 3-4). In his unpublished account of the trip, he was also a little more forthcoming, revealing the source of the private funding as the Metal and Thermit Company of New York who supplied one ton of thermit for his experiments in Newfoundland. The company had also funded some of his experiments on river ice in the past and among his companions for the 1926 expedition trip was the inventor of the explosive Hermite, C.A. Berry of Waterloo, Quebec who provided expertise in the preparation and explosion of the thermit charges.
Barnes’ team also included two family members who each provided their own special skills to aid the expedition. Barnes’ son William H. Barnes was a demonstrator (course lecturer) in McGill’s Department of Chemistry who tested the ice samples gathered to assess their chemical composition. In addition, Barnes’ brother Wilfred M. Barnes, a Montreal artist and photographer, made sketches and composed the photographs for the expedition. (MG1016, Unpublished Account, p.4).
The party left Montreal in June and journeyed by train to Nova Scotia, by steamer across to Newfoundland and then by rail and finally a motor launch to arrive at the twin islands of Twillingate. Barnes chose these islands for the stability of the climate as compared to Greenland as well as the number of icebergs (more than forty) adjacent to the Twillingate harbor. (MG1016, Unpublished Account p.6). Barnes then selected three suitable stable icebergs of varying sizes to conduct his experiments on
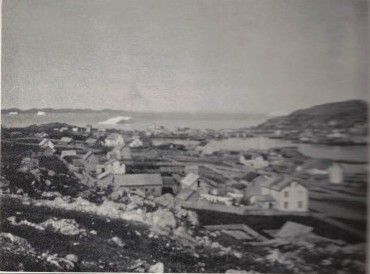
Barnes, Ice Engineering, p. 336. Fig. 60. Twillingate Harbour with icebergs in the distance
The process was labour intensive and dangerous due to the potential movement of the iceberg. Barnes had crafted beforehand safety protocols for this aspect of the expedition. The iceberg was approached via a motor launch and a dory dispatched from the launch with a small crew including Barnes himself to land on the iceberg. The launch remained nearby with staff keeping a watchful eye on the iceberg and ready to execute a safety plan including blowing the launch’s whistle to call back the dory landing crew if any instability was detected. The dory party used a ladder and climbing gear to mount the iceberg.
The danger in this type of hard ice climbing work was real, and Barnes revealed how one member of the team, C.A. Berry, slipped while scaling the cliffs on an iceberg and slid 600 feet before stopping his side into the frigid waters of the Atlantic by using his spikes to stop only two feet from the edge of the glacier. The soaking wet Berry was then rescued by the dory crew and transferred back to the motor launch. (MG1016, Unpublished Account p.6). After mounting the glacier and selecting a spot to bury the charge of thermit, encased in a metal container three, feet below the surface of the ice. The fuse was set; the party retreated to the dory, returned to the motorboat and awaited the explosion.
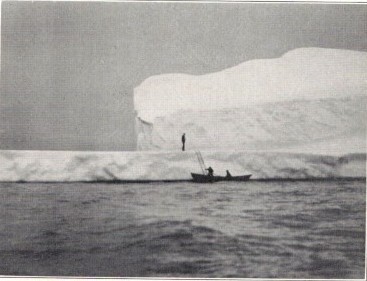
Barnes, Ice Engineering, p. 337. Fig. 61. Method of landing on an iceberg
The results of the experiments will be revealed next week in Part 2 of this expedition’s scientific work.
Bibliography
Howard Turner Barnes, Ice Engineering, Renouf Publishing House, Montreal, 1928
Howard Turner Barnes, “Some Physical Properties of Icebergs and a Model for their Destruction”, Royal Society of Canada, November 4, 1926.
Thomas P. Ostrom, The United States Coast Guard and National Defense: A History from the First World War to the Present. McFarland & Company, Inc., Publishers, Jefferson, North Carolina and London, 2012.
Archival Sources
McGill Archives, Howard Turner Barnes fonds, MG1016, Item 668/5 Notebook on Seventh Iceberg Research Expedition Newfoundland, 1926 includes insert of 13 pp. typescript account of the trip, June 27th to July 15th, 1926, titled “Experimenting with Icebergs” by H.T. Barnes.
H.T. Barnes 1924 Expedition to Newfoundland: The North Atlantic Ice Patrol and Iceberg Research Experiments
Barnes research interest in ice formations extended beyond ice in the North American river systems to include ice bergs in the Atlantic Ocean emanating from the glaciers of Greenland then could be found drifting to the shipping lanes around Newfoundland. The public interest in ice bergs and their destructive power dramatically increased worldwide with the sinking of the passenger ship the Titanic in 1912. This iceberg collision disaster event led to the creation of a multi nation International Ice Patrol in 1913 to protect shipping from ice bergs off the Grand Banks of Newfoundland. American Coast Guard cutters patrolled this area in April, May and June, the three most dangerous months for ice bergs, and communicated early warnings of danger to ships as well as mounting search and rescue operations. (Scientific American, The North Atlantic Ice Patrol, 1922, p.370-371).
Barnes in his book Ice Engineering also notes that the mandate of this patrol was also to study the icebergs and to help predict the number of icebergs based on the prevalence of Arctic ice due to changing weather conditions. (Barnes, p. 351).
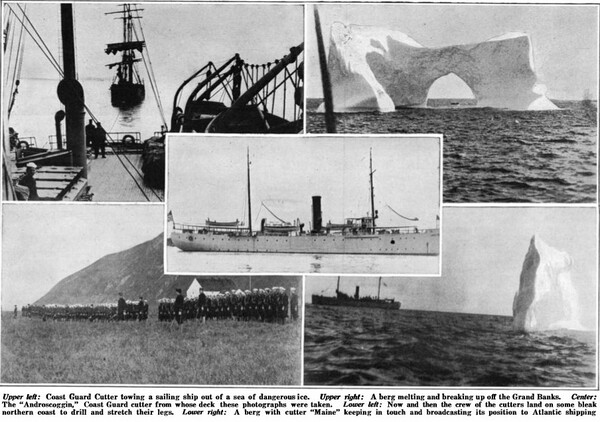
Scientific American, Photographs of the North Atlantic Ice Patrol, Vol. 126, No.6 (June 1922) p. 370.
Barnes mounted several Iceberg Research Expeditions to Newfoundland in the 1920’s and at times sailed with the U.S. Coast Guard ice patrol boats to conduct his independent scientific ice research experiments often accompanied by American researchers following their own research interests. He kept logbooks for each expedition detailing his experiments and results, often aided by photographic evidence.
In June 1924, Barnes sailed on the U.S C.G. S. Modoc, an American. Coast Guard Ship, from Halifax sharing a cabin with an American scientist Dr. Charles J. Fish, who was studying marine life specifically plankton.
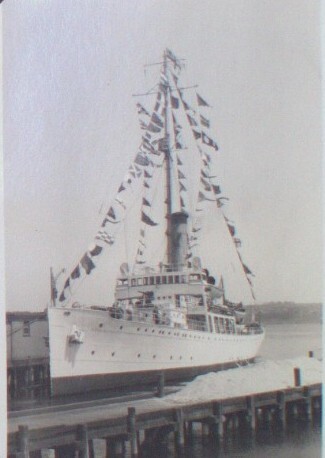
MODOC in Dock at Halifax on Debarkation Day, May 30th, 1924. McGill Archives, Howard Turner Barnes fonds, MG1016, Item 454/1a - 6th Iceberg Research Expedition, Newfoundland 1924. P.1 PA027401
Barnes was conducting Iceberg research chiefly using temperature surveys, collecting ice samples and observations of the reaction of icebergs to the weather elements as they gradually broke up in the sea with an eye to potentially speed up this process through human intervention.
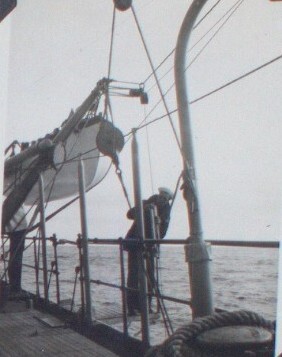
Putting down a Bigelow thermometer, June 18th. Howard Turner Barnes fonds, MG1016, Item 454/1a - 6th Iceberg Research Expedition, Newfoundland 1924. PA027401, p.69
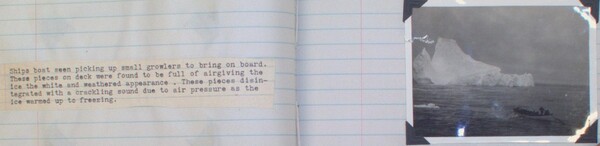
Small boat to pick up pieces of ice to study. Howard Turner Barnes fonds, MG1016, Item 454/1a - 6th Iceberg Research Expedition, Newfoundland 1924. PA027401, p.16-17
The failure of the use of dynamite to break up an iceberg by the Ice Patrol was also noted by Barnes. The damage to the iceberg structure was often temporary as the cold weather led the water to fill the holes and then re-freeze the iceberg.

Dynamite experiment with iceberg. Howard Turner Barnes fonds, MG1016, Item 454/1a - 6th Iceberg Research Expedition, Newfoundland 1924. PA027401, p.18-19
From his observations during this trip, he found that during the night the water on the surface of the iceberg caused by the sun’s heat dried up and froze during the day. In his morning observations he heard and saw at sunrise cracks in the ice bergs and surmised this was caused by the sun’s impact on the dry surface which produced a strain on the iceberg to weaken its mass. These loud cracks had led to the name for smaller fragments of ice bergs being named as growlers because the sound of these cracks sounded like an animal growling. The observations taken by Barnes below during the trip provide a fascinating insight into how he came to this conclusion
Observations on iceberg. Howard Turner Barnes fonds, MG1016, Item 454/1a - 6th Iceberg Research Expedition, Newfoundland 1924. PA027401, p.50
Observations on iceberg. Howard Turner Barnes fonds, MG1016, Item 454/1a - 6th Iceberg Research Expedition, Newfoundland 1924. PA027401, p.51
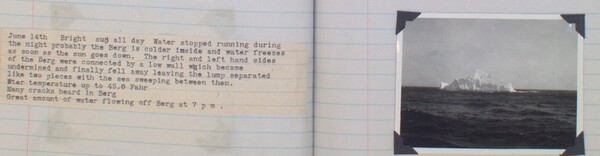
Observations on iceberg. Howard Turner Barnes fonds, MG1016, Item 454/1a - 6th Iceberg Research Expedition, Newfoundland 1924. PA027401, p.48-49
He later noted in his book that it was from these observations he realized the possibility of testing the use of the intense heat of thermit to disrupt the structure of the iceberg. (Barnes, p.325). While he did not test thermit on this trip, he ran successful tests on the St. Lawrence River in 1925 and then in 1926 led another expedition to Newfoundland to run thermit experiments on icebergs. (Barnes, p.173, 335).
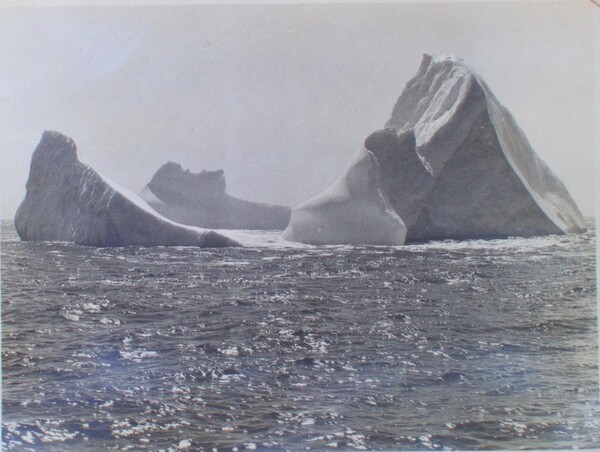
Iceberg viewed from MODOC, n.d. McGill Archives. Howard Turner Barnes fonds, MG1016, Item 454/1a - 6th Iceberg Research Expedition, Newfoundland 1924. PA027401, p.89-90
Bibliography
Howard Turner Barnes, Ice Engineering, Renouf Publishing House, Montreal, 1928
Scientific American, Staff authors, The North Atlantic Ice Patrol, Vol. 126 ,No.6 (June 1922) p. 370-371, 436 - Stable URL: 436 Published by: Scientific American, a division of Nature America, Inc. https://www.jstor.org/stable/10.2307/24996285
Archival Sources
McGill Archives, Howard Turner Barnes fonds, MG1016, Item 454/1a - 6th Iceberg Research Expedition, Newfoundland 1924. PA027401
McGill’s Howard Turner Barnes: Applied Ice Engineering in North American Waterways
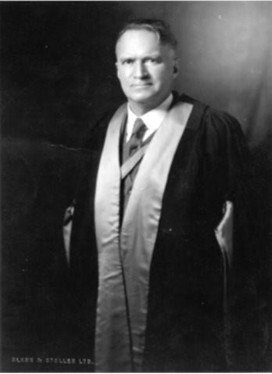
Dr. Howard Turner Barnes, Professor of Physics, 1930 ca, Bank & Stoller, Public Domain, Photo #: PR008119, McGill University Archives.
We’d like to introduce you to Dr. Howard T. Barnes, a McGill Professor of Physics from 1900 to 1933. Dr. Barnes’s claim to fame was his study of ice engineering as he called it and became particularly well-known for clearing ice from the Canadian and American waterways. Barnes was born in Massachusetts but came to Canada early in his life. After getting his Bachelor’s and D.Sc. from McGill he joined the University’s Physics department in 1900. He succeeded Ernest Rutherford as Macdonald Professor of Physics in 1908 and became the Chairman of the Department in 1919. He retired from the University in 1933, after a lucrative career researching the formation and behavior of ice. Dr. Barnes “Ice Engineering” largely consisted of finding ways to remove and manage the river ice, studying the St. Lawrence’s yearly freeze. The removal of ice jams on the river not only would serve to keep the shipping lanes open year-round but could potentially prevent floods.
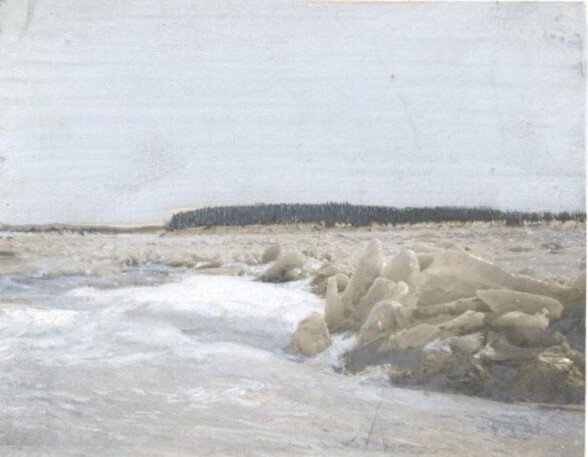
Ice on the St. Lawrence River (hand tinted), 1909, Public Domain, Photo #: PU010059, MG1016 Howard Turner Barnes Fonds, McGill University Archives.
While normally working on the St. Lawrence, where it’s more convenient to conduct his experiments, in March of 1926 the professor was asked by the mayor of Oil City, Pennsylvania to help destroy ice jams that had formed on the Allegheny River and were threatening to flood the river. Dr. Barnes dropped everything to go help, postponing lectures and rushing to the United States. When he got there the ice jam was about 25 miles long, and Oil City and Franklin PA were flooding from the dammed-up river. Dr. Barnes declared that he could clear the blockage, not asking for any pay (but suggesting a donation to his scientific expedition to Greenland, that June would not be unappreciated).
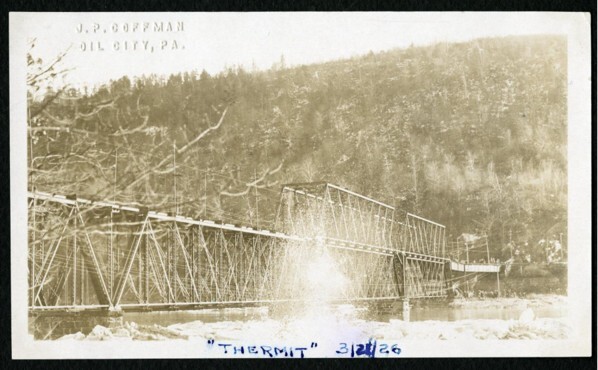
“Thermit” 3/21/26, Photograph of Thermit Explosion in Oil City PA, March 21 1926, Public Domain, Object #: PA027406-pg115, MG1016 Howard Turner Barnes Fonds, McGill University Archives.
Thermit was used to destroy the ice jams, as the professor had found in his research that it was the most effective material for breaking up ice blockages. Thermit, or thermite as it’s more commonly called today is a combination of a metal and a metal oxide that when ignited creates a self-sustaining combustion that burns incredibly hot and fast. The quintessential thermit mixture in aluminum and iron oxide in an ignitable powder. Dr. Barnes used this to quite literally explode the ice on the Allegheny. He also made use of some dynamite.
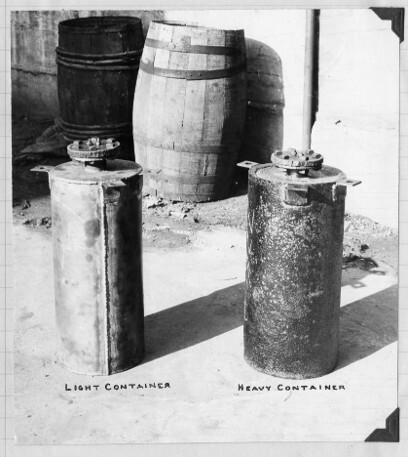
Photograph of Thermit Containers, Date Unknown, Public Domain, Object #: PA027406-pg001, MG1016 Howard Turner Barnes Fonds, McGill University Archives.
The first few attempts to destroy the ice jam were unsuccessful, with fuses not lighting properly and the thermit charges not going off. The US newspapers were a little less complementary of Dr. Barnes’ initial attempts than the McGill Daily usually was, skeptical of his claims after the initial failures. It took several weeks of carefully planned demolition, but the good doctor eventually saw the 25 miles of ice swept away and the cities relived of what was, at one point, 15 feet of flooding. (Apparently citizens of Oil City boated in to work as if living in a North American Venice.)
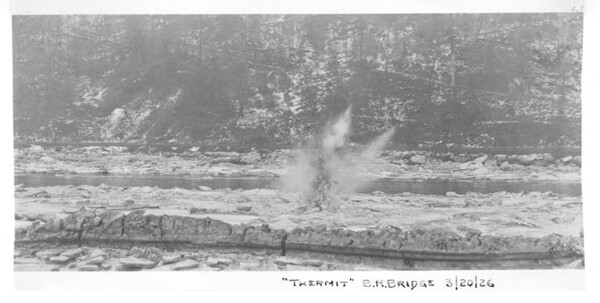
“Thermit” B.R. Bridge 3/20/26, Photograph of Thermit Explosion on the Allegheny River at Big Rock Bridge near Franklin PA, March 20 1926, Public Domain, Object #: PA027406-pg087, MG1016 Howard Turner Barnes Fonds, McGill University Archives.
Despite rushing off to save other cities from potential destruction, in one incident in December of that same year, he refused to remove ice from the St. Lawrence, where he had been researching and destroying ice jams for years. Local shipping and flour milling interests had reached out to Dr. Barnes because the shipping lanes around Montreal had become impassable. The ice breakers that were regularly used were not able to clear the way and all ships were stuck in port. The steamship companies did not ask for any government assistance but instead reached out to Dr. Barnes directly, which could be understood after his resounding success in March. Dr. Barnes replied that he was busy for the next several weeks and could not help until then. The comparison to his reaction to the Allegheny blockage may show a bit of the professor’s priorities.
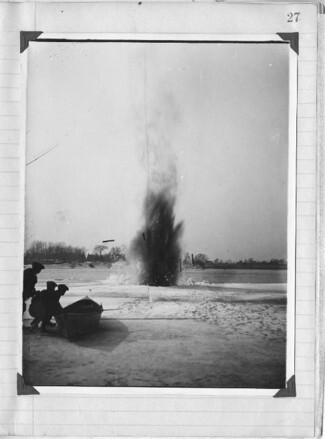
Photograph of Thermit Explosion and Researchers at Day, Date Unknown, Public Domain, Object #: PA027406-pg027, MG1016 Howard Turner Barnes Fonds, McGill University Archives.
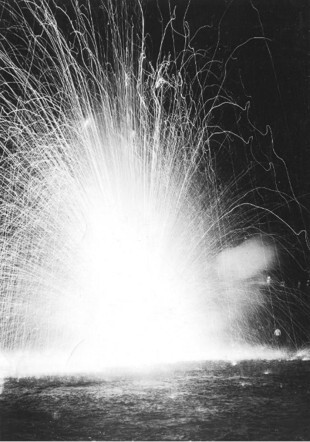
Photograph of Thermit Explosion at Night, Date Unknown, Public Domain, Object #: PA027406-pg085, MG1016 Howard Turner Barnes Fonds, McGill University Archives.
The McGill Daily shows that Dr. Barnes was in fact rather busy, announcing a great number of lectures and discussions that he gave and attended. In one lecture, in October of 1926 he refuted the claims of a famous artic explorer that the glaciers in Greenland were increasing. Having just gone to Greenland specifically to investigate the ice formations he could speak on the matter with authority. He tells the attendees that the glaciers are actually receding, which most of us today will regretfully recognize as early effects of global warming.
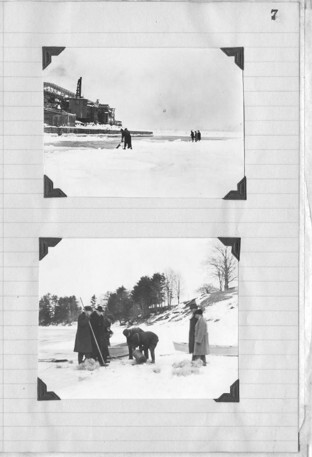
Photographs of Researchers Preparing Thermit Containers, Date Unknown, Public Domain, Object #: PA027406-pg007, MG1016 Howard Turner Barnes Fonds, McGill University Archives.
His other lectures included experiments revealing that icebergs produced slightly higher temperatures in their surrounding water, how this could be used to detect icebergs, ice formations, iceberg formation and behavior, the potential destructions of icebergs using thermit and much more. In fact, three days after the shipping companies reached out to him for help, he spoke at the McGill Physical Society meeting about his expeditions to Greenland earlier that year and in 1924, proving that Dr. Barnes did not postpone any lectures for the commercial ships stuck in the Montreal harbor.
References
“Ships in Port During Winter”, The McGill Daily Vol. 19 No.040 (1929, Nov 15) https://archive.org/details/McGillLibrary-mcgill-daily-v19-n040-november-15-1929-7791
“Dr. Barnes plans large scale ice removal work”, The McGill Daily Vol. 18 No. 078 (1929, Jan 16) https://archive.org/details/McGillLibrary-mcgill-daily-v18-n078-january-16-1929-7696
“Ice engineering subject of talk”, The McGill Daily Vol. 17 No. 008 (1927, Oct 7) https://archive.org/details/McGillLibrary-mcgill-daily-v17-n008-october-07-1927-7493
“Barnes raps danger cry of explorer”, The McGill Daily Vol. 16 No. 020 (1926, Oct 22) https://archive.org/details/McGillLibrary-mcgill-daily-v16-n020-october-22-1926-7373
“Ice field is shattered by thermit ray”, The McGill Daily Vol. 16 No. 014 (1926, Oct 15) https://archive.org/details/McGillLibrary-mcgill-daily-v16-n014-october-15-1926-7367
"Maritime Matters”, The Montreal Gazette (1912, May 15) https://proxy.library.mcgill.ca/login?url=https://www.proquest.com/hnpmontrealgazette/newspapers/may-15-1912-page-16-20/docview/2149541267/sem-2?accountid=12339
“Dr. Barnes gives interesting lecture”, The McGill Daily Vol. 02 No. 026 (1912, Oct 30) https://archive.org/details/McGillLibrary-McGill-Daily-v02-n026-october-30-1912-5584
“Professor Louis King will lecture on recent invention for detection of icebergs – associate of Dr. Barnes”, The McGill Daily Vol. 03 No. 034 (1913, Nov 10) https://archive.org/details/McGillLibrary-mcgill-daily-v03-n034-november-10-1913-5717
“Dr. Barnes speaks on ice detection”, The McGill Daily Vol. 14. No. 099 (1925, Feb 17) https://archive.org/details/McGillLibrary-mcgill-daily-v14-n099-february-17-1925-7182
“Barnes to Address Physical Society”, The McGill Daily Vol. 16 No. 059: December 8, 1926 https://archive.org/details/McGillLibrary-mcgill-daily-v16-n059-december-08-1926-7411/mode/2up?q=%22iceberg%22+%22barnes%22
“Macdonald Physics Laboratory Lectures For Boys and Girls”, The McGill Daily Vol. 24 No. 050: December 10, 1934 https://archive.org/details/McGillLibrary-mcgill-daily-v24-n050-december-10-1934-8400/page/n1/mode/2up?q=%22iceberg%22+%22barnes%22
“Destruction of Icebergs is Possible”, McGill Daily Vol. 16 No. 062: December 11, 1926 https://archive.org/details/McGillLibrary-mcgill-daily-v16-n062-december-11-1926-7414/mode/2up?q=%22iceberg%22+%22barnes%22
“Lectures postponed”, The Montreal Gazette (1926, March 2) https://proxy.library.mcgill.ca/login?url=https://www.proquest.com/hnpmontrealgazette/newspapers/march-2-1926-page-5-22/docview/2158510414/sem-2?accountid=12339
“All ships halted to three rivers”, The Montreal Gazette (1926, Dec 8) https://proxy.library.mcgill.ca/login?url=https://www.proquest.com/hnpmontrealgazette/newspapers/december-8-1926-page-19-24/docview/2158543652/sem-2?accountid=12339
McGill University Archives, Howard Turner Barnes Fonds, MG1016, https://archivalcollections.library.mcgill.ca/index.php/howard-turner-barnes-fonds
Howard Turner Barnes, Ice Engineer Extraordinaire Part 2
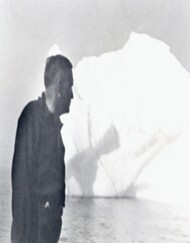
Howard Turner Barnes looking at an iceberg, date unknown, copyright unknown, MUA PU002709
The academic emphasis on H.T. Barnes' research publications in all his biographical sketches overlooks a key element reflected by his own records keeping practices as represented in his archival fonds. He meticulously gathered every newspaper article on his research including hiring a clippings service to keep track of these activities to document his research in the public domain. (Foster p. 31). This was a key example of outreach in the areas of advocacy and promotion (SAA – Definitions – Outreach) done by a scientist far away from the hallowed halls of university life. He was researching and discovering practical solutions to real disruptive weather events caused by ice blockage to maritime traffic and flooding of local communities.
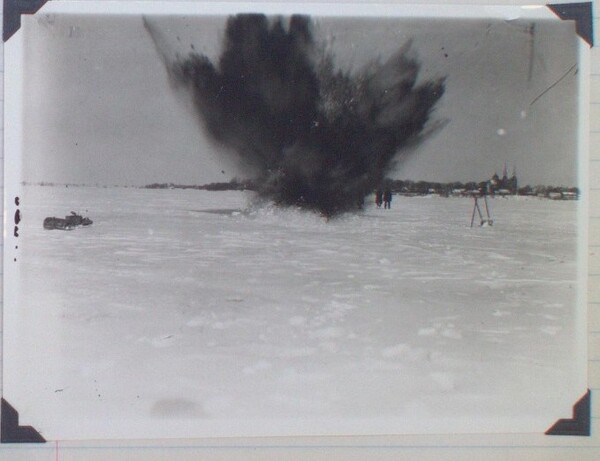
Howard Turner Barnes MG 1016 MUA Journal 668-2a PA027406 Thermit Images Note-book containing photographs, entitled: "Thermit -Ice Reaction”. 100 lbs. Thermit daytime St. Lawrence River explosion, March 1929, p.167.
Barnes was actively engaged in outreach with the public to both educate and gain support for solutions to real world problems for ice engineering.
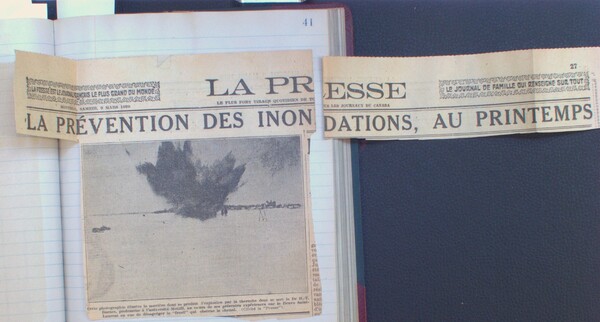
Howard Turner Barnes MG 1016 MUA Journal 668-9 Press Clippings St. Lawrence River, p. 41 Headline La Presse, March 1929.
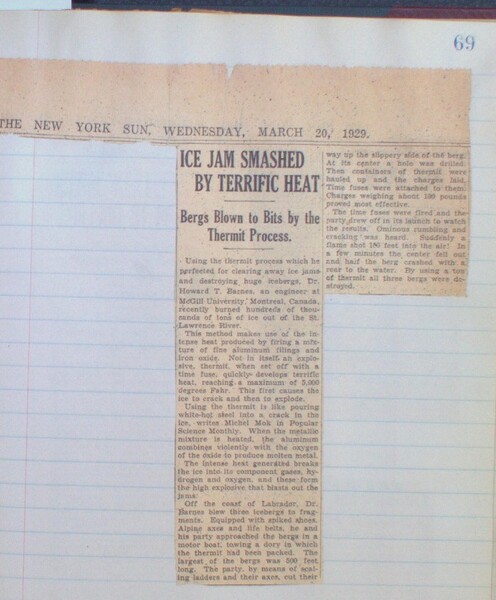
Howard Turner Barnes MG 1016 MUA Journal 668-9 Press Clippings St. Lawrence River, p. 69, New York Sun, March 20, 1929.
This documentation forms a large part of his own records, and this is something that has been ignored. He was bringing practical applications to bear on disruptive weather phenomena that had societal consequences for the public and promised increased safety and economic benefits for society.
Howard Turner Barnes MG 1016 MUA Journal 668-9 Press Clippings St. Lawrence River, p. 155, La Patrie, April 1929.
He was moving scientific experimentation closer to the public as an advocate for solutions to real world problems evinced due to disruptive weather’s impact on society. These solutions were newsworthy especially given the concern for the dangers of ice due to local disruptive weather events on lakes and rivers in North America and worldwide boost in public interest in icebergs after the collision with an iceberg lead to the sinking of the Titanic in 1912.
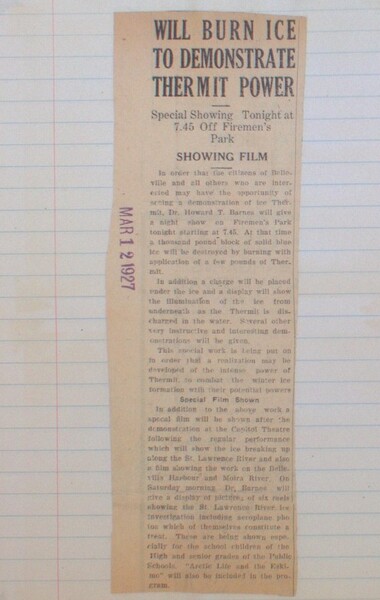
Howard Turner Barnes MG 1016 MUA Journal 668-2a PA027406 Thermit Images Note-book containing photographs, entitled: "Thermit -Ice Reaction”. Thermit Ice Demonstration in Belleville, Ontario, p.120, March 1927. Newspaper Clipping
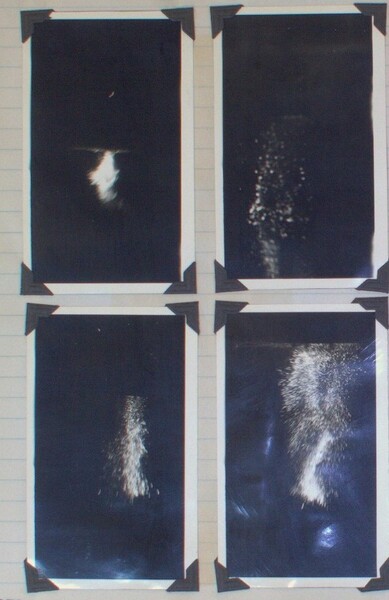
Howard Turner Barnes MG 1016 MUA Journal 668-2a PA027406 Thermit Images Note-book containing photographs, entitled: "Thermit -Ice Reaction”. Thermit Ice Demonstration in Belleville, Ontario, p.121, March 1927, Four photographs.
More to come on this scientific researcher including his voyages to Newfoundland in the 1920’s to study icebergs. It’s all about the weather and evidence-based solutions to mitigate the worst effects of the climate. These studies by Barnes took place in the last century but these types of solutions resonate even more loudly today.
Bibliography
Howard Turner Barnes, Ice Engineering, Renouf Publishing House, Montreal, 1928
John Stuart Foster “Howard Turner Barnes, 1873-1950” obituary in The Royal Society, Biographical Memoirs of Fellows of the Royal Society, Vol.8, Issue 21, Nov. 1, 1952. https://doi.org/10.1098/rsbm.1952.0003 Accessed: March 22, 2023.
Yves Gingras, “Howard Turner Barnes” in Canadian Encyclopedia, https://www.thecanadianencyclopedia.ca/en/article/howard-turner-barnes Accessed June 26, 2023
Phillip Hewett, “Barnes, William Sullivan,” in Dictionary of Canadian Biography, vol. 14, University of Toronto/Université Laval, 2003–, accessed June 25, 2023, http://www.biographi.ca/en/bio/barnes_william_sullivan_14E.html Accessed: June 25, 2023
Joe Schwartz, McGill Office for Science and Society. The Thermite reaction article, 2017.https://www.mcgill.ca/oss/article/thermite-reaction Accessed May 3, 2023.
Society of American Archivists. Dictionary of Archives Terminology. Outreach. https://dictionary.archivists.org/entry/outreach.html Accessed May 3, 2023.
A. Norman Shaw, “Howard Turner Barnes”, obituary in Royal Society of Canada, 1951, Proceedings and Transactions Third Series, Vol. XLV, Meeting of June 1951, p.77-81.
Archival Sources
McGill University Archives, Howard Turner Barnes fonds, MG1016, Item 454/678 - “The Science of Ice Engineering” by Howard T. Barnes reprinted from the Scientific Monthly, October 1929, Vol. XXIX, p.289-287.
McGill University Archives, Howard Turner Barnes fonds, MG1016, Item 454/608 Report done in 1929 as an Assisted Research Report to the National Research Council by Barnes on the Adhesion of Ice Research, p. 1-8.
Howard Turner Barnes, Ice Engineer Extraordinaire Part 1
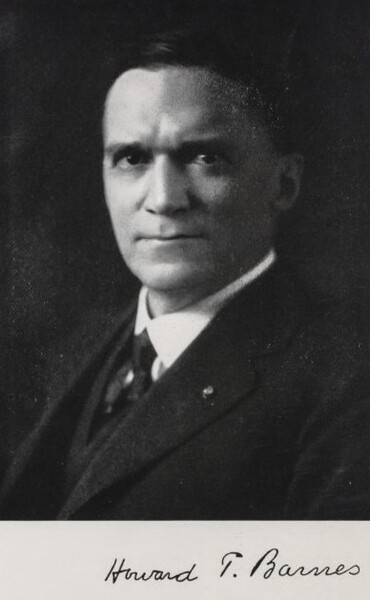
Photo from John Stuart Foster “Howard Turner Barnes, 1873-1950” obituary in The Royal Society, Biographical Memoirs of Fellows of the Royal Society, Vol.8, Issue 21, Nov. 1, 1952.
Born in New England, Barnes came to Canada with his family when his father, Willian Henry Barnes, moved to Montreal to become the minister of the Unitarian Church in 1869. (Hewett, DCB). Educated at McGill with a B.A.Sc. in 1893 and M.A.Sc. in 1896, he joined the academic stream of the University as a demonstrator and rose steadily through the ranks to become a Macdonald Professor of Physics, Director of the Laboratory in 1907 and Emeritus Professor in 1933. He developed expertise in the precision measurement of temperature through his collaboration with Prof. Hugh Calendar in calorimetry and made the study of the physical properties of ice and the practical applications of these studies in the field of ice engineering the key focal points of his career. He published over one hundred articles and two books. (Foster, p.25, Gingras, p.1 and A. Norman Shaw, p.77). According to two of his biographers (Foster p. 41 and Shaw p. 81) he also had disabilities including severe lameness and bouts of depression.
He studied extensively the St. Lawrence River for 35 years and focused on the importance of frazil ice in the blockage of the river during the winter season. His solution to opening the river and avoiding ice jams that caused flooding in the spring and interfered with shipping traffic included dislodging or breaking up the ice through a chemical reaction caused by the application of the thermit process.
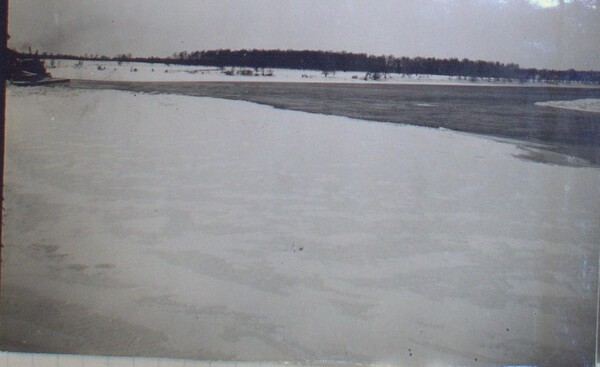
McGill University Archives, Howard Turner Barnes MG 1016, Journal 668-2a PA027406 Thermit Images Note-book containing photographs, entitled: "Thermit -Ice Reaction”. Barnes first successful use of thermit to blow a river ice jam in Waddington, New York in 1925.
This chemical process was invented in 1893 and consisted of a reaction between aluminum and iron oxide. Barnes found heat-producing chemicals such as thermit was a more effective solution than other more traditional methods such as TNT, black powder and nitroglycerine. These measures were not ideal to break up major log jams because the energy is directed up into the air and the ice then freezes over quickly to fill the hole. (Barnes, Scientific Monthly, 1929, p.295)
McGill University Archives, Howard Turner Barnes MG 1016, Journal 668-2a PA027406 Thermit Images Note-book containing photographs, entitled: "Thermit -Ice Reaction”. Destruction using hermit of an ice jam for the National Transit Pump and Machine Company in Oil City, PA, 1926 Part 1
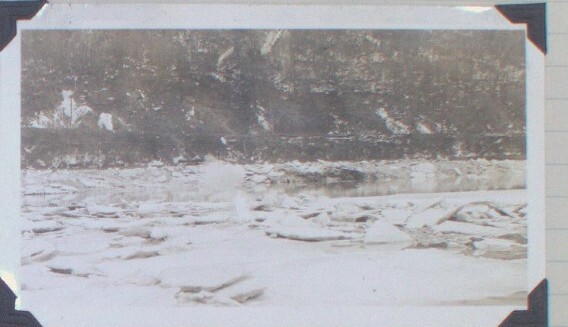
McGill University Archives, Howard Turner Barnes MG 1016, Journal 668-2a PA027406 Thermit Images Note-book containing photographs, entitled: "Thermit -Ice Reaction”. Destruction using hermit of an ice jam for the National Transit Pump and Machine Company in Oil City, PA, 1926 Part 2
Thermite is ignited and reacts with the ice by generating a very high temperature producing a hot liquid steel that causes the ice trapped below the surface to break into its two parts, hydrogen and oxygen. This chemical reaction causes oxygen to form oxide but also results in hydrogen producing a very hot penetrating gas that burns in the presence of air on the top of the ice in a sheet of flame causing the ice to implode and break up. (Barnes, Scientific Monthly, p.295-296).
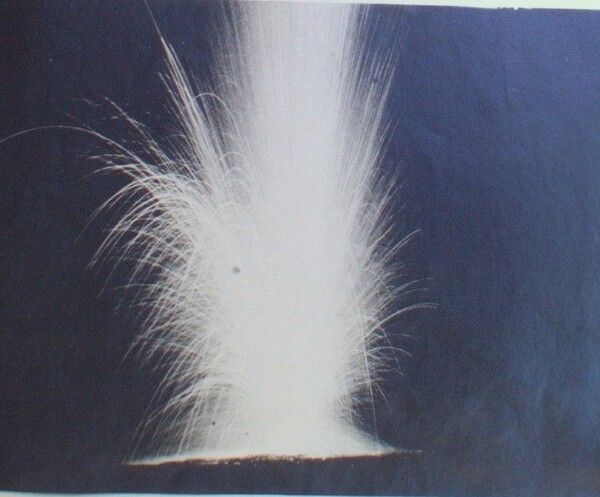
McGill University Archives, Howard Turner Barnes MG 1016, Journal 668-2a PA027406 Thermit Images Note-book containing photographs, entitled: "Thermit -Ice Reaction”. Thermit nighttime explosion, p.75
The advantage to this process for the ice is that it is destroyed from within the ice at a super high temperature. A dogged researcher, he forged a series of experimental studies on the destruction and dislodging of ice. To test the thermite, he engaged in numerous trips to the area of Newfoundland to access icebergs and to rivers where ice blockage wreaked havoc to internal shipping routes and caused springtime flooding in North America. He also used other chemistry-based processes to dislodge ice including calcium chloride on ice packs in rivers. (Barnes, NRC report p.8). He wrote many published articles and reports in this area cumulating with the publication of his seminal work titled Ice Engineering in 1928.
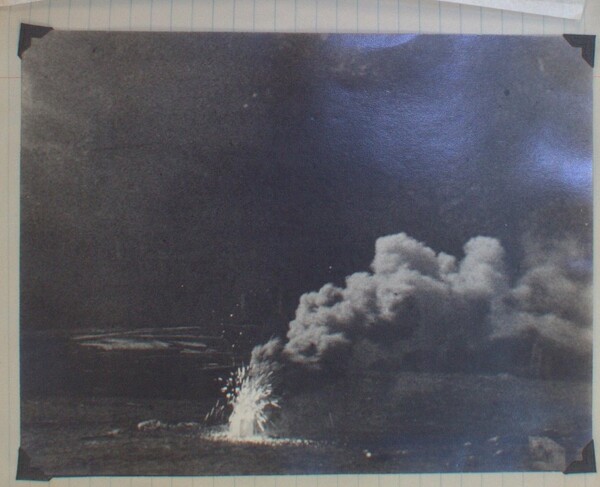
McGill University Archives, Howard Turner Barnes MG 1016, Journal 668-2a PA027406 Thermit Images Note-book containing photographs, entitled: "Thermit -Ice Reaction”. Thermit nighttime explosion with smoke p.97
Bibliography
Howard Turner Barnes, Ice Engineering, Renouf Publishing House, Montreal, 1928
John Stuart Foster “Howard Turner Barnes, 1873-1950” obituary in The Royal Society, Biographical Memoirs of Fellows of the Royal Society, Vol.8, Issue 21, Nov. 1, 1952. https://doi.org/10.1098/rsbm.1952.0003 Accessed: March 22, 2023.
Yves Gingras, “Howard Turner Barnes” in Canadian Encyclopedia, https://www.thecanadianencyclopedia.ca/en/article/howard-turner-barnes Accessed June 26, 2023
Phillip Hewett, “Barnes, William Sullivan,” in Dictionary of Canadian Biography, vol. 14, University of Toronto/Université Laval, 2003–, accessed June 25, 2023, http://www.biographi.ca/en/bio/barnes_william_sullivan_14E.html Accessed: June 25, 2023
Joe Schwartz, McGill Office for Science and Society. The Thermite reaction article, 2017.https://www.mcgill.ca/oss/article/thermite-reaction Accessed May 3, 2023.
Society of American Archivists. Dictionary of Archives Terminology. Outreach. https://dictionary.archivists.org/entry/outreach.html Accessed May 3, 2023.
A. Norman Shaw, “Howard Turner Barnes”, obituary in Royal Society of Canada, 1951, Proceedings and Transactions Third Series, Vol. XLV, Meeting of June 1951, p.77-81.
Archival Sources
McGill University Archives, Howard Turner Barnes fonds, MG1016, Item 454/678 - “The Science of Ice Engineering” by Howard T. Barnes reprinted from the Scientific Monthly, October 1929, Vol. XXIX, p.289-287.
McGill University Archives, Howard Turner Barnes fonds, MG1016, Item 454/608 Report done in 1929 as an Assisted Research Report to the National Research Council by Barnes on the Adhesion of Ice Research, p. 1-8.
DRAW video on McGill Science Instagram by Gordon Burr - Adjunct Professor, McGill School of Information StudiesMaking the Weather Worse
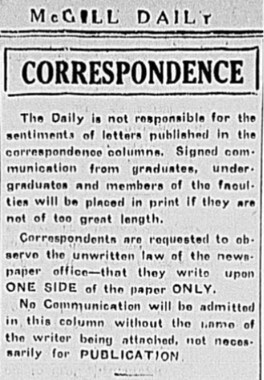
Correspondence Collum Heading, The McGill Daily Vol. 13 No.016 October 18, 1923, p. 4
Occasionally, we humans can make a gloomy day worse for each other. Whether from a car rushing through a puddle and thoroughly soaking a pedestrian or someone shoveling their walk just to shovel it all onto their neighbor’s walk, sometimes the worst part of poor weather is other people.
McGill students a century ago had the same problems and one particularly upset Arts student in 1923 wrote in to the McGill Daily about the Sophomore class’s hazing methods on the Freshmen. The student had heard a story about a freshman being driven to Lachine and left there. It had been pouring rain, and the freshman had been forced to walk nine miles back, getting thoroughly soaked. According to the writer the Freshman became gravely ill, with people fearing for his life and having to be out of classes for several weeks.
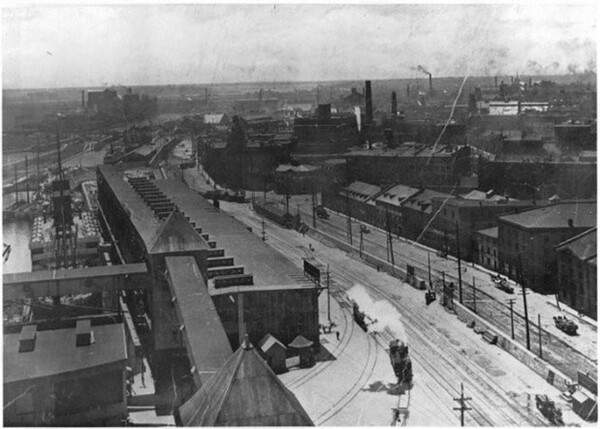
The Valley of the Lachine Canal, Montreal, QC, about 1910, 1910 ca, Public Domain, Notman Photographic Archives, McCord Museum, Object Number: MP-0000.879.17
The writer seems appropriately furious, pointing out that the “University authorities” had banned the harsher methods of hazing and that the past several sophomore classes have been abiding by this ban. It appears the common form of initiation in the past couple years was making the Freshmen wear distinctive hats or other visible markings signifying them as Freshmen, though this seems to be mostly regulated by the Students’ Council. “Freshettes” of the Royal Victoria College were often given green bows to wear to signify their status. The Sophomores seem to have a few rules for the decorated freshmen, such as opening doors for upper classmen and putting out the chairs for meetings. As a result, the story the student reports appear to come as a surprise to them and they end their letter calling for action from the “proper authorities”.
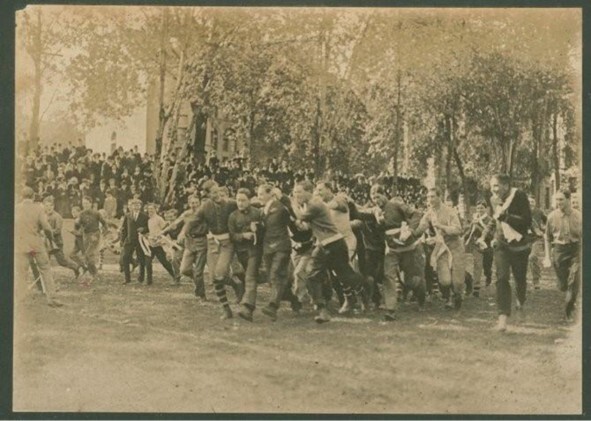
Photo of the 1911 engineering frosh initiation. The initiates, many laughing, are running while a crowd of men and women watch, 1911, Public Domain, Photo #: 2016-0063.04.6, McGill University Archives
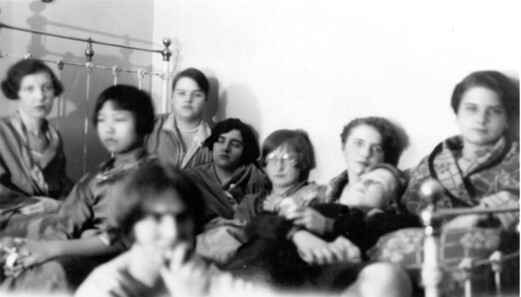
Freshies of class of 1930 gather for a midnight chat in a Royal Victoria College bedroom, October 1926, Public Domain, Photo #: PU038165, McGill University Archives.
The opinions of the student in this letter are understandable, especially if the sickness was as dire as they report. It seems likely that the sophomores in question used the rainy fall day to augment their “initiation” activities. In addition, someone had to have a car to drive all the way to Lachine. The letter writer accuses the sophomores of losing their common sense during the initiation rituals, and one wonders if the writer would be as upset if it hadn’t been raining and the freshmen hadn’t taken ill as a result. Either way the inclement weather clearly made the situation far more dangerous, so whether it was done purposefully or simply a lack of “common sense” the result was the same.
Though this particular incident is more than a simple inconvenience it seems students making the weather conditions worse for each other was no surprise. A common “nuisance” in the early 20th century, particularly for the Royal Victoria College students (or at least the writer reports that this complaint came from the women of the school), is students walking down the sidewalk particularly slowly all in a row. The Daily writer remarks that in the cool, rainy fall weather the only option to pass the slow-walking men would be to step into the muddy street, which the writer reports the woman that was overheard complain about.
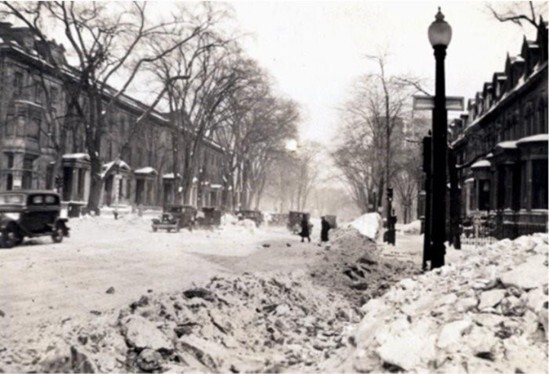
Sherbrooke Street in the winter, 1925 ca, Public Domain, Photo #: PU010507, McGill University Archives.
It’s terribly easy for us to inconvenience each other without realizing it, but a bit of thought to others in one's daily life could go a long way. But if someone wants to make life a bit worse for you on purpose, Montreal’s weather makes it awfully convenient.
References
“Correspondence”, The McGill Daily Vol. 13 No. 016 (1923, Oct. 18) https://archive.org/details/McGillLibrary-mcgill-daily-v13-n016-october-18-1923-6974/page/n3/mode/1up
“Another Nuisance”, The McGill Daily Vol. 04 No. 046 (1914, Nov. 24) https://archive.org/details/McGillLibrary-mcgill-daily-v04-n046-november-24-1914-5857/page/n3/mode/1up
“The Council Announces”, The McGill Daily Vol. 11 No. 005 (1921, Oct. 7) https://archive.org/details/McGillLibrary-mcgill-daily-v11-n005-october-07-1921-6705
“Sophs. Hear Straight Talk from Council”, The McGill Daily Vol. 12 No. 006 (1922, Oct. 7) https://archive.org/details/McGillLibrary-mcgill-daily-v12-n006-october-07-1922-6832
“Freshettes Handed their Green Bows”, The McGill Daily Vol. 16 No. 014 (1926, Oct. 15) https://archive.org/details/McGillLibrary-mcgill-daily-v16-n014-october-15-1926-7367
A Comedian (or two) on Staff
It appears McGill Students a hundred years ago delt with the frustrations of the long Canadian winters much the same as students today deal with inconvenience: dry sarcasm. A few writers for the McGill Daily must have been budding comedians and dealt with the inclement weather and harrowing Canadian winters by poking light fun at, most often, the infrastructure that failed to weather it, so to speak.
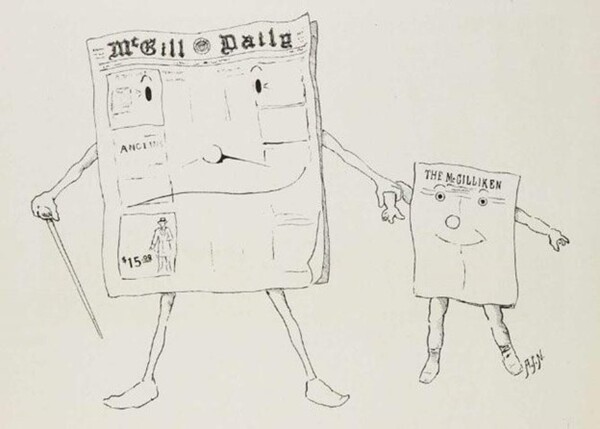
McGill Daily Illustration, from the Online McGill Yearbooks, McGill Library, 1917, p. 10
Take, for example, a Daily reporter telling their fellow students to “Stand to, you lubbers, and man the boats; the good ship “Arts” has sprung a leak” when room 113 flooded in the spring of 1917. The room had apparently been leaking all winter, requiring large tubs to catch the water and mopping-up between periods, but the writer remarks that with the snow and ice melting on the roof of the building what once was a steady dripping became a “miniature cataract”, causing the classroom to be unusable and students and professors having to wander the building in search of “a classroom which is vacant and at the same time weather-tight".
The writer dubs the room “unseaworthy”, and their whimsical tone makes light of the fact that the roof of room 113 is in danger of collapsing. While seeming to poke light fun at the state of the university’s infrastructure, the article is a far cry from accusatory. It frames what would be a rather inconvenient disruption to regular university life as a joke.
Much like one of the Daily’s inquisitive reporters in 1924, who invaded the McGill Observatory for an exposé of its workings, the inquisitive student writing this post invaded a university building to do some much-needed investigation and reconnaissance. It turned out far less successful for this writer though, as it was quickly discovered that at some point in the many renovations the Arts Building has gone through since 1917, Room 113 has ceased to exist. (But given how it leaked until it was flooded, perhaps the renovation that did away with it was the correct choice.) The Arts Building today, now officially titled the McCall MacBain Arts Building, looks much different than it did back then, with several other university buildings Frankenstein-ed off it and shiny new interiors.
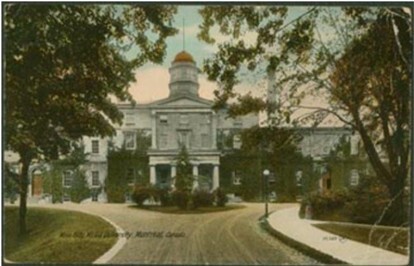
Postcard of Arts Building, McGill University, 1917 ca, Public Domain, Photo #: 2009-0123.03.2, McGill University Archives
Another Daily writer makes fun of winter woes in 1926, announcing that “Ships always limp to port, but Trains Arrive on Crutches”. Simultaneously, making light of the way other reporters describe ships that have encountered inclement weather and of the trains’ inability to arrive on time in the winter. Train delays were a regularly reported consequence of heavy snow at the time, making travelling complicated, particularly it seems for McGill sports teams who often had to have competitions canceled or rescheduled due to their own or the other teams train being delayed. The Daily reporter finds this amusing rather than inconvenient, which is probably a healthy way to deal with something you can’t change.
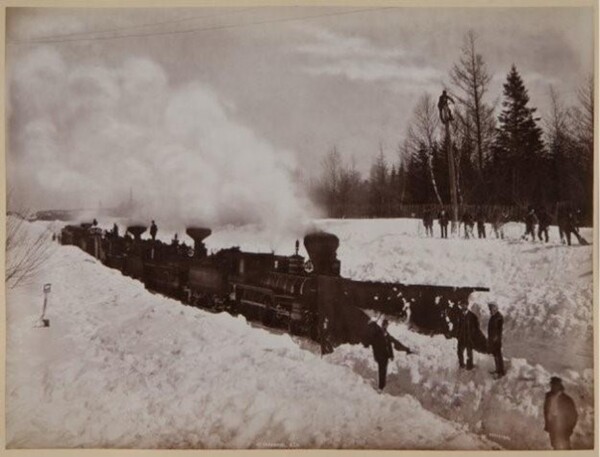
Grand Trunk Train in snow, Chaudière, near Quebec City, QC, 1869, Alexander Henderson, 1869, Notman Photographic Archives, McCord Museum, Object Number: MP-1968.311.96.
The greater McGill student population seemed to take a similar approach to the long, unpredictable winter in Montreal, as The Daily notes that one entrepreneurial commerce student created a weather-based stock market in 1935. The goal was to buy a weather “stock” at low temperatures and sell at high temperatures, making students attempt to guess the highest it would get in the fluctuating winter weather. This writer must wonder how profitable this endeavor was, though it surely made the winter less dreary, as one followed the variable weather with the hopes of winning big. A sudden drop in temperature could be an opportunity to buy and a storm bringing in a bit of warmth could be the high one was waiting for.
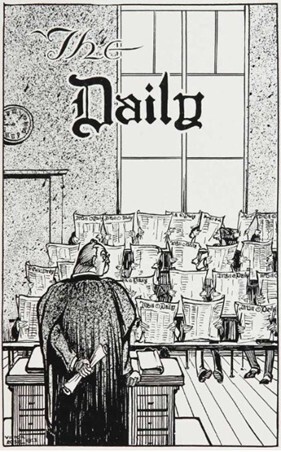
McGill Daily Illustration, from the Online McGill Yearbooks, McGill Library, 1924, p. 217
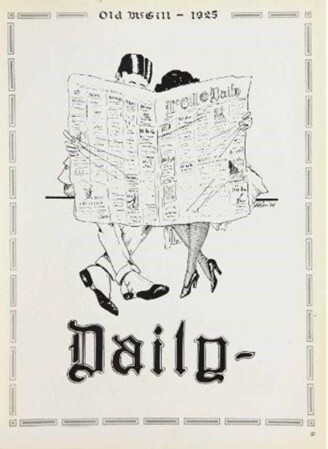
McGill Daily Illustration, from the Online McGill Yearbooks, McGill Library, 1925, p. 27
In the dragging of this winter, the writer would recommend any of the articles mentioned if one needs a good chuckle. Yours truly found it particularly helpful to stumble across the early twentieth century sense of humor after hours of sifting through hundred-year-old newspapers detailing all the ways tough winters and dry summers made life more difficult. Humor is a tried-and-true coping mechanism and it’s nice to know a century ago wasn’t much different, laughing to brighten up the darker days.
References:
“Frosty Financing”, The McGill Daily Vol. 24 No. 068 (1935, Jan 31) https://archive.org/details/McGillLibrary-mcgill-daily-v24-n068-january-31-1935-8418/page/n1/mode/1up
“Observatory was invaded by reporter”, The McGill Daily Vol. 13 No. 075 (1924, Jan 12) https://archive.org/details/McGillLibrary-mcgill-daily-v13-n075-january-12-1924-7032
“Ships always limp to port, but trains arrive on crutches”, The McGill Daily Vol. 14 No. 088 (1925, Feb 4) https://archive.org/details/McGillLibrary-mcgill-daily-v14-n088-february-04-1925-7171
“Stand to, you lubbers, and man the boats; the good ship “Arts” has sprung a leak”, The McGill Daily Vol. 06 No. 122 (1917, March 10) https://archive.org/details/McGillLibrary-mcgill-daily-v06-n122-march-10-1917-6190
“Skiers and Snowshoers Here To-day", The McGill Daily Vol. 12 No.096 (1923, Feb 15) https://archive.org/details/McGillLibrary-mcgill-daily-v12-n096-february-15-1923-6922
“Home, Sweet Home Was Good Enough for out Wrestlers”, The McGill Daily Vol. 03 No. 101 (1914, Feb 18) https://archive.org/details/McGillLibrary-mcgill-daily-v03-n101-february-18-1914-5785
“Speed and Condition Told for Harvard in the Annual Clash with McGill on “Canadian Night” at Boston Arena; Red and White Whitewashed”, The McGill Daily Vol. 06 No. 099 (1917, Feb 12) https://archive.org/details/McGillLibrary-mcgill-daily-v06-n099-february-12-1917-6167
“Molson Hall, Arts Building and Moyse Hall, and Dawson Hall”, Virtual McGill, Canadian Architecture Collection. https://cac.mcgill.ca/campus/buildings/Molson_Arts_Dawson.html
Fair Weather, Unfair Realities
It’s October 5th, 1927. Weather logs of the day record it being “fair and cool”, with a temperature ranging between 14 and 18 degrees celsius. Gentle winds blew over McGill University, as a graduating class was preparing for the Fall Convocation ceremony, held inside Moyse Hall at noon.
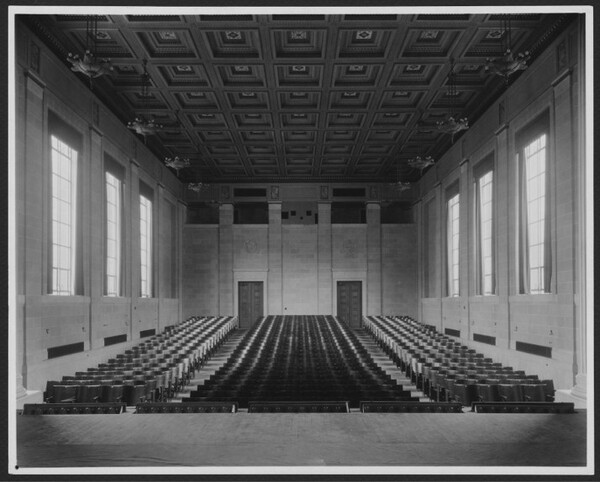
Associated Screen News, “Moyse Hall, Arts Building”, 1925a, PR026607, McGill University Archives
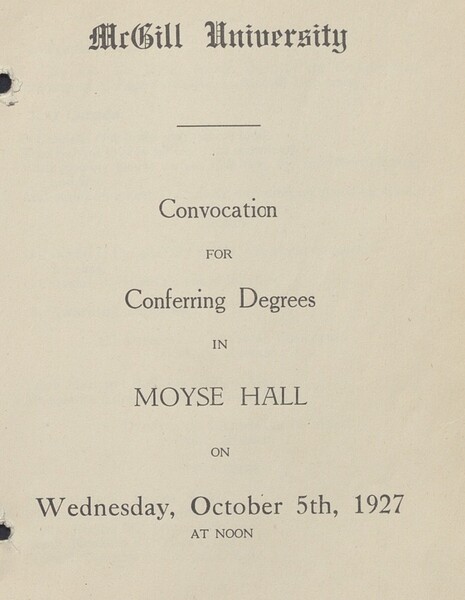
McGill University. (1927). Convocation for Conferring Degrees in Moyse Hall on Wednesday, October 5th, 1927 at Noon [Order of Proceedings]. (MG4319). McGill University Archives, Montreal, QC, Canada. https://public-content.library.mcgill.ca/MLAC/MUA/MG4319/convocation/mua_conv_1927-10-05_convocation.pdf
After degrees were conferred, principal Sir Arthur Currie delivered the founder’s day address and opening address for the session (McGill, 1927). Speaking to the strengths of the university, he characterizes McGill University as a place; “... where men and women from all the provinces and from all countries meet in common interest, is acting as the breeding ground for a better national and international understanding, which is leading inevitably to the destruction of sectional jealousies and prejudices” (“Sir Arthur Currie”, 1927).
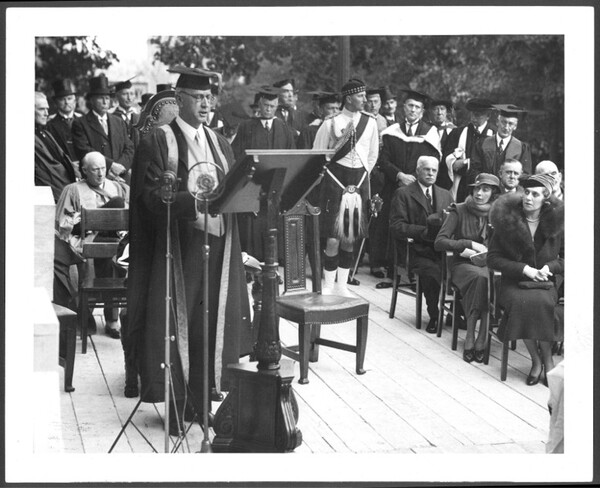
Principal Arthur Currie giving a speech at McGill, ca.1930, PR000364, McGill University Archives.
Currie’s address begs the question, was McGill really a place that broke down societal prejudices in 1927?
A flip through the 1927 yearbook made us question this claim. Predictably for the era, the pages are dominated by white men with English names. From the list of graduating students, the music department stands out as being made up mainly of women’s names; Molly B. Bare, Kate May Clark, Bertha M. Dunn, and Dorothy A. Salmon. When you find a photo of the Conservatorium of Music in the yearbook, these names are nowhere to be found. A group of smiling young women, donned in winter coats and hats and holding their school bags, pose in front of the Conservatorium, but their identities are uncertain.
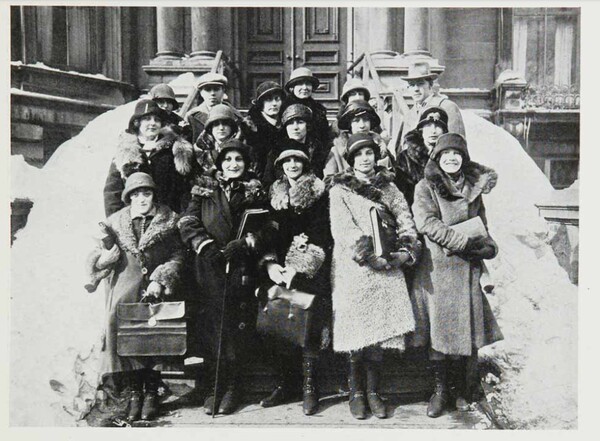
McGill Conservatorium of Music, 1927 Old McGill, p. 155, https://yearbooks.mcgill.ca/viewbook.php?campus=downtown&book_id=1927#page/158/mode/2up.
The underrepresentation of women pales in comparison when considering the anti-semitism on campus in 1927. McGill is considered the most exclusionary Canadian university towards Jewish students during the inter-war years, leading the country in terms of quotas and increased admission requirements for Jewish people (Axelrod, 1990, p. 33). Between 1913 and 1925, the percentage of Jewish students at McGill rose from 6.8% to 25%, a trend that alarmed administrators who sought to maintain the university’s Anglo-Saxon Protestant majority. This prejudice was exemplified by figures such as Ira MacKay, the dean of Arts, who stated,“Jewish people are of no use to us in this country”, and that they “do not fit in with a high civilization in a very new country” (quoted in Axelrod, p. 33).
In a 1926 letter, Mackay suggests that Currie limits admission of Jewish students. Although this never became an official policy, other correspondence shows that a quota was set to 9-10%. This was only one of a set of unofficial policies that restricted the number of Jewish students, with others raising the required grade average for admittance, or with the faculties of Law and Medicine adopting especially restrictive quotas. These policies worked, with the Jewish population falling to 10.7% by 1933. They would not be fully repealed until the 1960s (McGill Bicentennial).
Despite these abhorrent policies, organized Jewish life still existed in the McGill of 1927. Notably, the Maccabean Circle was the first Jewish club on campus, hosting regular discussions and debates on various Jewish issues, and acting as the representative Jewish group on campus (McGill Bicentennial). The existence of this group points to solidarity within the Jewish community which existed despite McGill’s racist policies

Maccabaean Circle, Old McGill 1927, p. 294, https://yearbooks.mcgill.ca/viewbook.php?campus=downtown&book_id=1927#page/298/mode/2up.
Similar to the anti-semetic policies, racial quotas have appeared in McGill’s history in the 1920s, 1930s, and after World War II (Morton, 2021, p. 9). West Indian newspapers reported on discrimination against Black medical students at McGill, and in the 1920s the Bahamas Legislature removed McGill from an approved list of universities for scholarships due to the exclusion of Black students (Morton, p. 9).
Despite this, the convocation on October 5th included Ben O. Yisu Das (BA), a Guyanese student who according to the McGill Daily was one of the founders of the Labor club and spoke at the Philosophy Society (“Joint Meeting”, 1930). Yisu Das’ photo was not in the 1927 yearbook, and his nationality was mistakenly attributed as Indian. Yisu Das went on to become headmaster at Berbice High School for Boys in Guyana in 1933, where he also taught History of the British Empire (BHS Alumni Association). The autobiography of a past student describes him as a passionate lecturer, with a reading of history which focused on anti-racism and anti-fascism, particularly relevant in the face of Hitler’s rise to power. (Carew, 2014).
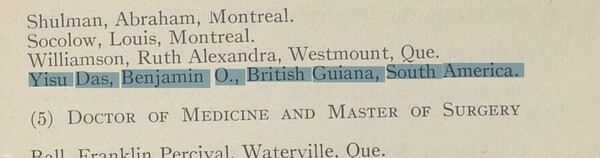
McGill University. (1927). Convocation for Conferring Degrees in Moyse Hall on Wednesday, October 5th, 1927 at Noon [Order of Proceedings]. (MG4319). McGill University Archives, Montreal, QC, Canada. https://public-content.library.mcgill.ca/MLAC/MUA/MG4319/convocation/mua_conv_1927-10-05_convocation.pdf

Old McGill 1927, p. 340, https://yearbooks.mcgill.ca/viewbook.php?&campus=downtown&book_id=1927#page/340/mode/1up
Currie delivered his speech on that cool fall day knowing that under his leadership, the university was actively imposing policies excluding those outside of McGill’s white and protestant status-quo. When he spoke of “men and women from all the provinces and from all countries” coming together to destroy prejudice, they were doing so despite the university, rather than because of it.
References:
Axelrod, P. (1990). Making a Middle Class: Student Life in English Canada during the Thirties. McGill-Queen’s University Press. https://www.jstor.org/stable/j.ctt80r4k
Carew, J. R. (2014). Potaro dreams: My youth in Guyana. Hertford : Hansib Publications Limited. http://archive.org/details/potarodreamsmyyo0000care
Clubs to Hold Joint Meeting: Labour and Philosophical Societies Come Together. (1930, February 21). McGill Daily, p. 1. Retrieved from https://archive.org/details/McGillLibrary-mcgill-daily-v19-n109-february-21-1930-7860/mode/2up?q=%22yisu%22
History of Berbice High School. (n.d.). Berbice High School Alumni Association. Retrieved February 10, 2025, from https://bhsalumni-ny.org/school-history.
McGill University. (1927). Convocation for Conferring Degrees in Moyse Hall on Wednesday, October 5th, 1927 at Noon [Order of Proceedings]. (MG4319). McGill University Archives, Montreal, QC, Canada. https://public-content.library.mcgill.ca/MLAC/MUA/MG4319/convocation/mua_conv_1927-10-05_convocation.pdf
Sir Arthur Currie Refutes Criticism of Universities: Justifies Effectiveness of McGill After 100 Years by Products. (1927, October 6). The Gazette, p. 5. Retrieved from https://proxy.library.mcgill.ca/login?url=https://www.proquest.com/newspapers/october-6-1927-page-5-22/docview/2158599666/se-2
Suzanne Morton, 2021, “Black McGill”, https://www.mcgill.ca/antiblackracism/files/antiblackracism/black_mcgill_may_2021.pdf.
The Maccabean Circle and early Jewish life at McGill. (n.d.). Bicentennial - McGill University. Retrieved February 9, 2025, from https://200.mcgill.ca/history/the-maccabean-circle-and-early-jewish-life-at-mcgill/
McGill Convocation of May 29th, 1930
The weather in Montreal on the 29th of May 1930 was remarked as cloudy and cool with light drizzle starting in the afternoon and continuing into the evening. The highest observed temperature was 56°F(13°C) and the lowest was 45.2°F(7.3°C). It was overcast when it was not drizzling, and the brisk May weather kept the relative humidity in the high 80s, meaning any precipitation was liquid and not frozen. Winds were north in the early morning, but by 3PM the direction changed west as the drizzle arrived in the early afternoon.
The day’s convocation would award over 400 students with their degrees. Held at the Capitol Theatre before noontime, the day’s events included a garden party, several guest speakers, and 6 honorary degrees were given out. The honorary degrees went to Justice Duff, T.B. Macaulay, Ethel Hurlbatt, Charles B. Kingston, William Bulkeley-Evans, and J.C. McLennan. Kingston and Bulkely-Evans were from South Africa and England respectively.
One of the convocation’s speakers was Sir Arthur William Currie, a veteran of the first world war and former General of the Canadian army. He was also the principal and vice-chancellor of McGill University from 1920 until his death 3 years after the 1930 convocation in 1933. He spoke at every convocation during his tenure and the following picture depicts his speech for the 1930 convocation.
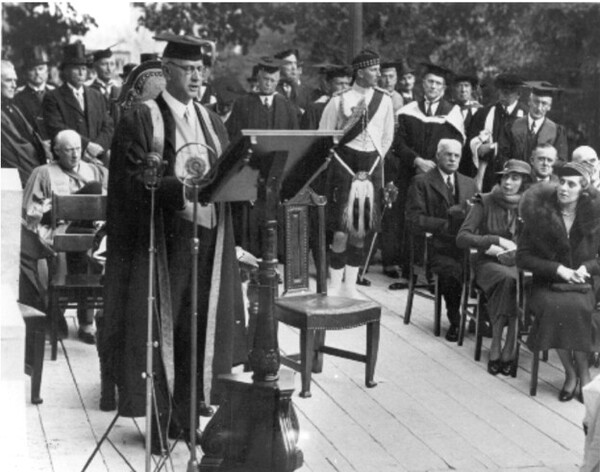
McGill University Archives, PR000364 https://www.archives.mcgill.ca/aspfile/searchphoto4.asp?f1=convocation&choosedb=allphoto&Orderby=Date&recsperpage=10000&fileName=photosearch.htm
The day of the convocation was written in at least 2 newspapers. The McGill Daily wrote of it ahead of time in the final newspaper of the school year on April 24th, over a month ahead of graduation. This article was focused on what events will take place on that day, acting as a primer and as a sort of promotion for the event. The Gazette also wrote an article on the convocation, with an article in the May 29th, 1930 edition of the paper. This article differed in that it featured details on the various speeches given for the ceremony, as well as other details. The two contrasting articles and their time of release is an interesting comparison.
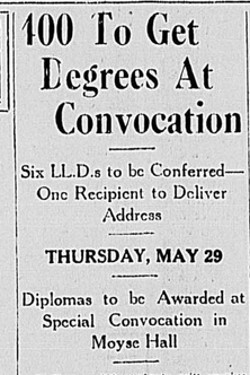
McGill Daily, Vol. XIX, No. 134. April 24, 1930 https://archive.org/details/McGillLibrary-mcgill-daily-v19-n134-april-24-1930-7884/mode/2up?view=theate
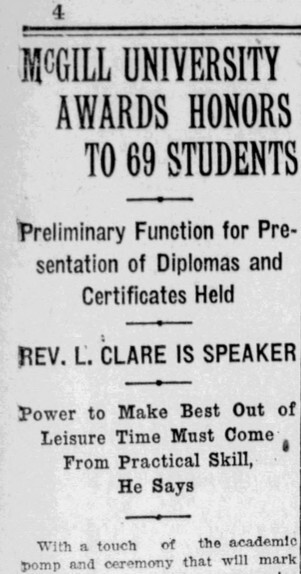
The Gazette, Vol. CLIX, No. 128. May 29th, 1930. https://proxy.library.mcgill.ca/login?url=https://www.proquest.com/hnpmontrealgazette/newspapers/may-29-1930-page-4-24/docview/2158666232/sem-2?accountid=12339
McGill released a yearbook, also called an “annual,” for that year’s graduating class, 358 pages long, and titled Old McGill 1930, the yearbook featured pictures of all graduates, school clubs and teams, various letters of congratulation from prominent figures, several cartoons and art pieces, jokes, and student details. One of the cartoons is Mutt and Jeff, an incredibly popular comic of the period, and was created specifically for the yearbook
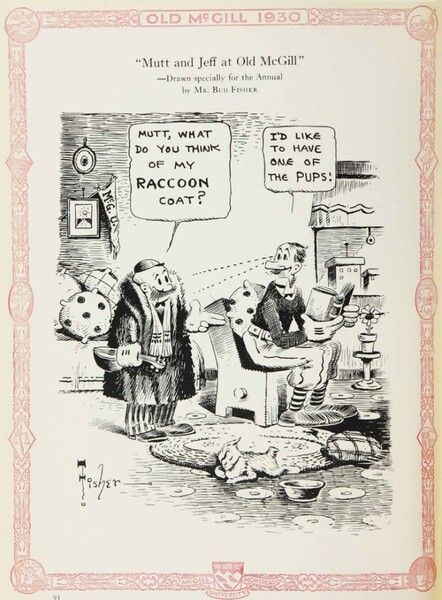
Mutt and Jeff, by Bud Fisher. Old McGill 1930, page 91 https://yearbooks.mcgill.ca/viewbook.php?campus=downtown&book_id=1930#page/110/mode/2up
The yearbook, the 33rd edition McGill released, is an interesting artifact for looking at the period. The book enables examination of what was viewed as important by the class, what clubs have stood the ground of time, the many graduates and their class sizes, student life associations, and more. There is a glimpse into the lives of the era’s students. It is a piece of history and preserves the class’s time at the school.
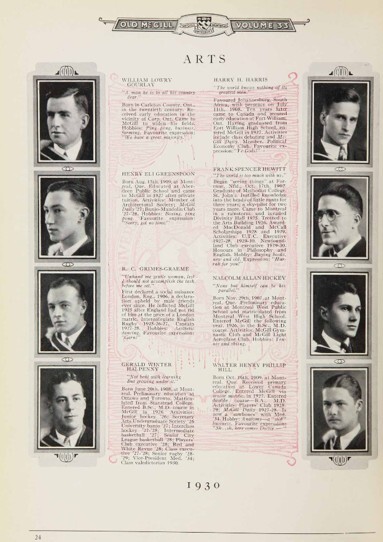
Old McGill 1930, page 24 https://yearbooks.mcgill.ca/viewbook.php?campus=downtown&book_id=1930#page/30/mode/2up
McGill’s place in both student and external newspapers, the efforts put into creating the 1930 yearbook and the photographed traditions of the convocation are all artifacts that show the events of that rainy day in 1930.
Before the Storm: The Life of Andrew William Davis Swan from Graduate to Veteran

Title: Cover page, McGill University Convocation Program Source: McGill University Archives URL: http://public-content.library.mcgill.ca/MLAC/MUA/MG4319/convocation/mua_conv_1929-10-07_convocation.pdf Collection: MG4319 Accession Number: 1046 Page: 1
The convocation occurred on October 7, 1929 (just weeks before the “Great Crash” of October 29,1929, which led to the Great Depression, a true economic storm. McGill University hosted its Monday convocation at four o’clock in the afternoon on a crisp autumn day. According to The Montreal Star, the morning temperature was 56°F (13.3°C) at 8 AM, with an overnight low of 54°F (12.2°C). The Gazette forecasted fresh west to northwest winds, fair conditions, and a cool night – perhaps a fitting metaphor for the steady resilience these graduates would soon need. The air may have been fair and cool, but the pressure was building, both in the economy and for the graduates stepping into an uncertain world.
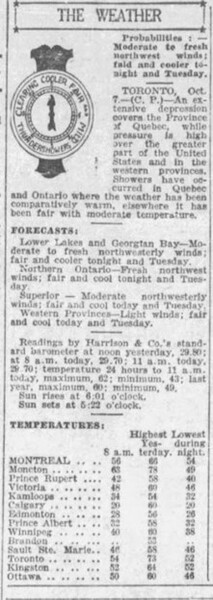
Title: The Weather (Detail of weather forecast, The Montreal Star, October 7, 1929.) Publication: The Montreal Star Date: October 7, 1929, page 2. Source: Newspapers.com URL: https://www.newspapers.com/image/740146117 Copyright: © 2025 Newspapers.com. All Rights Reserved.

Title: Detail of weather forecast, The Gazette, October 7, 1929, front page. Creator: The Montreal Gazette Date: October 7, 1929 Source: Google News Archive URL: https://news.google.com/newspapers?nid=Fr8DH2VBP9sC&dat=19291007&printsec=frontpage&hl=en Copyright: © 2025 Google News Archive. All Rights Reserved Transcript of Detail: Weather Forecast Fresh west to northwest winds; fair; cool at night For complete weather report see page 7.
Among the hopeful graduates was the dashing Andrew William Davis Swan, born October 1, 1904, in Ottawa, Ontario. A former Boy Scout during WWI, Swan stood amongst his peers, awaiting his name to be called as he anticipated receiving his Bachelor of Commerce degree, his future as fair as the autumn sky overhead.
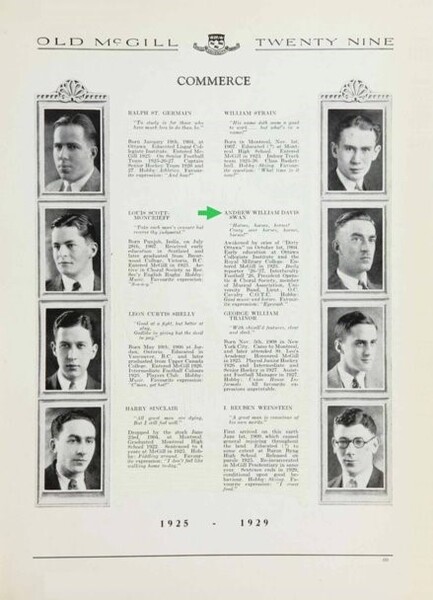
Title: Detail from 1929 Yearbook Author: McGill University Date: 1929 Page 77 Source: McGill University Yearbooks Archive URL: https://yearbooks.mcgill.ca/viewbook.php?campus=downtown&book_id=1929#mode/2up Copyright: © 2011 McGill University Archives. All Rights Reserved.
With an exceptional co-curricular background detailed in his yearbook, Swan entered McGill University in 1925 after attending the Royal Military College. Athletic yet artistic, Swan was a Daily reporter in 1926-1927, played interfaculty football in 1926, and was President of the Operatic & Choral Society. He was also a member of the Musical Association and played in the University band. During his time at McGill, he met his future wife, Ruth Harrison, and graduated alongside her in this very ceremony. Their love promised rays of sunshine through the foggy future.
Like all graduates, the job search began the moment he received his diploma. Swan was hired by the city of Westmount as a city accountant the following year in 1930. But by 1939, storm clouds gathered with the outbreak of WWII. At the age of thirty-five, Swan chose to serve with the Royal Montreal Regiment (RMR) despite being eligible to opt out. The same year, he was promoted to captain and given command of the 3rd Canadian Infantry Anti-Tank Company. A strong sense of duty pulled him away from home, and he braced himself for the turbulent years ahead.
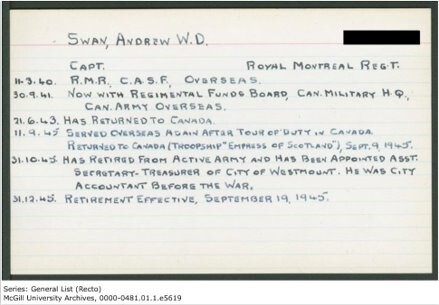
Title: Swan, Andrew W. D. Description: Service Record Card for Capt. Andrew W.D. Swan, Royal Montreal Regiment Document Type: Military Service Record Card Institution: McGill University Date: 1945 Series: General List (Recto) Source: McGill University Archives URL: https://www.archives.mcgill.ca/public/exhibits/mcgillremembers/war_records/0000-0481.01.1.e5619.jpg Collection: War Records Accession Number: 0000-0481.01.1.e5619 Copyright: © McGill University Archives. All Rights Reserved
During Dunkirk in 1940 and the invasion in 1944, Swan was selected to lead a guard team escorting German prisoners-of-war to America. He returned home to Westmount in 1943, a temporary break in the storm, but was soon called back due to shortages in his unit. When the war ended in 1945, he returned to Canada aboard the “Empress of Scotland,” finally sailing into calmer waters. After six years of separation from his beloved wife Ruth and their four children, he was relieved to be home at last, soaking up the warmth of the family after years of hardship.
After the war, Swan resumed his career, becoming assistant secretary-treasurer of Westmount in 1945 and being promoted to secretary-treasurer in 1950. His last professional role was at POM Bakery, where he retired in 1964. In 1960, he designed his own coat of arms (Swan, 2020.) through Lord Lyon King of Arms, incorporating symbols of Westmount, his beloved neighborhood, and his family heritage. Upon this passing, he left the crest to his oldest son as a lasting emblem of his eventful life, a compass to guide future generations through any storms they might face in their lifetime. Much like the autumn winds that swept through Montreal on his convocation day, his journey was marked by both calm and turbulence, each moment shaping the legacy he left behind.
References:
Swan, M. (2020, November 17). Soldier, veteran, city employee Andrew Swan lived through World War II, Westmount history. Westmount Independent, 7-10. https://www.westmountindependent.com/WIv14.11c.pdf
The Gazette. (1929, October 7). Weather forecast. The Gazette. Google News Archive. https://news.google.com/newspapers?nid=Fr8DH2VBP9sC&dat=19291007&printsec=fr ontpage&hl=en
The Montreal Star. (1929, October 7). Weather report. The Montreal Star, p. 2. Newspapers.com. https://www.newspapers.com/image/740146117
To Laval-sur-le-Lac on a Rainy 1928 Day
For a late spring day hinging toward summer, May 30, 1928 was reported in the Montreal Gazette as rainy and cold (“Weather Report”, 1928). In fact, another daily newspaper, Le Devoir, for the same day, is not surprised:
June is one of the most beautiful months of the year; it seems to have supplanted, in everyone's opinion, the month of May, which used to be referred to only as 'the lovely month of May' and which, for years, has seemed to be nothing more than an extension of winter. Indeed, in the last few days I've met young girls bundling up chilly in warm furs, and it wasn't purely a whim of fashion. (“Le Voile de la Mariée”, 1928)
Whether the Montreal women read the papers or listened to the radio in the morning, the experience of weathering every Quebecan season would have taught them to dress warmly. More than 40 of them—most of them the socialite wives to the influential men of their time—gathered on May 29 at Laval-sur-le-Lac Golf Club. It was a party, and the inclement weather would not put them off! (“À Laval-sur-le-Lac”, 1928a)
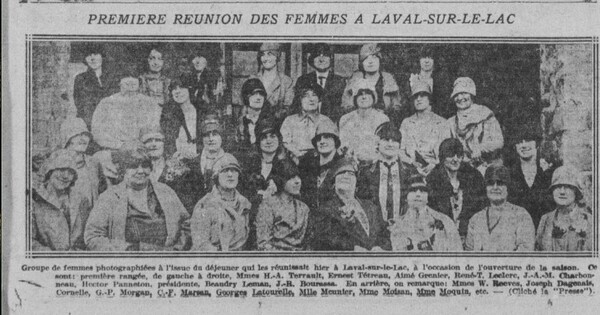
Premiere Reunion des Femmes A Laval-sur-le-Lac. La Presse, May 30, 1928.La Vie Sociale: À Laval-sur-le-Lac. (1928, May 30). La Presse, p. 2-3. https://collections.banq.qc.ca/ark:/52327/2972448
Among them, the president of the women’s section, Mrs Hector Panneton—who, like custom dictated until 1967, bore her husband’s names as her own—was due to attend and preside upon the luncheon given that day to open the Women’s Golf season. The Blind Handicap competition scheduled for the afternoon could be postponed to the following week, but the social event attracted a journalist from La Presse, and that could not be rescheduled. The article featured prominently on May 30 in page 2 of La Presse’s “La Vie Sociale” section (“À Laval-sur-le-Lac”, 1928a). One can read there how Mrs Panneton greeted the congregation for this new season and what activities they could expect. The rest of the article—two thirds of it, in fact—describes in detail how 41 of the attending ladies were dressed for the event, and consequently for the weather.
Indeed, Mrs. Panneton “wore a navy blue two-piece dress with white trim, a blue pencil handkerchief collar and a black straw hat” (“À Laval-sur-le-Lac”, 1928a), and among the other posh women who were recognized, ten wore furs (three silver foxes, two rock martens, two Russian martens, a beaver, a mink, and a lynx), nine wore woolen fabrics (nine kasha, one tweed), and four wore coats or sweaters. A little more than half of the assembly came wearing fashionable crepe or jersey dresses. Everyone of them wore felt or straw or bakou hats matching their outfits. (“À Laval-sur-le-Lac”, 1928a)
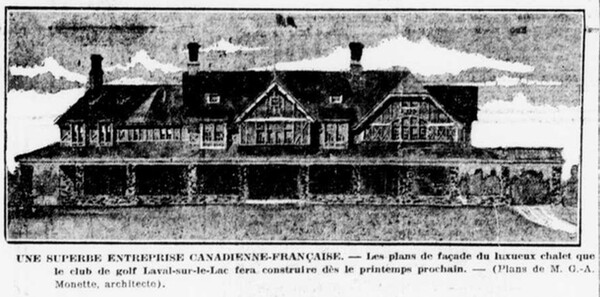
Le Club Laval-sur-le-Lac, La Presse. December 31, 1918 . Les Nôtres et le Golf: Le Club Laval-sur-le-Lac. (1918, December 31). La Presse, p. 17. https://collections.banq.qc.ca/ark:/52327/3197763
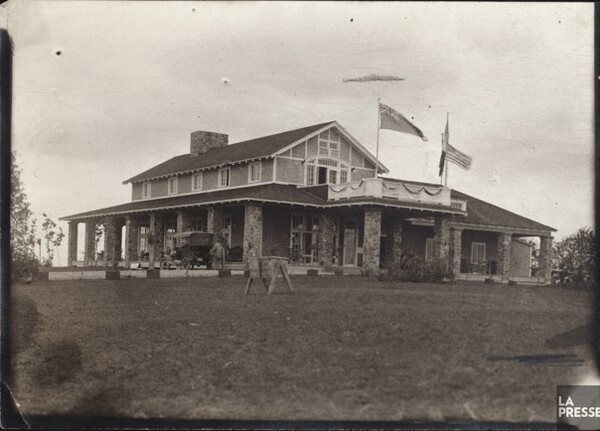
Club de golf Laval-sur-le-Lac, Québec Date :[Vers 192-]-1945.Description :The file focuses on the golf club. Photographs show some of the interior rooms, such as the shower room and smoking room, as well as a view of the course from the front. Detailed Notice :P833,S3,D224 Conservation Location: BAnQ Vieux-Montréal https://advitam.banq.qc.ca/notice/643654
The Laval-sur-le-Lac Golf Club was founded in 1917. A women's committee was created as early as 1919, and Mrs Hector Panneton was elected its president year after year. Between 1918 and 1924, a luxurious and artistically designed chalet (“Les Nôtres et le Golf”, 1918) was built and expanded to accommodate the needs of the members. Electricity and a phone line were installed as early as 1919, and in 1926, the club boasted more than 400 members, 90% of which were francophones . On our 1928 May day, heating would have likely come from the large dining room fireplace, but perhaps some of the ladies were “bundling up chilly” (“Le Voile de la Mariée”, 1928) in their warm furs inside and out. The chalet had provided them with toilets seven years prior, but they would have to wait another three for heating to be installed. (“Laval-sur-le-Lac”, 2002)
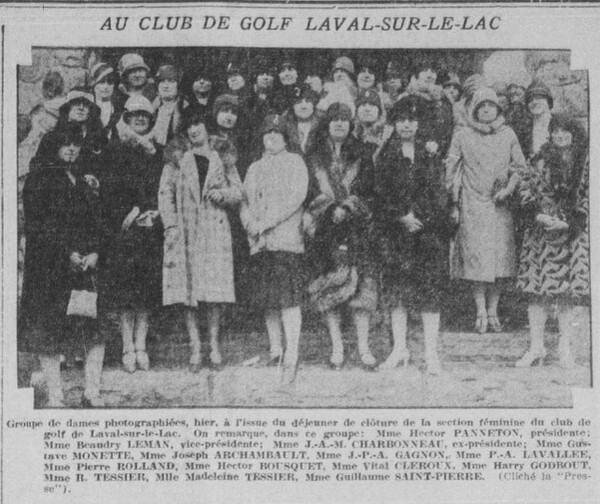
Au Club de Golf Laval-sur-le-Lac, La Presse. September 26, 1928. La Vie Sociale: À Laval-sur-le-Lac. (1928, September 26). La Presse, p. 2-3. https://collections.banq.qc.ca/ark:/52327/2972668
We know little more about this rainy luncheon or of the ladies who braved the cold to attend it, because in 1951, the chalet building burned down, along with its files and documents dating back to the founding of the club (“Laval-sur-le-Lac”, 2002). That is often the way historical records go—not necessarily by fires, but also accidents, neglect, loss, time, etc.—and this is where archives play an important role, in stemming this loss by preserving and caring for what is daily-paperwork-become-historical-information.
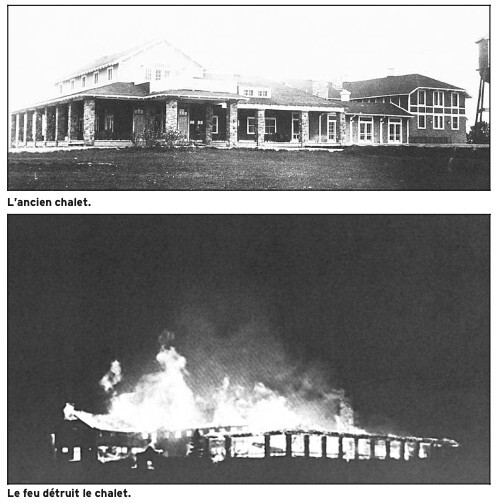
Le Chalet Est Detruit Par Le Feu En 1951, La Presse, 2002 August 9.Laval-sur-le-Lac. (2002, August 9). La Presse, p. Z2-4. https://collections.banq.qc.ca/ark:/52327/2195083
This article is written in the context of the Data Rescue: Archives & Weather (DRAW) project of McGill University (DRAW, 2025). On that day of May 30, 1928, like every other day since 1863 (Park et al., 2018), a (likely) student took weather measurements at 7h45 am, 3 pm, and again at 19h45 pm in a large handwritten ledger. This information was communicated and translated one way or another to The Gazette for publication. These dry numbers come alive when interpreted in the context of daily life captured by this and other newspapers
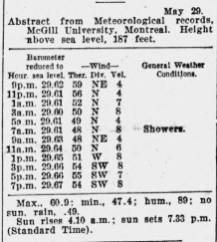
Abstract from Meteorological records, McGill University, Montreal. Weather Report. (1928, May 30). The Gazette, p. 7. https://proxy.library.mcgill.ca/login?url=https://www.proquest.com/newspapers/may-30-1928-page-7-22/docview/2158580457/se-2
At the close of the season, on September 26, 1928, another rainy yet colder day, La Presse returned to Laval-sur-le-Lac’s Golf Club. Once again, the bulk of the article’s length is concerned with describing the fashionable wives bedecked in luxurious fabrics and furs on that occasion (“À Laval-sur-le-Lac”, 1928b). Like in the spring, the autumn weather played an important role in how this day is remembered and preserved.
References:
DRAW: Data Rescue Archives & Weather. (2025). https://draw.geog.mcgill.ca/en/
La Page Féminine: Le Voile de la Mariée. (1928, May 30). Le Devoir, vol. XIX - No. 125, p. 5. https://collections.banq.qc.ca/ark:/52327/2786616
La Vie Sociale: À Laval-sur-le-Lac. (1928, May 30). La Presse, p. 2-3. https://collections.banq.qc.ca/ark:/52327/2972448
La Vie Sociale: À Laval-sur-le-Lac. (1928, September 26). La Presse, p. 2-3. https://collections.banq.qc.ca/ark:/52327/2972668
Laval-sur-le-Lac. (2002, August 9). La Presse, p. Z2-4. https://collections.banq.qc.ca/ark:/52327/2195083
Les Nôtres et le Golf: Le Club Laval-sur-le-Lac. (1918, December 31). La Presse, p. 17. https://collections.banq.qc.ca/ark:/52327/3197763
Park E.G., Burr G., Slonosky V., Sieber R., & Podolsky L. (2018). Data rescue archive weather (DRAW): Preserving the complexity of historical climate data. Journal of Documentation, 74(4), 763–780. https://doi.org/10.1108/JD-10-2017-0150
Weather Report. (1928, May 30). The Gazette, p. 7. https://proxy.library.mcgill.ca/login?url=https://www.proquest.com/newspapers/may-30-1928-page-7-22/docview/2158580457/se-2
Fresh Winds Bring Fresh Change: Convocation 1927
At a temperature of 48 degrees Fahrenheit, the McGill Observatory recorded cool air and a cloudy sky just before 8am on May 27th, 1927. With 16 mph winds that would increase through the afternoon, winds of change could be felt throughout the city. Those attending McGill University’s convocation exercises that morning would have to hold tight to their entry tickets, lest the small card become lost in the breeze. Details of the event to take place in the Capitol Theatre were seen in the Montreal Gazette a few days prior.
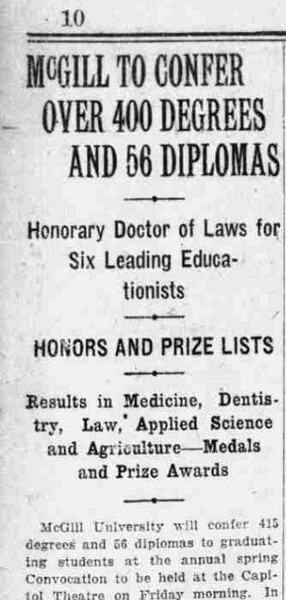
1 May 24, 1927 (Page 10 of 22). (1927, May 24). The Gazette (1867-2014), 123, 10. ProQuest Historical Newspapers: Montreal Gazette. https://www.proquest.com/newspapers/may-24-1927-page-10-22/docview/2158576410/se-2?accountid=8612 Copyright note: Reproduced with permission of copyright owner. Further reproduction prohibited without permission. Published by Postmedia Network Inc.
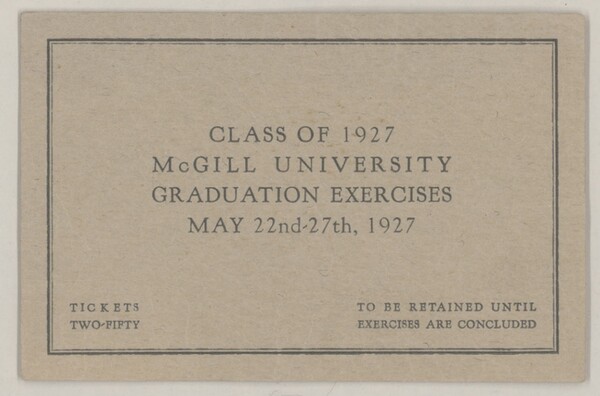
McGill University Archives. (1905, June 9). Convocation ephemera—CA MUA MG 4319-02-087. https://archivalcollections.library.mcgill.ca/index.php/convocation-ephemera
On the way downtown to attend the exercise, one may have had the chance to observe the beginning of significant changes to the Montreal skyline. Construction was in-progress on one of the city’s earliest and largest skyscrapers, the Royal Bank building (Riga, 2020), pictured below. Those present on the construction site that day would have likely felt just a bit more chilled by the wind on an already cool day, perhaps seeking respite as the winds picked up slightly to 20mph speeds as the afternoon progressed
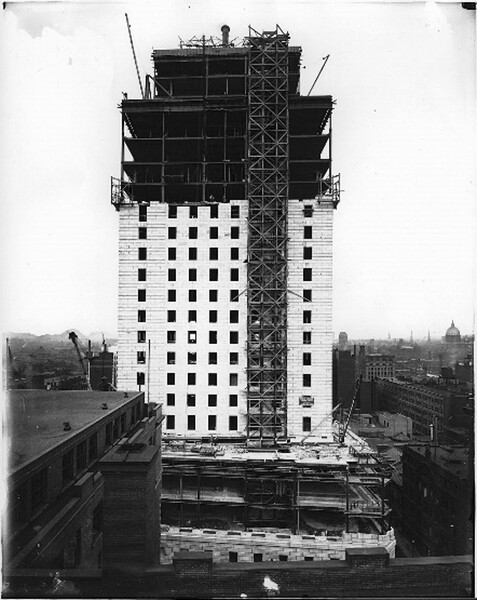
J. Bertram ? (1927). Gelatin silver glass plate negative—Looking West, construction of Royal Bank building, Montreal, Quebec | McCord Museum Collection. https://collections.musee-mccord-stewart.ca/en/objects/152738/vue-en-direction-ouest-construction-de-ledifice-de-la-banq?ctx=b2a413f1fda156bbecbcff11c087b5512352f6b0&idx=0 Copyright note: Public Domain
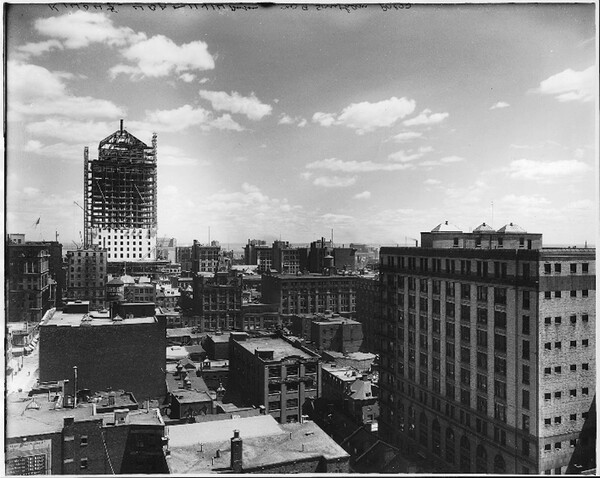
Wm. Notman & Son Ltd. (1927). Gelatin silver glass plate negative—Montreal looking south from Southam Press Building, QC | McCord Museum Collection. https://collections.musee-mccord-stewart.ca/en/objects/111761/vue-de-montreal-en-direction-sud-depuis-limmeuble-de-la-sou?ctx=1e1fa431961e7b3e9b192fa8c9fe8f61b83e63eb&idx=1 Copyright note: Public Domain
As their city began a new phase of transformation, residents of the city would need to adjust to a new kind of urban environment that skyscrapers would bring. Some students at McGill gave the impression of being quite ready for this type of change. One such student is pictured below, studying for her finals that year on the fire escape of the Royal Victoria College residences.
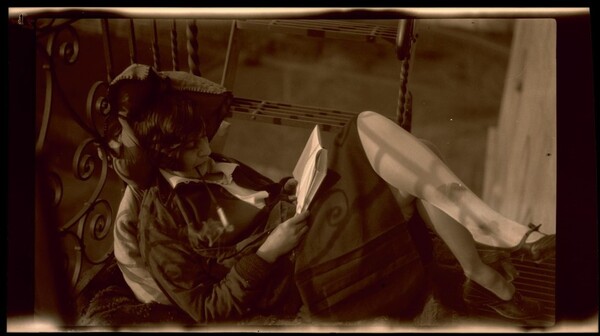
McGill University Archives. (1927). PN038162 | Student studying for final exams on fire escape, Royal Victoria College, 1927.
Regardless of what study habits brought them there, graduating students, once downtown, made their way to the Capitol Theatre, a few blocks from the Royal Bank building construction site, for the graduation exercises. Were you present in the theatre, you may have seen your peer John Peters Humphrey obtaining his Bachelor of Arts. (McGill University, 2025a) A figure important in changes to come, Humphrey would later become a Professor of Law at McGill University, the first director of the Human Rights Division of the United Nations and author of the first draft of the United Nations Universal Declaration of Human Rights. (Canadian Commission for UNESCO, 2023) In December of 2023, the John Peters Humphrey Fonds was included in the Canada Memory of the World Register, an archiving containing items such as his first handwritten draft. Humphrey obtained several degrees at McGill, receiving his BCL a few years later in 1929. He is visible below, standing in the 1928 Mock Parliament yearbook photo.
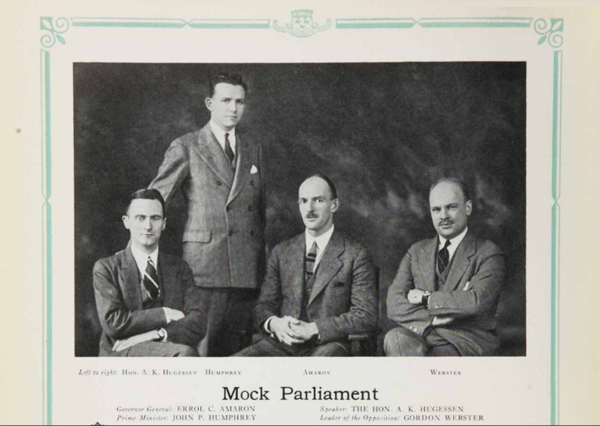
Mock Parliament. (1928). In Student’s Society of McGill University, Old McGill 1928 (p. 230). https://yearbooks.mcgill.ca/viewbook.php?&campus=downtown&book_id=1928#page/234/mode/1up
Regarding the archives, we see yet more change, this time within McGill. Beginning as the first formal library education program in the country in 1904, the 1927 summer session following convocation would be its first as library studies course meeting the "Minimum Standards for Summer Courses in Library Science"(McGill University, 2025c). Evolving over the next century, the winds of change in ’27 lead us here now, recounting the day and feeling its breeze as recorded by those in the observatory. Seen below is the reported interest in the course, and an early group picture of the McGill Library Science Staff at the time.
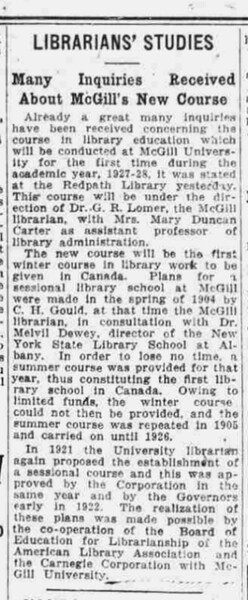
June 25, 1927 (Page 2 of 28). (1927, June 25). The Gazette (1867-2014), 151, 2. ProQuest Historical Newspapers: Montreal Gazette. https://www.proquest.com/newspapers/june-25-1927-page-2-28/docview/2158568428/se-2?accountid=8612 Copyright note: Reproduced with permission of copyright owner. Further reproduction prohibited without permission. Published by Postmedia Network Inc.
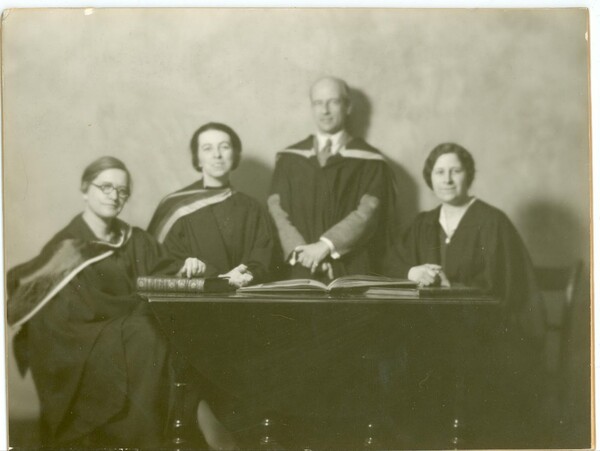
McGill University Archives. (1928, c). PR001269 | McGill Library Science Staff
As the DRAW archives remind us however, change comes at different speeds. The temperature would remain cool throughout the rest of May 27th, with the slightly faster, fresher winds blowing northeast. Despite this persistent wind, we get the impression of a successful traditional post-exercise afternoon McGill Garden Party. As the below record of their correspondence shows, just as in the year prior Principal Currie (McGill University, 2025b) arranged the Band of the Royal Montreal Regiment to supply the afternoon’s music for graduating students.
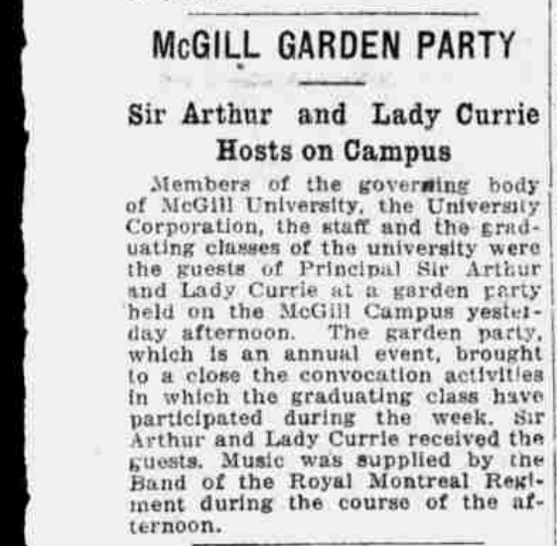
May 28, 1927 (Page 9 of 28). (1927, May 28). The Gazette (1867-2014), 127, 9. ProQuest Historical Newspapers: Montreal Gazette. https://www.proquest.com/newspapers/may-28-1927-page-9/docview/2158597166/se-2?accountid=8612 Copyright note: Reproduced with permission of copyright owner. Further reproduction prohibited without permission. Published by Postmedia Network Inc.
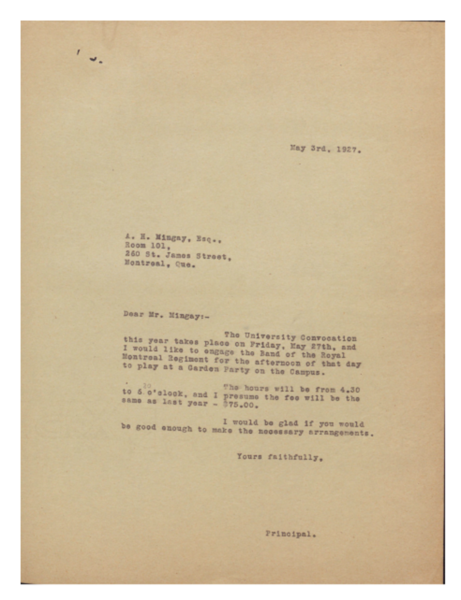
McGill University Archives. (1925-1934). FILE 736 CONVOCATION 1925—1934. https://archivalcollections.library.mcgill.ca/index.php/convocation
By transcribing this weather data through DRAW, the efforts of volunteers allow us to paint a picture of the past. Be it the cool winds of celebrations past, or weather trends observed over decades, the project provides details of events that flesh out the history of our institution. Through this we can better situate ourselves in relation to the graduating students of 1927, who saw overcast skies and a glimpse of change to come. Maybe this can provide a useful perspective for the graduating students of today, who can choose to look to the past to inform their future.
The McGill Conservatorium Orchestra in 1934: The Students Behind the Music
On October 6th, 1934, McGill held its annual Fall convocation ceremony. According to observations made at the McGill Observatory on October 6th, 1934, the weather was cloudy and cool, in the low 50s, with rain between 10:10 am and 6:15 pm (DRAW Meteorological Service of Canada, Oct. 6, 1934). Similarly, the Montreal Gazette’s forecast for the day predicted mild and cloudy conditions, with scattered showers (Montreal Gazette, October 6, 1934). To commemorate the 190th birthday of the university’s founder, the Canadian Grenadier Guards were to mount guard at James McGill’s tomb after the convocation ceremony at five o’clock (Montreal Gazette, October 6, 1934). However, this event was cancelled due to “heavy downpour” (McGill Daily, Oct. 9, 1934, p. 1).
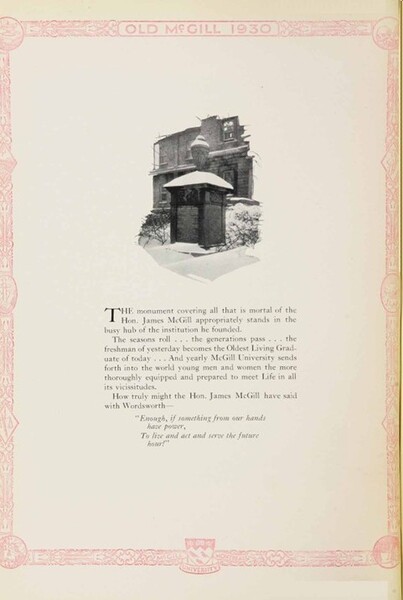
[image of James McGill’s tomb, McGill Yearbook, 1930, https://yearbooks.mcgill.ca/viewbook.php?campus=downtown&book_id=1930#mode/2up]
As the Gazette reported the morning of convocation, “Music will be provided by the orchestra of the McGill conservatorium of music, under the direction of Prof. R. de H. Tupper” (Montreal Gazette, October 6, 1934, p. 4). During this time, Professor Reginald de Havilland Tupper had been bolstering the Conservatorium Concert Orchestra’s notoriety, making public appearances and performing in a radio broadcast in 1933 (McGill yearbook, 1934, p. 150).
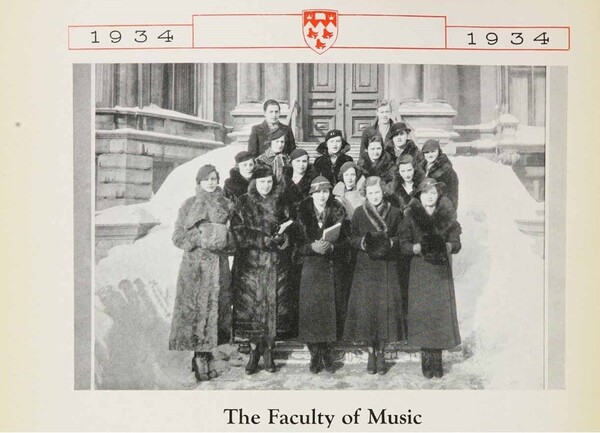
[image of the Faculty of Music, McGill Yearbook, 1934, https://yearbooks.mcgill.ca/viewbook.php?campus=downtown&book_id=1934#mode/2up]
The previous October, the Dean of the Faculty of Music, Douglas Clarke, marked the opening of the season with a speech which, according to the 1934 yearbook, “emphasized the value of studying music for the love of it alone. He related how this appreciation of the Art was recently demonstrated, when thousands of Londoners, on a terrifically warm night in August, filled the Albert Hall, and hundreds stood through an entire performance, scarcely daring to breathe lest they miss one note of the glorious works of Bach, Beethoven and Brahms” (McGill Yearbook, 1934, p. 150).
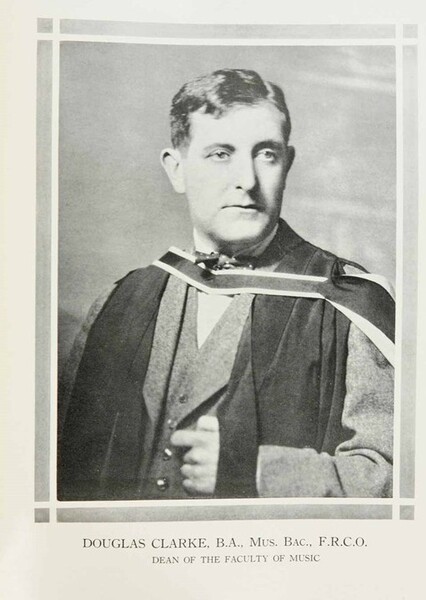
[image of Dean Clarke, McGill Yearbook, 1934, https://yearbooks.mcgill.ca/viewbook.php?campus=downtown&book_id=1934#mode/2up]
Members of the Conservatorium Orchestra made up part of the Musical Association at McGill, while other members came from the Band, the Glee Club, and the Operatic and Choral Society. This club held events such as the Musical Association concert, and 1934 marked the first year in which admission was charged (McGill Yearbook, 1934, page 242).
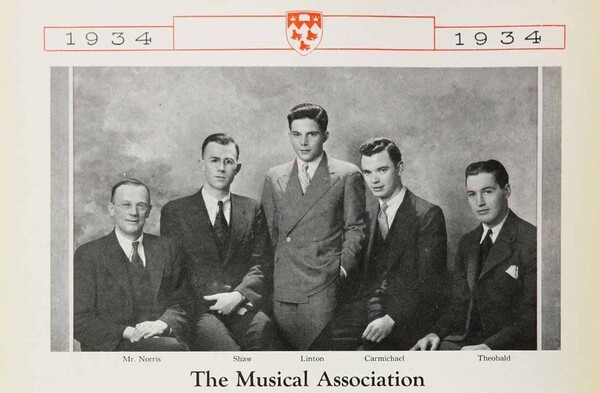
[image of the Musical Association, McGill Yearbook, 1934, https://yearbooks.mcgill.ca/viewbook.php?campus=downtown&book_id=1934#mode/2up]
The Royal Victoria College Music Club met in the R.V.C. Common Room once a month to listen to and learn about music. In a lecture held by the club, the women listened to Brahms’ symphonies on a phonograph. One guest performance saw Marguerite Dorken and Eleanor Hamilton performing Lehman’s arrangements of two Oscar Wilde poems, “The Happy Prince” and “The Selfish Giant.” For the first time, in 1934, a musical performance was undertaken by club members themselves— a group of students who had recently begun studying choral works (McGill Yearbook, 1934, pg. 83).
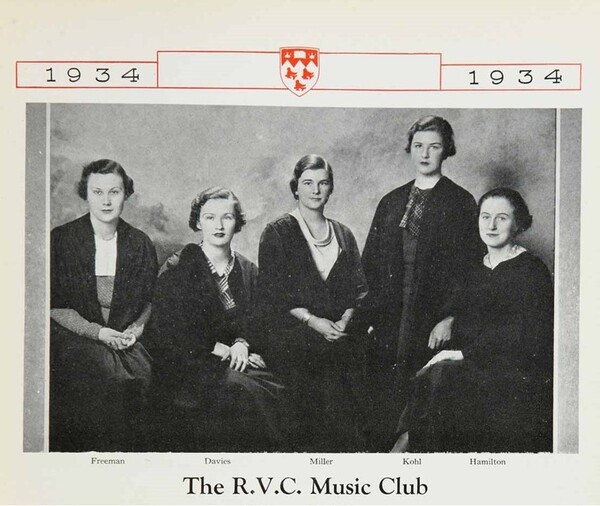
[image of the R.V.C. Music Club, McGill Yearbook, 1934, https://yearbooks.mcgill.ca/viewbook.php?campus=downtown&book_id=1934#mode/2up]
One of the graduates receiving a Licentiate from the Faculty of Music in 1934 was Marguerita Spencer (McGill Daily, Oct. 5, 1934). She was born on December 28, 1892 in Glace Bay, Nova Scotia, and was educated at the Academy of Music Lady’s College in Halifax before studying at McGill. Spencer performed with the Saskatoon Symphony, appeared on CBC radio, and many of her compositions were published most notably her piano solo Prairie Suite No. 1 (1953) (University of Saskatchewan Archives, Marguerita Spencer fonds, MG 104).
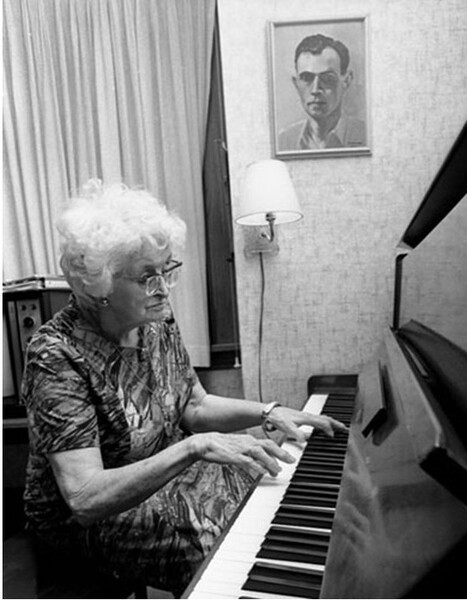
[image of Marguerita Spencer (1977), City of Saskatoon Archives, Saskatoon StarPhoenix fonds, S-SP-A7669-1]
Dr. Boycott: Special guest for the inauguration of McGill´s pathological building
The Montreal Canadiens enjoyed a successful season in 1923, achieving a second-place finish in the standings, though they did not secure the trophy that year. 1924 appeared to be an even more auspicious year. The month of October was dedicated to preparation and training prior to the commencement of the hockey season, which had strong expectations
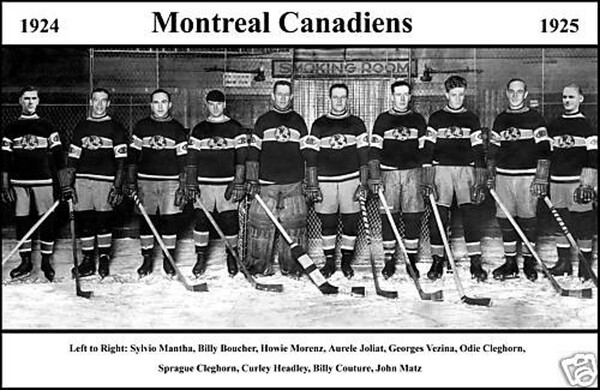
Public domain photograph of the Montreal Canadiens. See 1924–25 Montreal Canadiens season | Ice Hockey Wiki | Fandom
Beside talking about Hockey, in Montreal the month of October 1924 is typically cool and transitional, with precipitation being more prevalent than snowfall. On the other hand, it is the peak of the autumn foliage season in Montreal, when the leaves of the trees are rendered in vibrant and distinctive colours.
The headline on the first page of the McGill Daily of Tuesday, October 7th, 1924, employs clear and bold test to read: “Hon[orary]. LL.D. (from the Latin “Legum Doctor”) for Prof[essor] Boycott at Convocation | Pathological Institute Officially Opened by Lieut-Governor”
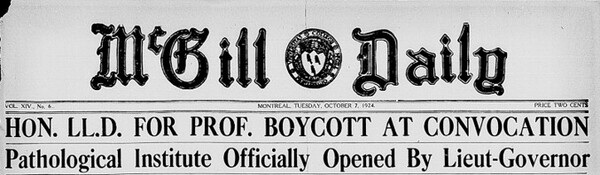
(1924, October 6). New Pathological Institution Formally Declared Open by Lieut. Governor of Quebec. McGill Daily, Vol. XIV., No. 6, 1.
An overview of Dr. Arthur Edwin Boycott's life (1877-1938) shows his many contributions to pathology, the study of disease, and natural history. Boycott studied classical subjects at Oxford University and then Natural Sciences (Physiology) at first-class level. His academic prowess earned him prestigious positions as a professor at Manchester University and University College, London. Boycott's scholarly contributions included seminal work on blood as a tissue, particularly its capacity to restore blood volume and composition. He was also an accomplished editor of the Journal of Pathology.
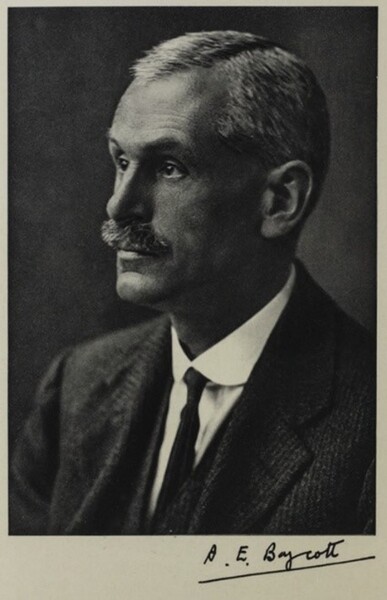
Photograph of Dr. Arthur Edwin Boycott. See Martin, C. J. (1939). “Obituary Notices of Fellows of the Royal Society.” Royal Society, 2(7), 560-572.
The long and detailed article published on the McGill Daily, narrates how Dr. Boycott, Graham Professor of Pathology at the University of London, delivered the inaugural address on Monday, October 6th, 1924, at the ceremony that was witnessed by the distinguished gathering during the inauguration of McGill's new Pathological Institute as part of the renovation of the Faculty of Medicine.
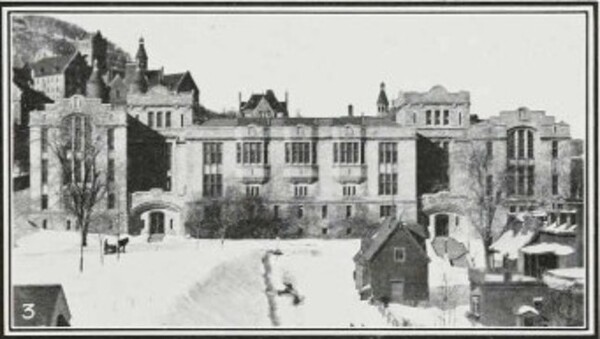
The new Medical Building (in 1926) of McGill.See McGill Yearbooks. (1926). P. 139.
The Prime Minister of Quebec extended his heartfelt congratulations and best wishes for the future success and progress of the department. Dr. Boycott's address encompassed his observations on the contributions of McGill University faculty members in the domain of pathological study, while also highlighting the architectural merits of the newly constructed institute designed by Percy Erskine Nobbs.
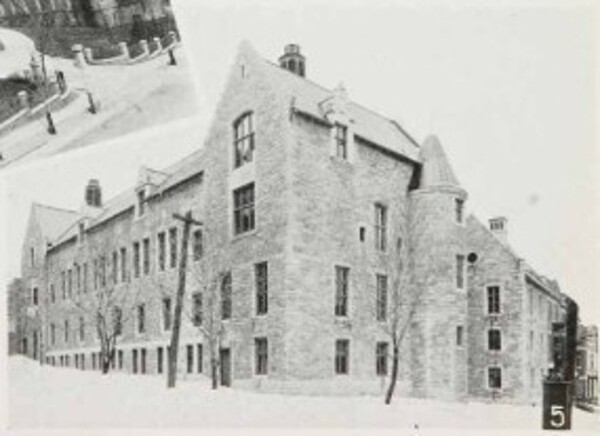
The Pathological Institute as part of the buildings connected with the Medical Faculty of McGill. See McGill Yearbooks. (1926). P. 139.
The construction of the Pathological Institute was the outcome of a donation of one million dollars from the Rockefeller Foundation. This donation was made with the intention of facilitating medical education and research at McGill. The building is somewhat irregular in shape, extending its greatest length along University Street, a few feet from Pine Avenue (the Department of Pathology is now part of the biomedical and hospital research centre situated on 1001 Decarie Boulevard).

RI-MUHC Glen (currently), the Research Institute of the McGill University Health Center. Photo taken from Main Research Sites | Department of Pathology - McGill University
Continuing with the accounts from 1924, Dr. Boycott defined pathology and gave its historical development. He said that medical components of pathology have been adequately addressed, and that further progress is required from a different perspective. Dr. Boycott emphasised the necessity for greater autonomy in studying pathology. He said that pathology is a scientific discipline that can thrive independently.
In accordance with the significance of the event, the ceremonies were held during the afternoon of October 6th. In attendance at the event were guests from the afternoon, who congregated in front of the Redpath Museum on the grounds of McGill University. Attendees were attired in academic gowns and caps and proceeded in a procession to the new building on Pine Avenue. The route taken by the procession included McTavish Street, Pine Avenue, and University Street. A significant number of individuals also took up a position outside the Royal Victoria Hospital, opposite the entrance to the Pathological Institute.
Precise meteorological data is typically available at the time of this Convocation. The Data Rescue: Archives and Weather (DRAW) project provides information that at approximately 3 p.m. on Monday, October 6th, 1924, the following conditions prevailed. Despite early morning precipitation, the afternoon was characterised by overcast conditions, with northwest winds reaching speeds of 21 mph and the presence of transparent high clouds, known as cirrostratus clouds, which enveloped significant portions of the sky. The overall temperature was relatively warm for the month of October, with a decline as the day progressed. And maybe, this was a premonition of the something to happen, like the Canadiens winning their second Stanley Cup.
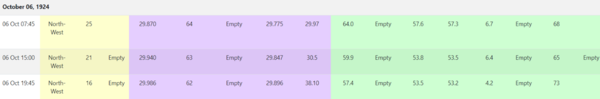
First part of the weather report that took place on Monday, October 6th, 1924, in Montreal according to the Data Rescue: Archives and Weather (DRAW). McGill DRAW: Transcription number: 7519, titles pages 1924-10-05 to 1924-10-11. DRAW: Data Rescue Archives & Weather
Appendix
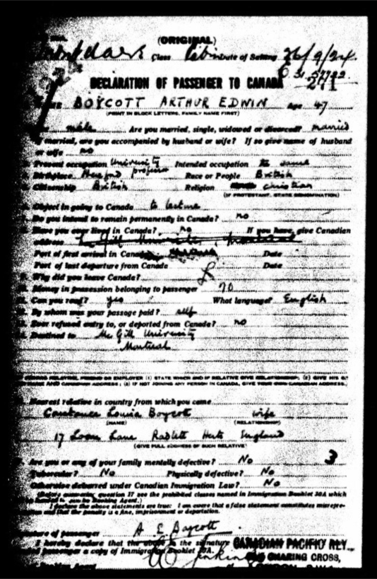
Arthur Edwin Boycott´s Declaration of Passenger to Canada arrival dated in 1924.Link: Canada, Ocean Arrivals (Form 30A), 1919-1924 - AncestryLibrary.ca
On this day today...
Thank you for visiting our daily blog, where we share events from McGill University’s history which happened on the same day as today!
So, on June 11th, 1923, it was yet another important event in every student’s academic life: the convocation ceremony! This event marks the end of a stage in the students’ academic progress, and it is meant to be a big celebration; a proud moment to be shared with family and friends. While weather conditions might not be everyone’s biggest concern, they are important during convocation. Poor weather can cut the celebrations short, get the gowns wet, and dampen the mood!
However, bad weather was not the case on June 11th, 1923. As we can see in the weather observations taken at the McGill Observatory (which were taken frequently, several times per day), the skies were clear with no clouds in sight and no chance of precipitation.
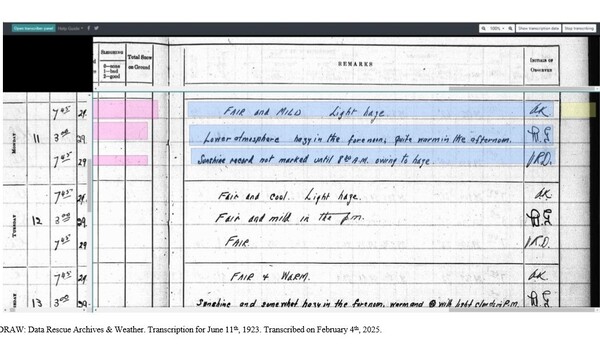
The morning started off quite humid, with humidity readings at 76%, but these levels steadily decreased to less than half by 3PM and by 7:45PM, namely 35% and 32%, respectively.
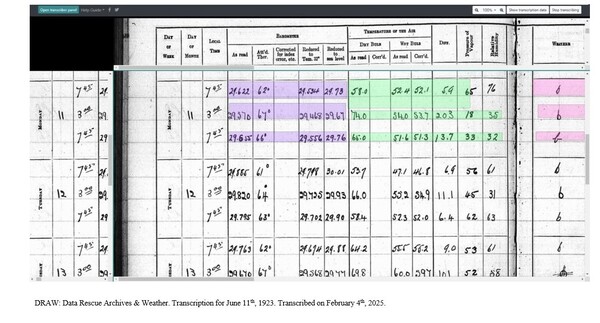
According to the recorders’ notes, they have recorded that the day was hazy, making it difficult to record the levels of sunshine up until 8:30 AM, but despite the hazy morning (or, using the terminology as it has been recorded, “fore noon”), the day became quite warm in the afternoon. The temperatures were mild (73 degrees at 3 PM), and the wind was nothing more than a breeze, blowing from West-North-West direction at maximum 18 miles per hour
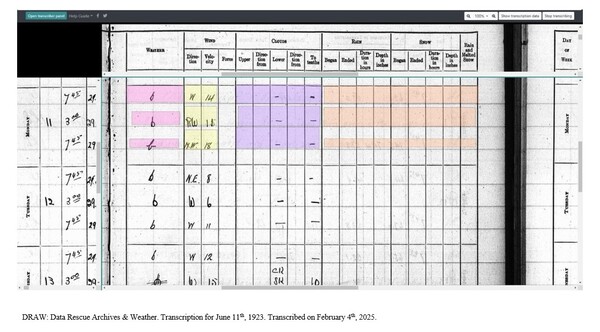
Atmospheric pressure was acceptable, according to the barometric readings, revolving around the value of 29.5-29.6 Hg
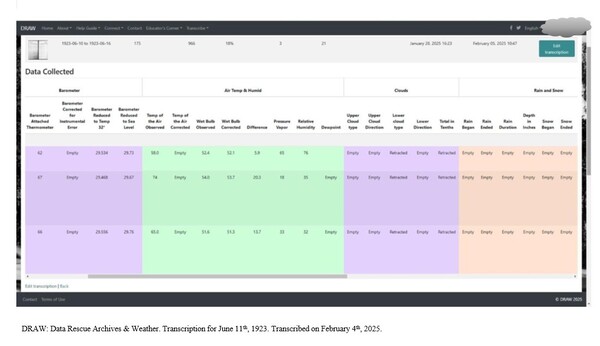
Given these values, we are sure that the convocation ceremonies were fun and enjoyable! There is photographic proof that the graduating students and their guests enjoyed the outdoors on this beautiful day, as we can see in the photo from the McGill University Archives, depicting the Convocation procession unfolding on campus.
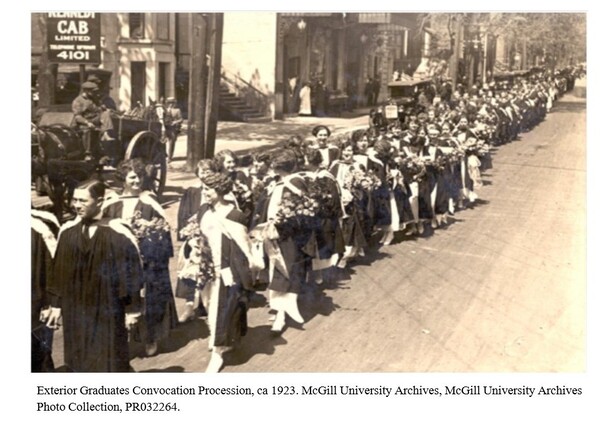
Additionally, we know that great people graduated that day. Frank Randolph Macpherson graduated on this day, 102 years ago, from his program, BA in Chemical Engineering (1923 Yearbook, n.d.). Born in Kingston, Jamaica, he was one of the first Black students to graduate from McGill University. At the university, he was a staff member of the McGill Daily newspaper, and was involved in several clubs, including being an executive of the Chess Club and treasurer of the Cosmopolitan Club. We are not sure what the latter is exactly, but it does sound fun!
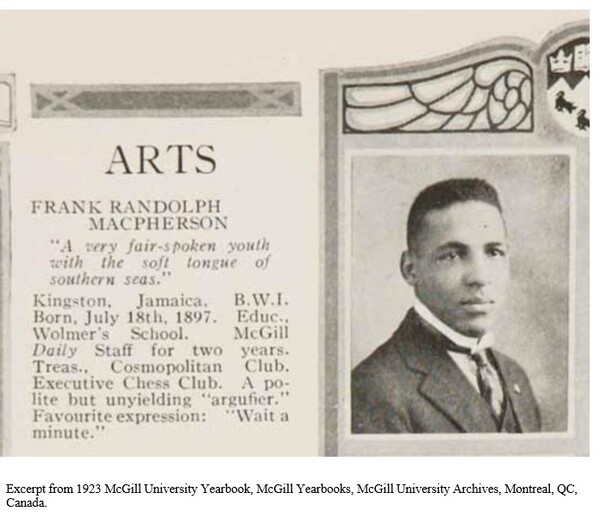
Macpherson, an avid jazz music enthusiast, made his career at a pulp and paper company. He is known for befriending and inspiring jazz musician Felix Leclerc, who named a song in the honor of his friend (National Film Board of Canada, n.d.). Macpherson is an important Quebec cultural figure. Thus, a short, animated film commemorating his life and legacy was made in 2012 by Martine Chartrand at the National Film Board of Canada. This film also contributes to Canadian cultural diversity and multiculturalism by promoting Canadians of Caribbean, Central and Southern American origins (NFB Collection, n.d.).
Thank you for reading this article, we hope that you enjoyed it! As always, we hope that it has sparked your curiosity to learn more about the events and the great people who have contributed to the rich history of McGill University.
References
DRAW: Data Rescue Archives & Weather. (2025). https://draw.geog.mcgill.ca/en/
MacPherson (n.d.). National Film Board of Canada. https://www.nfb.ca/film/macpherson_en/
MacPherson (n.d.). NFB Collection. https://collection.nfb.ca/film/macpherson_fr-en
Exterior Graduates Convocation Procession. (ca. 1923). McGill University Archives Photo Collection, PR032264, McGill University Archives, Montreal, QC, Canada
1923 Yearbook (n.d.). McGill Yearbooks. https://yearbooks.mcgill.ca/viewbook.php?campus=downtown&book_id=1923#mode/2up
Dresses, Drizzles and Depression
On May 26, 1932, 504 graduates gathered at McGill University’s convocation to celebrate their academic achievements. At 7:40 AM, a misty rain lingered over the city, soaking the streets as graduates fastened their gowns and adjusted their caps. As they processed across the grounds, women carried both bouquets and degrees, their legs, clad in silk hosiery, peeking out from beneath their robes. The soft click of white high-heeled Mary Jane shoes against the wet pavement marked their transition from student life to a world that expected them to marry and mother. Though they had persevered in an institution that acknowledged their presence but failed to respect their contributions, they now stepped into a society struggling with the instability of the Great Depression.
“These are changed times. We are learning that the forward move of civilization may not necessarily be surely accelerated by wild upward swings of economic development.” E. W. Beatty
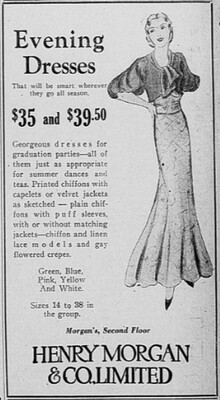
Simple Company Presentation. The McGill 1932 Daily advertising luxury products like clothing, cigarettes and alcohol during a historical recession highlights values and aspirations.
By 10 AM, the ceremony began under an unsettled sky, the warm, damp air pressing against heavy academic robes. Despite the economic turmoil of the Great Depression, McGill’s female graduates adhered to societal expectations, arriving at convocation in meticulously chosen outfits, navigating around puddles. The contrast was striking—men, dressed in trousers and flat shoes, walked unencumbered, while women balanced beauty with accomplishment. Even on a day meant to commemorate their academic success, their appearance was as much a part of the ceremony as their degrees.
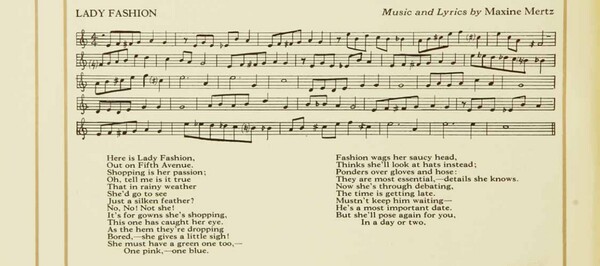
Sheet music and lyrics for song by Maxine Mertz “Lady Fashion” Old McGill 1932 Yearbook. (1932). Students’ Society of McGill University. https://yearbooks.mcgill.ca/viewbook.php?campus=downtown&book_id=1932#mode/2up
"Lady Fashion," a song from the Red and White Revue, captures the conflict women faced in balancing societal expectations with personal expression. The song tells of a woman braving the rain to shop, determined to maintain her appearance despite external challenges. Nearly a century later, this tension between self-expression and societal pressure mirrors the experience of McGill’s female graduates on convocation day. While the song focuses on shopping, it symbolizes broader cultural pressures—women were valued more for their appearance and behavior than for their intellect. Much like the woman in "Lady Fashion," McGill’s graduates were forced to navigate these constraints, balancing expectations of beauty with their academic accomplishments.
The 1932 yearbook captured both the ambition of female students and the dismissive attitudes they faced. While some female writers expressed confidence and academic pride, others sought to belittle or exclude them from the scholarly and economic experience. Take, for instance, this passage from "College Ages" by W.W.W.
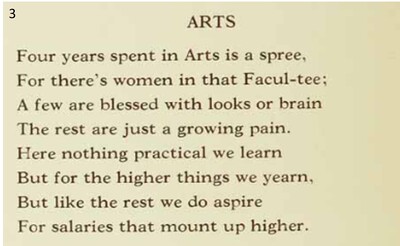
Excerpt from “College Ages,” a poem in the 1932 McGill University yearbook by satirist W.W.W. Old McGill 1932 Yearbook. (1932). Students’ Society of McGill University. https://yearbooks.mcgill.ca/viewbook.php?campus=downtown&book_id=1932#mode/2up
This verse trivializes the experiences of women at McGill, reducing them to superficial qualities and suggesting their presence in the Faculty of Arts was a nuisance. Though intended as satire, the jokes were at the expense of women, reinforcing a narrative that didn’t align with their lived realities. As women of McGill today, just months away from our own convocation, it’s hard not to reflect on how far we’ve come—and how much further we still need to go. Reading the disheartening writings of 1932 men, particularly in light of our own upcoming graduations, serves as a stark reminder of the women who came before us. Yet, we can draw inspiration from their resilience and wit, evident in the ways women spoke about themselves. Biographies written by female graduates provide insight into their personalities, humor, and aspirations
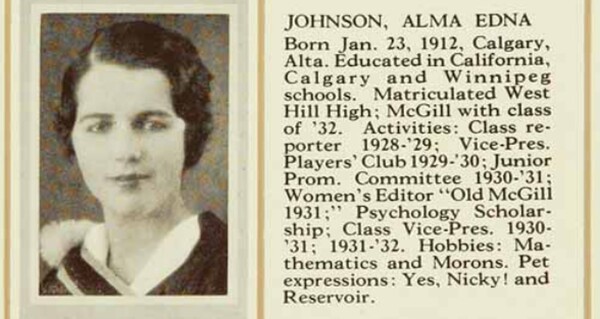
Alma Edna Johnson, 1932 graduate of RVC. Alma’s hobbies include Mathematics and morons, perhaps hinting at direct interactions with W.W.W. Old McGill 1932 Yearbook. (1932). Students’ Society of McGill University. https://yearbooks.mcgill.ca/viewbook.php?campus=downtown&book_id=1932#mode/2up
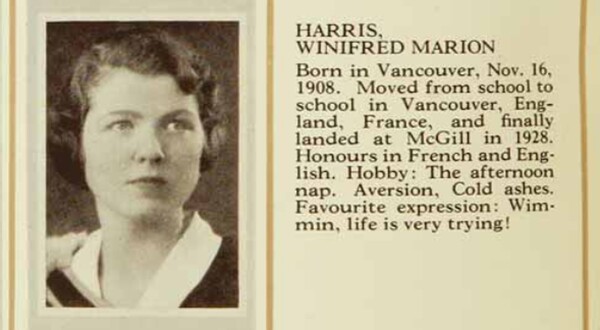
Winifred Marion Harris, 1932 graduate of RVC. Old McGill 1932 Yearbook. (1932). Students’ Society of McGill University. https://yearbooks.mcgill.ca/viewbook.php?campus=downtown&book_id=1932#mode/2up
“Favourite expression: Wimmin, life is very trying.” "Wimmin" is an alternative spelling of "women" often used in feminist writing to challenge the perceived sexism in the traditional spelling, which includes "men." This spelling aims to avoid reinforcing gender hierarchies and emphasize a more inclusive, women-centered language.
By 7:40 PM, as light rain returned and the sky remained overcast, McGill’s female graduates stepped into a world still burdened by societal expectations sharply contrasted with those of their male counterparts. While men were encouraged to broaden their horizons and avoid becoming specialists, women were incessantly reminded of their prescribed roles as homemakers, wives, and mothers. As Susan E. Vaughan, Honorary President and permanent class executive, noted in her yearbook contribution, "Random thoughts of Women and their Education":
“Since technical and professional types of education have become highly specialized, young men have been incessantly urged not to allow themselves to be mere specialists [...]. In the case of women, the trend of argument is the other way. The girl is constantly reminded that her profession is that of home maker, wife and mother, and she is urged to make herself a narrow technician from the beginning to the end of her education."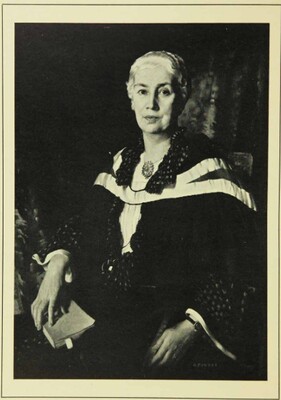
Susan E. Vaughan AKA: Susan E. Cameron, Retired in 1937 as Warden of R.V.C. College. Old McGill 1937 Yearbook. (1937). Students’ Society of McGill University. https://yearbooks.mcgill.ca/viewbook.php?campus=downtown&book_id=1937#mode/2up
This societal narrative confined women's ambitions, reducing their education to preparation for domestic roles rather than professional careers. Despite their academic achievements, McGill's female graduates, like many women of the time, discovered that their degrees were insufficient protection against the pressure to prioritize family life over personal or professional aspirations.
The Sun Rises and Falls on McGill Leaders
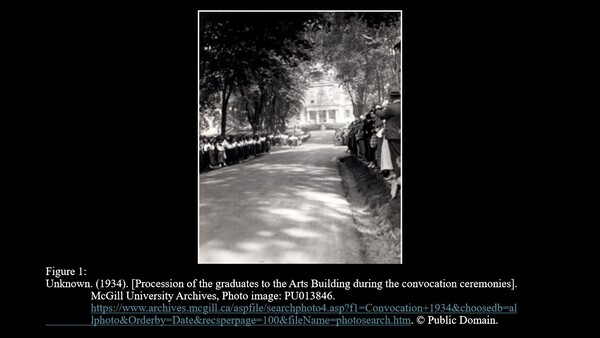
While the morning of May 29th, 1934, was sunny and warm, with only a light breeze that continued throughout the day, the evening foresaw the appearance of some Stratocumulus clouds that entailed “a few scattered traces of rain” (McGill Draw transcription). This shift towards rain perhaps representing the hint of sadness that prevailed over the Convocation ceremony during that day, due to the sudden death of their Principal and Vice-Chancellor, Arthur Currie, only a few months prior (Waters, 2011, p. 10).
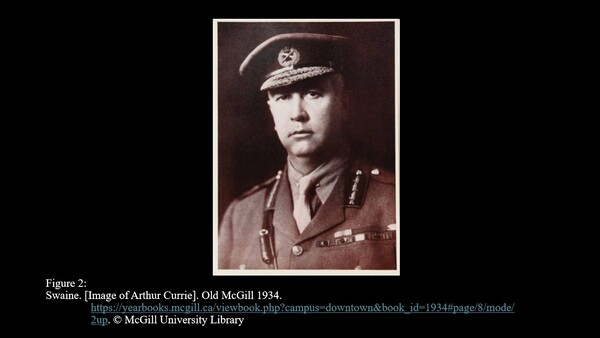
Currie’s appointment as McGill’s eighth Principal and Vice Chancellor in 1919 “surprised everyone” as he boasted very few academic qualifications, aside from a high school diploma and “a few years as a schoolteacher in Victoria B.C.”. (Waters, 2011, p. 10). However, picking a “national hero” through being the “first Canadian to lead a Canadian army into battle” and into “several victories”, was an excellent choice as 13 years in office led to the construction and renovation of new buildings, the addition of new departments, the increase in size of the student body (both undergraduate and graduate), and the creation of the “Montreal Neurological Institute (MNI)” alongside Wilder Penfield (Hyatt et al., 2018, p. 367; Old McGill 1934, 1934, pp. 10; Waters, 2011, p. 10). A “born organizer and administrator”, Currie led McGill with “an energy and enthusiasm that remained undimmed” during his years of Presidency, as in the beginning when he led a campaign to raise funds for McGill’s war-time depleted resources, that raised $6, 200, 000 (around $139,006,004.61 today) (Old McGill 1934, 1934, pp. 10, 371). However, not everyone held him in such high regards, as “charges that he’d squandered Canadian lives on the battlefield” plagued him after the war, increasing with fervour in 1928 (Waters, 2011, p. 10). Although Currie won his lawsuit against “his tormentors” for libel, the court proceedings and years of criticism drained him, and “even after a year’s sick leave”, Currie remained a shell of his old self until his death on November 30, 1933, aged 57 (Hyatt et al., 2018, p. 369; Waters, 2011, p. 10).
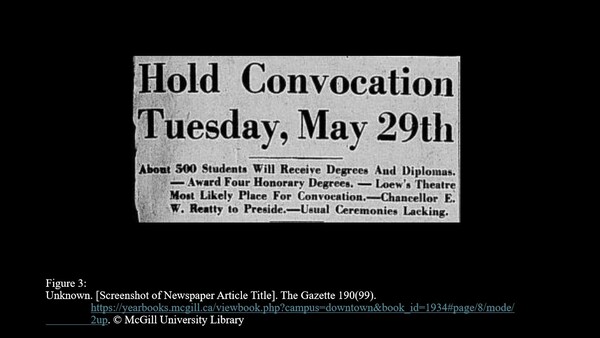
During the Convocation ceremony, the students participated in a moment of silence “as a mark of respect to” Arthur Currie, before the bulk of the joyful proceedings (“Hold Convocation” 1934, p. 1). The weather seemed to almost do the opposite, with the “traces of rain” occurring in the evening preceding the “probable thundershowers”, although, the high humidity of around 63 lingered heavy over the graduates all day, like a steady reminder of the sadness in the air (McGill Draw transcription, The Gazette, 1934, p.1). However, the sun shone bright the morning, with a high of 27 C and a low of 14 C, as if to remind those at Convocation of the joy to be found in the remarkable men that still lived, including the man who spoke the Convocation address, Chancellor Edward Beatty (Distinguished Names, 1934, p. 6).
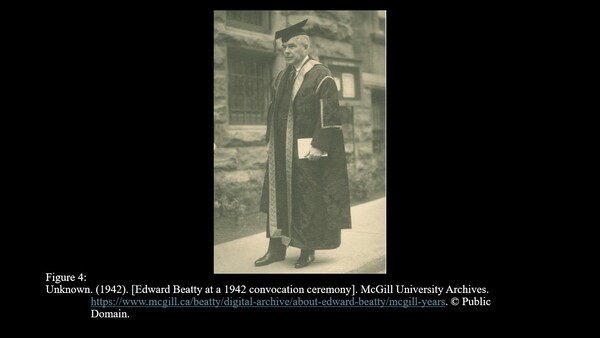
Beatty had been elected Chancellor in 1920, and in 1934 was the president of the Canadian Pacific Railway, meaning “he was running the world’s largest transportation system” in-between Convocation addresses (Hoff, 2019). In his 1934 address he remarked to the graduates, “that [they] will know that success is but another name for happiness and that happiness lies within the reach of every human being”, as it seemed to lie with him in his work as Chancellor, through his close relationship to the students, and his steady leadership over McGill as Acting President from 1933 to 1940, in the soon-to come Great Depression years (McGill Years; Waters, 2011, p. 10). A “pragmatic, sometimes ruthless corporate executive”, Beatty, as Acting President, made some “tough decisions about budget cuts and fee increases”, but was also able to “rally the support McGill needed to survive”, similarly to Currie in his first few years in office (Waters, 2011, p. 11). Both Beatty and Currie are honoured at McGill in various ways, specifically through the Beatty Lecture series, started in 1954 that is the “oldest public lecture series of its kind” in Canada that “[brings] international figures to the University”, including figures such as Margaret Atwood and Jane Goodall, and the Sir Arthur Currie Memorial Gymnasium, that Beatty constructed in his honour (Hoff, 2019; McGill Years).
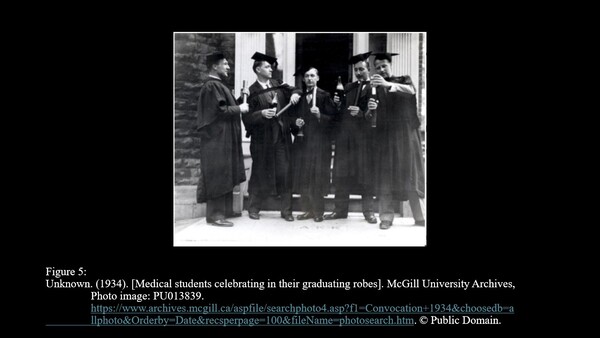
References
Five Distinguished Names to Enrich McGill’s Honors Roll. (1934, May 29). The Gazette, 190(128), p. 6.
Hoff, Becca. (September 2019). Celebrating 65 years of the Beatty Lecture. McGill News. https://mcgillnews.mcgill.ca/celebrating-65-years-of-the-beatty-lecture/
Hold Convocation Tuesday, May 29th. (1934, April 20). The McGill Daily, 23(99), pp. 1, 8. https://archive.org/details/McGillLibrary-mcgill-daily-v23-n099-april-22-1934-8350/mode/2up
https://news.google.com/newspapers?nid=Fr8DH2VBP9sC&dat=19340529&printsec=frontpage&hl=en.
Hyatt, Jack, Beckett, Andrew, and McAlister, Vivian (2018). After the war is over: the role of General Sir Arthur Currie in the development of academic medicine in Canada. Canadian journal of surgery. Journal canadien de chirurgie, 61(6), 367–369. https://doi.org/10.1503/cjs.017118.
McGill Draw transcription number 7511 with page title 1934-05-27 to 1934-06-02
McGill Years. McGill. Retrieved January 29, 2025, from https://www.mcgill.ca/beatty/digital-archive/about-edward-beatty/mcgill-years
Old McGill 1934 (vol. 37) (1934). McGill University. https://yearbooks.mcgill.ca/viewbook.php?campus=downtown&book_id=1934#mode/2up.
Waters, Paul. (2011, October 14). Between the wars: hard times and turmoil. McGill Reporter, 44(4), pp. 10-11. https://reporter.mcgill.ca/wp-content/uploads/2011/10/HISTORY-ISSUE.pdf.
Rain on their parade: McGill’s 1932 convocation was a washout
Graduates braved a downpour on October 6, 1932, marking one of the rainiest days of the year. As Principal Sir Arthur Currie delivered his address, history was unfolding both inside and outside the hall.
October 6, 1932, was not a picture-perfect day for convocation. McGill University graduates and faculty in the procession on McGill College Ave. carried umbrellas to protect themselves from the downpour.
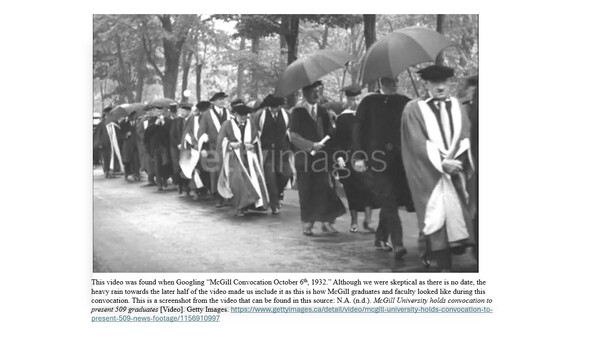
As convocation attendees gathered inside Moyse Hall for the ceremony, heavy rain poured down outside. The temperature was no comfort, with a high of 12°C during the day to a low of 11°C in the evening, with little variation. According to data gleaned from the Data Rescue: Archives and Weather (DRAW) database, a total of 46.5 mm of rain fell, making for an extremely rainy day. No thunderstorms were reported, but a solar halo was observed, which can indicate high atmospheric moisture and continued precipitation.
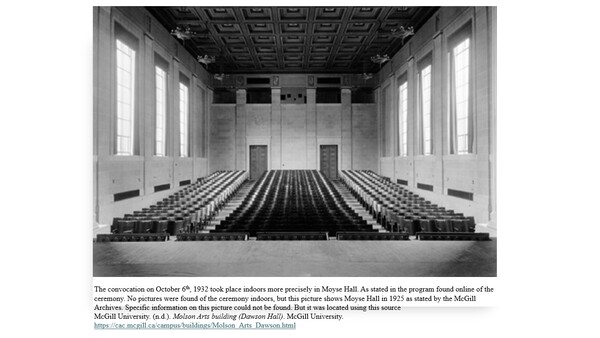
For early October, these conditions were much wetter and slightly cooler than usual. Average daily highs in early October are usually around 14–16°C, with lows around 5–8°C, so this day was on the cooler side. Additionally, 46.5 mm of rain is well above the daily average for October, which typically sees about 83 mm over the entire month in many regions of North America. This suggests October 6, 1932, was a particularly rainy and damp day. Weather forecasts from the previous day showed that rain was expected.
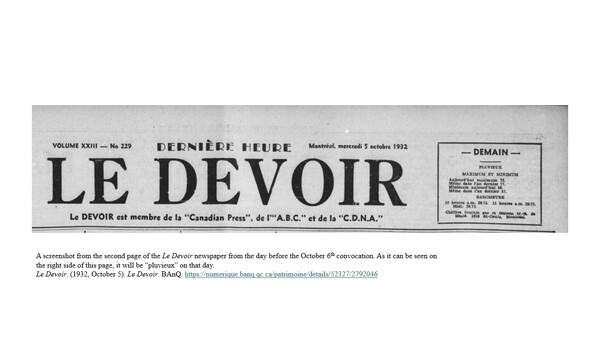
In fact, a year-end summary of the weather in the December 30, 1932 edition of the Montreal newspaper La Presse indicates that October 6, 1932 almost surpassed a record for the rainiest day, only to be beaten marginally by a date in June of 1880. October was the rainiest month of 1932 by a longshot, according to the same article, surpassing double the amount of rain compared to most months.
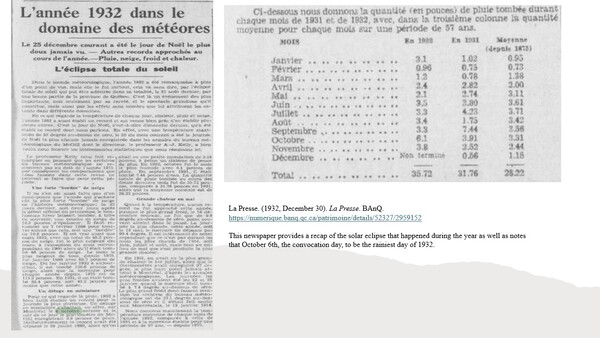
One month previously, just steps away, Montrealers gathered at McGill for a different reason. On August 31, 1932, similarly cloudy weather threatened to obstruct their view of a once-in-a-lifetime event: a total solar eclipse. An excerpt from La Presse describes the day, and onlookers are photographed looking skyward in the Montreal Gazette.
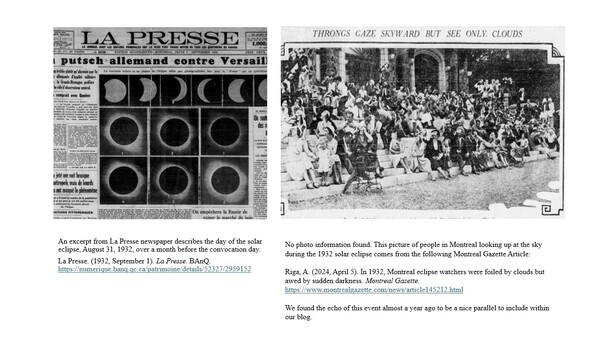
Almost a century later, hundreds gathered at McGill to witness the solar eclipse in 2024. They were lucky to have clear skies on that day.
At the convocation ceremony on October 6, graduates were greeted by Sir Arthur Currie, a celebrated commander in the First World War who had only a high school diploma when he was named Principal and Vice Chancellor of the University. He is generally considered to be among the most capable commanders of the Western Front, and one of the finest commanders in Canadian military history.
Despite being in declining health, Currie gave the commencement speech. He had a reputation as a powerful and charismatic orator; skills he used to maintain morale with his troops. However, in a letter to his sister from several months prior, Currie notes increasing “spasms” and other neurological issues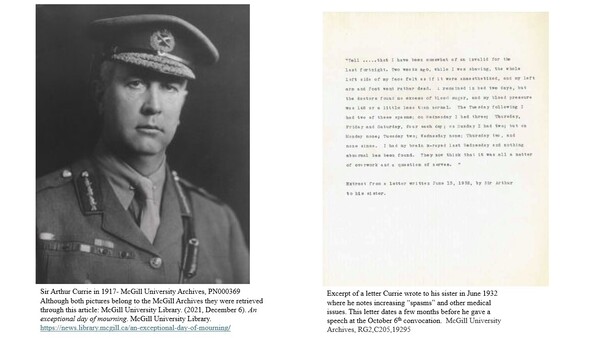
This would be Currie’s second last convocation. After suffering a stroke in November of 1933, Currie died later that month at 57 from complications brought on by pneumonia. His funeral would be held at the Christ Church Cathedral, and the procession was one of the largest at that point in history, with approximately 150,000 people lining the streets to watch.
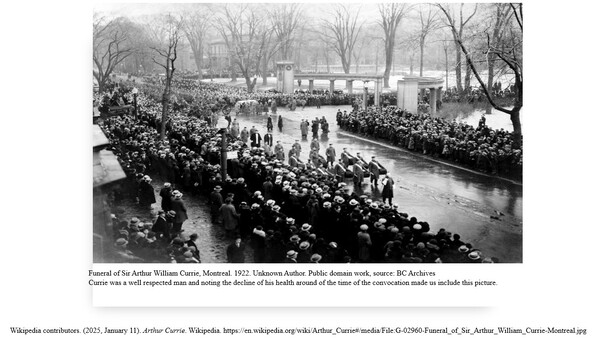
Unbeknownst in 1932, Currie’s military service would be echoed less than a decade later when several of the October 6 graduates who heard his address would be drafted into the Royal Canadian Armed Forces to serve in the Second World War. According to excerpts from the 1932 McGill yearbook, two Bachelor of Science graduates, Harold Percy Lyon and Hollie Edward McHugh, focused on medical studies and were highly involved in extracurricular activities. Both Lyon and McHugh would put their medical education at McGill to use during the War, serving in medical branches of the RCAF. They are commemorated in the archival project McGill Remembers, a project that honours McGill’s participants in the First and Second World Wars.
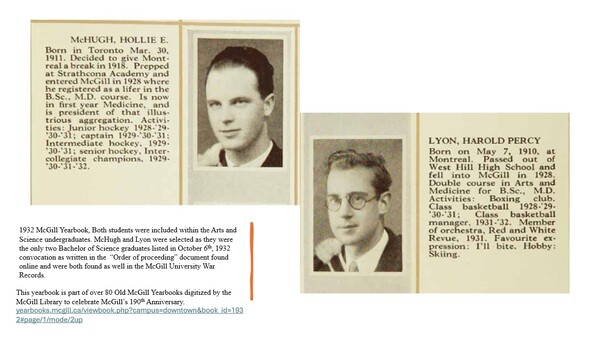
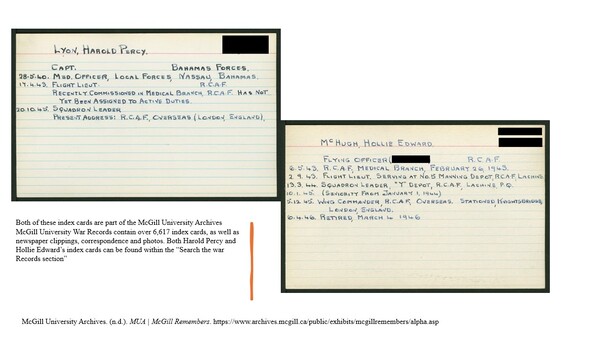
Weather as the Red Thread on Convocation Day
What do archives and a weather observatory have in common? At first glance, it seems like there is not much to tie them together. The first acts as a repository for historical records from a wide range of provenance, while the second collects data points about daily meteorological phenomena. However, at McGill, both entities can be used in tandem. In fact, the DRAW project, which seeks to transcribe data gathered at the McGill Observatory, can help contemporary users immerse themselves in events from the past, be they major historical events or ordinary life moments. Everyone is impacted by weather: it influences how we dress, where we go, how we get from point A to point B, and can also influence our mood. Therefore, weather can be a powerful tool or red thread to bridge the gap between contemporary users of archives and the people and events the archival materials are about. Weather adds a dimension to events from the past
Let’s take McGill’s May 29, 1931, convocation day as an example. May 29 started out as a clear and warm morning; the barometer attached thermometer reading 69. McGill students, faculty members, and governors paraded on foot from McGill’s Roddick Gates all the way to the Loew’s theatre, located on Ste-Catherine St., where the convocation ceremony was held. Four hundred and eighty-six robed McGillians from the faculties of Library Science, Household Science, Science in Agriculture, Commerce, Architecture, Science in Arts, Applied Science, Arts, Law, Dentistry, Medicine, and Public Health (The Gazette, May 30, 1931, p. 3) took gradually their seats in the theatre.
As the ceremony started, Sir Arthur Currie, McGill’s principal and vice-chancellor, first introduced the guest of honor at the convocation ceremony: the Governor-General, the Earl of Bessborough Lord Bessborough received an honorary degree of Doctor of Laws and delivered a speech to inspire the graduands before diplomas were distributed. As the temperature outside was rising, so were the spirits inside the theatre. Students cheekily greeted other Faculties walking across the stage with different chants: the architects were teased with the “London Bridge is Falling Down” song and the women from the Arts were greeted with the melody of “My Wild Irish Rose” (Gazette, May 30, 1931, p. 3).
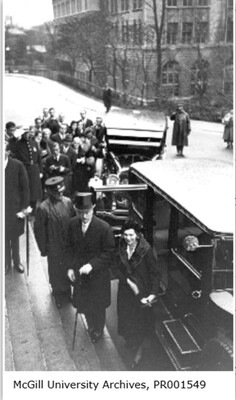
Visit of Governor General Lord Bessborough and his wife. Photo by Eric Sprenger. Public Domain. McGill Archives. 1931. PR001549 https://www.archives.mcgill.ca/aspfile/searchphoto4.asp?f1=bessborough&choosedb=allphoto&Orderby=Date&recsperpage=100&fileName=photosearch.htm
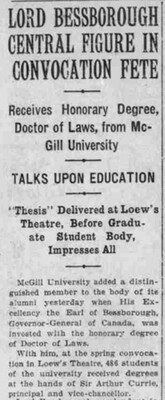
Detail. The Gazette, May 30, 1931, p. 3. ProQuest Database
But what must it have been like for Katherine H. Dawson, as she sat awaiting her turn on stage? She, alongside her classmates Helen E. Maytum and Agnes King Moffat, were the only women in that year’s medicine cohort. In a few moments time, Dawson would receive her medical diploma from the hands of principal and vice-chancellor Sir Arthur Currie. Not only was she graduating after all those years of hard work, but she would be rewarded in front of all the other McGillians seated in the Loew’s theatre. She was the first woman to win the Holmes Gold Medal, as mentioned in The Gazette. Created in 1865 in memory of Andrew F. Holmes, co-founder of McGill’s Faculty of Medicine and its first Dean, this award was given to the graduate medical student with the highest standing (Woodford, 2022).
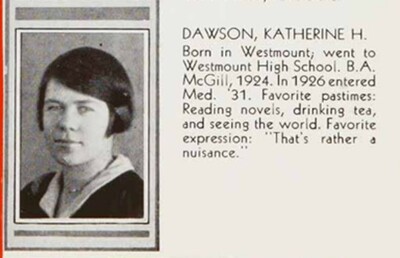
Detail. Dawson, Katherine H. McGill Yearbook 1931, p. 119. https://yearbooks.mcgill.ca/viewbook.php?campus=downtown&book_id=1931#page/140/mode/2up

Detail. Maytum, Helen E. & Moffat, Agnes King. McGill Yearbook 1931, p. 124. https://yearbooks.mcgill.ca/viewbook.php?campus=downtown&book_id=1931#page/146/mode/2up

Detail. The Gazette, May 29, 1931, p. 9. ProQuest Database
As the tension erupted and students exited the building after the ceremony, one could say that the weather was getting ready to release its own tension. The relative humidity recorded earlier in the morning at 73 had dropped to 62 by 3pm. As stratocumulus clouds paraded in the sky, Lord Bessborough was ushered to the next convocation event: the unveiling of the Good Will Fountain, today commonly known as the Three Bares Lord Bessborough accepted the statue on behalf of McGill as token of the friendship between Canada and the United States (The Old McGill News, 1931).
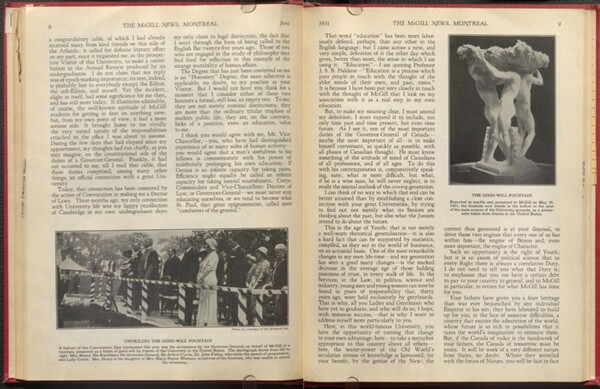
The Old McGill News, June 1931, p. 8-9. https://archive.org/details/McGillLibrary-rbsc_mcgill_news_v12_1930-31-21176/page/n165/mode/2up?view=theater
Whether the ceremony ended before the rumbling thunder started off in the distance at 4.15pm is unclear. Certainly, attendees would have been concerned about The Gazette’s forecasted storm. By 4.45pm, a powerful squall had blown through the western suburbs, leaving behind broken trees and wires down, as noted in the McGill Observatory’s logbook Later, the Observatory logged rain from 6.40pm to 7pm. One can imagine that the weather altered graduands’ celebration plans for the evening, bringing the parties inside. The Good Will Fountain, though not yet a functional fountain, would be official baptized by the rain
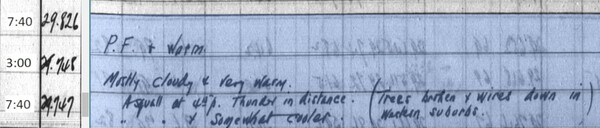
Detail. Draw Transcription from May 29, 1931.
McGill’s 1931 convocation can be reread through the lens of the day’s weather. In a way, it helps bridge the gap between contemporary users of archival materials and past events. Weather also ties people at the convocation event together. They are all evolving under the same sky, whether their paths crossed or not during that day. As such, contemporary users can, to some extent, relive the day’s events in a more holistic way
Reference
Woodford, G. (2022, April 7). Dr. Andrew F Holmes: A man of heart. Health E-News. https://healthenews.mcgill.ca/dr-andrew-f-holmes-a-man-of-heart/
McGill University Convocation Ceremony - May 29th, 1925
McGill’s convocation ceremony on May 29th, 1925 was the university’s first convocation ceremony in which graduates were able to walk through the Roddick Gates. The gates had been officially opened only one day previously, on May 28th, 1925. On May 28th when the Roddick Gates were opened, the sky was cloudy and overcast. This would not have been ideal, but the organizers and attendees of the event were likely pleased at the lack of rain, especially considering that a day earlier, on May 27th, there had been rain in the morning and a brief thunderstorm in the afternoon.
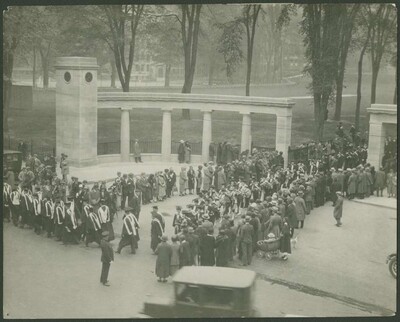
Convocation procession in front of Roddick Gates, McGill University, 1925. McGill University Archives, McGill University Archives Photo Collection, PR026581
The Roddick Gates were donated to McGill by Amy Redpath Roddick in memory of her husband, Sir Thomas George Roddick, who died on February 20, 1923. Amy Redpath Roddick was born into the Redpath family, who were very wealthy and well-known members of elite society in Montreal. Her father, John James Redpath, was a distinguished military man and a partner in his family’s highly successful company, Redpath Sugar. Her mother, Ada Maria Mills, was the daughter of John Easton Mills, a former mayor of Montreal. Amy kept her elite social status when she married Sir Thomas George Roddick, a prominent surgeon, professor, and member of parliament. Among many other accomplishments, Sir Thomas was the first chief surgeon at the Royal Victoria Hospital in Montreal, introduced a lifesaving antiseptic system to Montreal, and created the Medical Council of Canada
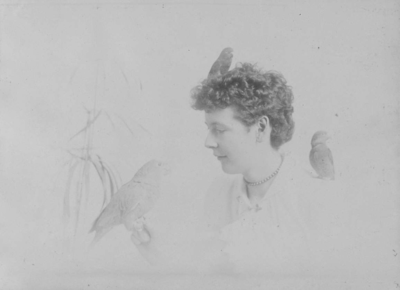
Miss Redpath and her parrots, Montreal, QC, 1891. McCord Stewart Museum Notman Photographic Archives, II-96487.1
The Roddick Gates, also known as the Roddick Memorial Gates, are a testament to Amy’s grief. The loss of her husband, Thomas, surely caused her deep pain, especially as Amy was no stranger to loss, her mother and younger brother having been murdered in their Montreal home on June 13th, 1901, in a mystery that remains unsolved to this day. McGill meant a great deal to Amy and Thomas. The Roddick family monument at Mount Royal Cemetery is a replica of the Roddick Gates at McGill by the same architect, Grattan D. Thompson. Amy specifically requested that a clock be incorporated into the Roddick gates, as a tribute to her husband’s punctuality. A prodigious writer, Amy published many poems and plays throughout her life. One achievement that is particularly interesting is her initiation into the Bear Clan of the Iroquois at Chaughnawaga in 1939, which was done in honour of her writings on Indigenous culture. She died in 1953 and is buried with her husband at their family monument at Mount Royal Cemetery
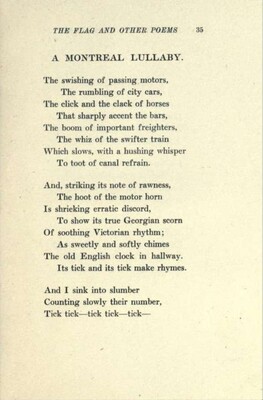
A Montreal Lullaby by Amy Redpath Roddick, in The Flag and Other Poems, published 1918. page 35, Internet Archive
The weather on the day of McGill’s convocation ceremony on May 29th, 1925, was reported as overcast, dull and gloomy. However, in a stroke of luck similar to that enjoyed by the attendees of the Roddick Gates opening ceremony, the convocation ceremony was not struck by the heavy thunderstorm which followed only one day later on May 30th.
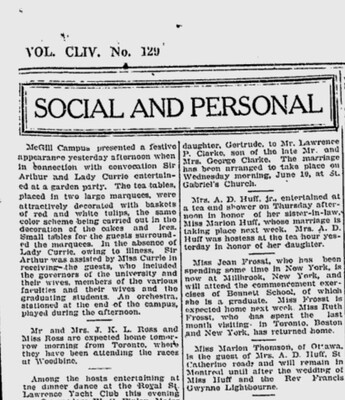
Montreal Gazette, May 30th, 1925. page 3, Google News Archive
The convocation of May 29th, 1925, was quite the event. Along with the newly opened Roddick Gates, a garden party was held for the graduating students, governors of the university, members of the faculty, and their family members. The guest of honour was Sir Arthur Currie. His wife, Lady Currie, unfortunately fell ill and was unable to attend the garden party and convocation ceremony.
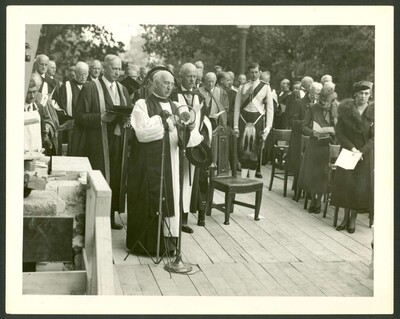
Convocation 1925 with Arthur Currie behind speaker. McGill University Archives, McGill University Archives Photo Collection, PR002684
Sir Arthur Currie was a Canadian war hero who is still widely known for his successful command in the First World War, helping to establish Canada’s military reputation. Currie was appointed as the commander of the 2nd Canadian Brigade at the start of the war. Following recognition for his leadership during the Second Battle of Ypres in 1915, which was the first instance of the large-scale use of poison gas by Germany on the Western Front, he was promoted to major-general and commander of the entire 1st Canadian Division. He played a major role in the planning and execution of the successful assault on Vimy Ridge in 1917, after which he was promoted to lieutenant-general and commanded the Canadian Corps. His leadership in the Hundred Days Offensive in 1918 allowed Canadians to play a crucial role in breaking through German defenses. After returning to Canada, Sir Arthur Currie became the principal and vice-chancellor of McGill University in 1920 and continued in this role until his death in 1933. His funeral procession, which passed by the Roddick Gates, was then the largest in Canadian history, with approximately 150,000 people in attendance.
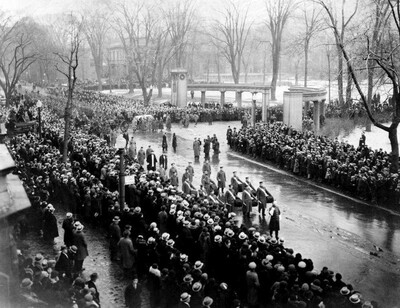
Funeral of Sir Arthur William Currie, Montreal. BC Archives, 193501-001
Fair Weather and the celebration of the Montreal Neurological Institute on Founder’s Day Convocation in October 1933
The days leading up to 1933’s convocation were cloudy with lightly sprinkled rain but the date itself, October 6th, appeared to be a near-perfect day for the event. With sunny skies and the occasional cloud, the “fair” judgement of the observer at the McGill Observatory seems like it had to be accurate. The day was still cool, as would be appropriate for October, with a recorded high of 58.1 and low of 48.1. A strong breeze moved its way through the city, no doubt blowing colorful leaves across campus. It would have been a picturesque fall day for the 41 McGill University graduates meant to receive their degrees in Moyse Hall, with the wonderful weather far upstaged by the news that the Earl of Bessborough, the Governor General of Canada, would be in attendance.
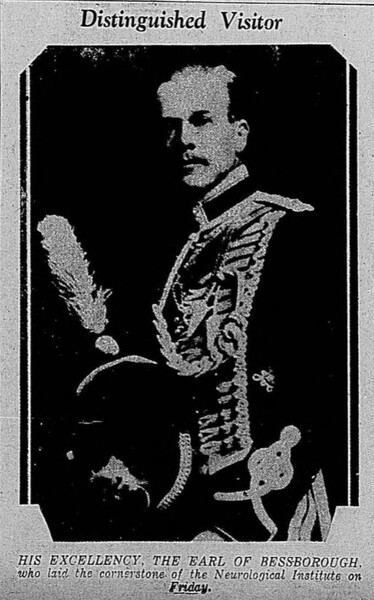
Photograph of the Earl of Bessborough, The McGill Daily Vol. 23 No.005 October 10, 1933, p.1
The Earl would be making an address to the graduates during the ceremony. This was to be a great honor, and the McGill Daily was reporting the “Vice-Regal Patronage” at the convocation for several days before the event itself. The Montreal Gazette reported the visit as well and it seems McGill was not about to waste the Earl’s attendance as just afterwards, he was to lay the cornerstone for Dr. Wilder Penfield’s Neurological Institute.
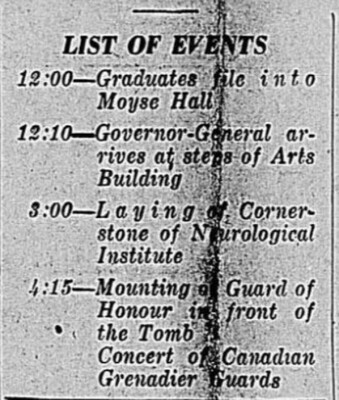
List of Events on Founder's Day, The McGill Daily Vol. 23 No.006 October 6, 1933, p.1
Indeed, the day seemed to be quite a full day according to the McGill Daily’s list of events for the University’s “Founder’s Day”, of which the convocation was only the beginning. Although the announcements that classes would be let out at noon so undergraduates could make it to the convocation implies that for some, even that wasn’t the start of the day. It seems lucky then that the day was so fair, so everything could go off without a hitch.
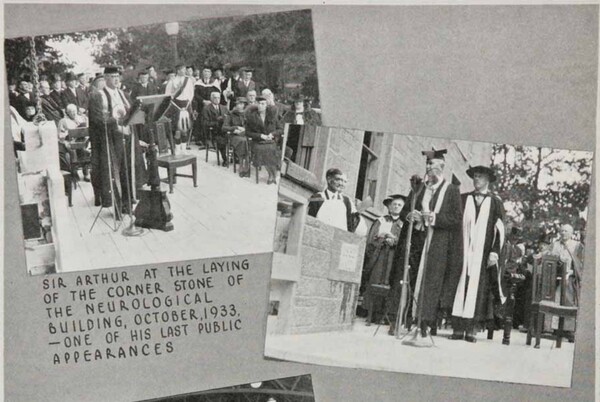
Sir Arthur Currie at the Laying of the Cornerstone of the Neurological Institute, from the Online McGill Yearbooks, McGill Library, 1934, p. 10. The note on the photo concerning Currie and his public appearances reflects the fact that Currie died in November of 1933.
The laying of the cornerstone would have likely been more affected by inclement weather as it was to take place outside, unlike the convocation itself. The creation of the Neurological Institute was a major step for the university. Ninety years later we know this building as “The Neuro”, one of the foremost research institutes into neurological disorders. The institute would combine research and clinical care and continue to make groundbreaking discoveries in neuroscience and neurological health up until the present day. The Neuro celebrated its 90th birthday last year, being officially opened in 1934. It was the brainchild of Wilder Penfield, a neurosurgeon whose discouraging experiences as a surgeon encouraged him to pursue research and establish a more solid connection between scientific pursuit and practice. The Neuro keeps up this integration of research and treatment to this day.
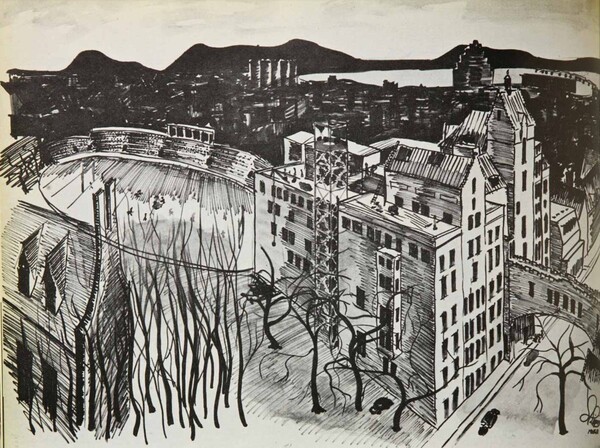
Drawing of the McGill Neurological Institute by Argods B. Leipins, from the Online McGill Yearbooks, McGill Library, 1953, p. 72
The start of construction of the institute was most certainly worthy of the pomp and circumstance it was awarded at the time. Although, considering some of the headlines, the excitement of the day may have been a little more due to the attendance of the Governor General of Canada.
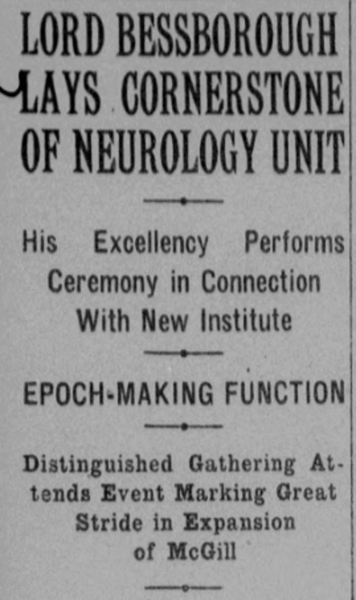
Headline announcing the Laying of the Cornerstone of the Neurological Institute, Montreal Gazette, October 7, 1933, p. 5
The “distinguished gathering” of well-known official men was thoroughly reported on, but the importance of the neurological institute was not downplayed to the least. The Gazette chronicles its long journey to coming into existence and printed a good portion of Sir Arthur Currie’s address at the ceremony. Reading through the Gazette and McGill Daily’s articles on the subject one quickly forgets that the first event of the day was the convocation, so caught up in the historic start of one of the largest specialized neuroscience research and clinical centers in the world.
So really in the end it was likely a slightly less-than perfect day for any graduate who expected celebrations to be about their accomplishment, thoroughly shown up by the Earl and Dr. Penfield’s ambitions undertaking. Still, no doubt for those graduating the day was as “fair” as the weather was.
References
Montreal Gazette. (1933, October 05). The Gazette (1867- 2014) https://proxy.library.mcgill.ca/login?url=https://www.proquest.com/newspapers/october-5-1933-page-10-22/docview/2383003972/se-2
Montreal Gazette. (1933, October 06). The Gazette (1867-2014) https://proxy.library.mcgill.ca/login?url=https://www.proquest.com/newspapers/october-6-1933-page-7-20/docview/2382999056/se-2
Montreal Gazette. (1933, October 07). The Gazette (1867-2014) https://proxy.library.mcgill.ca/login?url=https://www.proquest.com/newspapers/october-7-1933-page-5-22/docview/2383009332/se-2
Montreal Neurological Institute-Hospital. (2022, October 3). Wilder Graves Penfield. The Neuro. https://www.mcgill.ca/neuro/about/history/wilder-graves-penfield
Old McGill. (1934). McGill Yearbooks. https://yearbooks.mcgill.ca/viewbook.php?&campus=downtown&book_id=1934#mode/1up
Old McGill. (1953). McGill Yearbooks. https://yearbooks.mcgill.ca/viewbook.php?&campus=downtown&book_id=1953#mode/1up
The McGill Daily Vol. 23 No. 003 (1933, October 4). McGill University. https://archive.org/details/McGillLibrary-mcgill-daily-v23-n004-october-05-1933-8257/mode/2up
The McGill Daily Vol. 23 No. 004 (1933, October 5). McGill University. https://archive.org/details/McGillLibrary-mcgill-daily-v23-n004-october-05-1933-8257/mode/2up
The McGill Daily Vol. 23 No. 005 (1933, October 6). McGill University. https://archive.org/details/McGillLibrary-mcgill-daily-v23-n005-october-06-1933-8258/mode/1up
The McGill Daily Vol. 23 No. 006 (1933, October 10). McGill University. https://archive.org/details/McGillLibrary-mcgill-daily-v23-n006-october-10-1933-8259/mode/2up
DRAW at A day of interconnectivity at the Reford Gardens
On March 27, 2025 the Angora group sponsoring socially relevant research at UQAR (Université du Québec à Rimouski) held an event titled “ - Une journée d'interconnectivité aux Jardins de Métis” -Blog – by Isabel Cayer – Agora UQAR https://www.agora-uqar.com/blogue
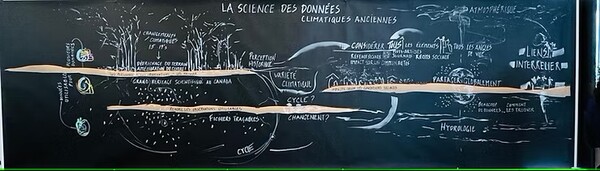
Blog - Isabel Cayer – Agora UQAR - https://www.agora-uqar.com/blogue – March 27, 2025 accessed April 6, 2025
Victoria C. Slonosky, the Principal Investigator for the multidisciplinary Data Rescue Archives and Weather (DRAW) project in McGill’s Department of Geography participated and spoke on “Predicting the Past to Predict the Future”

Victoria C. Slonosky from https://www.linkedin.com/in/victoria-slonosky-b4112359/?originalSubdomain=ca
Here is a translated excerpt from the Angora blog created by Isabel Cayer where Vicky is mentioned speaking about the Data Rescue Archives and Weather project. The original complete French language blog is cited in the reference section.
"What if we used climate data from the past to train AI models that can predict events from the past?" Wow, this ingenuity hit me. Far from being a "geek trip", this question alone contains a key to our adaptation. Questions like this have apparently been asked for centuries. Like this one that you may have also asked yourself while exploring a globe: "Why, despite the similar latitude on both sides of the Atlantic, does it seem to be colder in New France?" Hypotheses abounded, measuring instruments developed, experiments multiplied, all with the references and capabilities of the 18th century.
Now imagine an archive room in 2025, in Montreal or Paris. It smells like an old book, a little acrid ink. Your brain loves it, without really understanding why this scent of the past is really intoxicating. It can have the same effect as the smell of kelp on the edge of the beach. The archives. You have documents in front of you, all open to the pages describing the analysis of the results of Gaultier, Réaumur, Celsius, Von Linnaeus, Kalm. How to collect handwritten data in languages from different countries emerging from the distant past? Those who are passionate about Data Science are already programming a method by reading this, stop and focus, Victoria has already done it in her DRAW project.
References
Blog - Isabel Cayer – Agora UQAR - https://www.agora-uqar.com/blogue – March 27, 2025 accessed April 6, 2025
Science Literacy Outreach and Citizen Science in 1932: The case of Allie Vibert Douglas
Allie Vibert Douglas was a graduate in Physics with both bachelor's and master's degrees in science from McGill University. In 1921 she had won a scholarship from the Imperial Order of the Daughters of the Empire to study physics at Cambridge under Ernest Rutherford.
Securing no tangible support from Rutherford within a hostile lab environment and on the advice of the only another female physics student Allie switched from nuclear physics to astrophysics to obtain a more supportive environment for women. (Dood, p.41) In doing so she found success in the lab of Cambridge astrophysicist Arthur Stanley Eddington. She produced a study leading to a published paper and this propelled her to continue her studies for a PhD at McGill University in 1926. (Dood, p.39). Douglas was the first Canadian woman to acquire a doctorate in astrophysics. (Braswell, p.2).
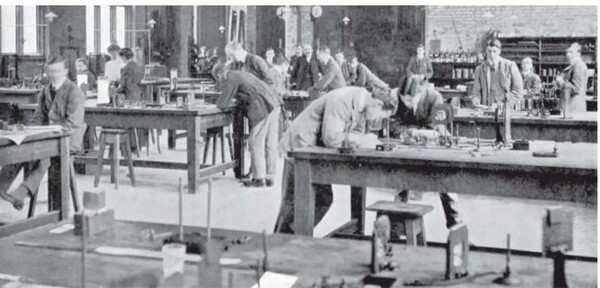
Students in a physics lab, ca.1910, p.40 in Diane Dodd Seeing Stars: Astrophysicist Allie Vibert Douglas popularized astronomy and opened doors for women in Science, Canadas History, June-July 2024, p.38-45.
In an article written for the McGill News alumni publication in Spring (March) 1938 titled Women and Research, Allie Douglas, McGill Demonstrator and then Lecturer in Astrophysics from 1927-1938 (McGill Staff Card Index, McGill University Archives) recounted her seven years of experience as the Canadian representative on the Selection Committee of the Fellowship Awards of the international Federation of University Women. She opined on why women pursued scientific research work at all when it was not a direct path to academic or research appointments particularly in Canada. The reward for Douglas was the satisfaction engendered by the research itself despite the lack of monetary incentives.
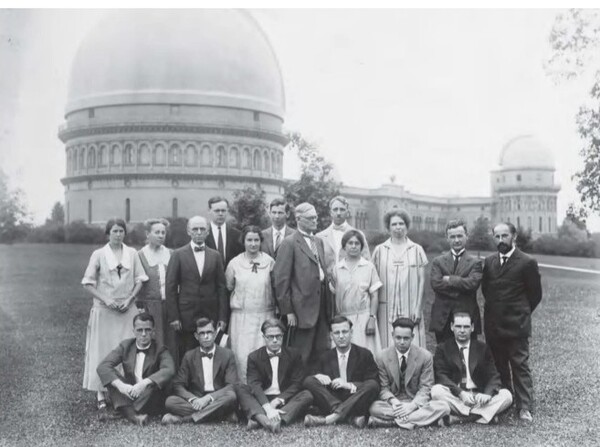
Allie Vibert Douglas (second row, far left) poses with other staff members of the Yerkes Observatory in Wisconsin in August 1925 p.43 in Diane Dodd Seeing Stars: Astrophysicist Allie Vibert Douglas popularized astronomy and opened doors for women in Science, Canadas History, June-July 2024, p.38-45.
This speaks directly to her own experiences as a researcher and faculty lecturer at McGill from as the only women academic in the Physics department and her struggles to fight against both the implicit and explicit biases faced by women in science encountered throughout her career. In an assessment of the publications by the nine Faculty members of the Physics department from 1925-1939 by Jerry Thomas in 1984, Douglas had the second highest number of publications surpassed only by Prof. J.S. Foster. Yet, she remained as a faculty lecturer in astrophysics from 1927-1938 (McGill Staff Index, Douglas) and was never promoted to become a professor.
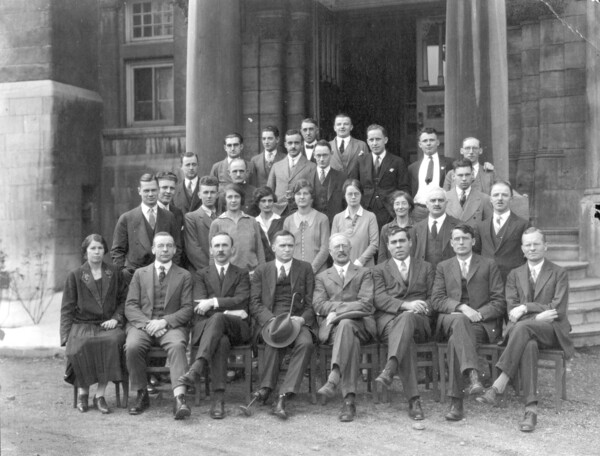
Staff of the physics department, 1935, Public Domain, PR009053, McGill University Archives.
Aside from her qualities as a researcher Douglas also had a real passion for doing outreach to the public to make science better known and understood. She pursued through numerous articles and public lectures throughout her career both at McGill and later at Queen’s University as Dean of Women and astronomy professor at making science literacy a meaningful reality.
Douglas in an article quoted in Dood’s work on My Forty Minutes with Einstein recounted a meeting with Albert Einstein who was dismissive of any attempt of scientists to do public outreach. Douglas completely disagreed with him and described it as her duty to share her expertise with the public. (Dood p.45)
As an astrophysicist the 1932 Solar Eclipse was a key element in bringing science to the people and engaging them as citizen science researchers to gather data in ways that non-specialists could do but structured in a way to help academic research.
Aside from her qualities as a researcher Douglas also had a real passion for doing outreach to the public to make science better known and understood and this she pursued through numerous articles and public lectures throughout her career both at McGill and later at Queen’s University as Dean of Women and astronomy professor at making science literacy a reality
Douglas in an article quoted in Dood’s work on My Forty Minutes with Einstein recounted a meeting with Albert Einstein who was dismissive of any attempt of scientists to do public outreach. Douglas completely disagreed with him and described it as her duty to share her expertise with the public. (Dood p.45)
As an astrophysicist the 1932 Solar Eclipse was a key element in bringing science to the people and engaging them as citizen science researchers to gather data in ways that non-specialists could do but structured in a way to help academic research.
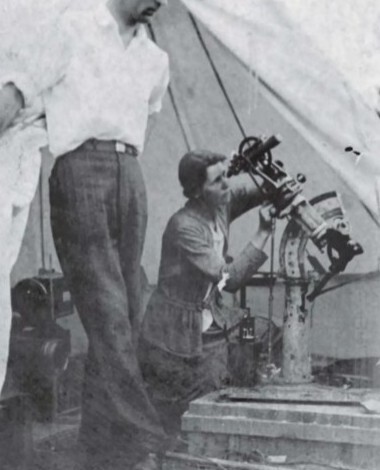
Allie Vibert Douglas adjusts a heliostat in order to study an imminent eclipse at Magog, Quebec on August 31, 1932, p. 41 in Diane Dodd Seeing Stars: Astrophysicist Allie Vibert Douglas popularized astronomy and opened doors for women in Science, Canadas History, June-July 2024, p.38-45.
In her letter to McGill Principal Arthur Currie as the Secretary of the Royal Astronomical Society of Canada (Montreal Branch) in April 20, 1932, she promoted the event in three ways, to gather scientific data on the atmospheres of both the earth and the sun, a Quebec wide educational opportunity to learn more about science and as a “celestial spectacle”. (Douglas to Currie, letter, April 20, 1932, in McGill University Archives, Principal's Office, RG2 c.63 file 01109 title: Eclipse1932.)
Earlier in 1932 she had published in the Quebec Teacher’s Magazine this call to action The writer will gladly receive from any observers, old or young, any observations made carefully and conscientiously, (Address: A. Vibert Douglas, McGill University, Montreal), stating name, address, exact point where observations were made, time and observations. (Reprint from the Teacher’s Magazine see reference in Queen’s Digital holdings).
At the end of the 1932 Eclipse Outreach Pamphlet by McGill’s A.N. Shaw and A. Vibert Douglas promoted again on the outreach work of Douglas and specifically a questionnaire to be filled in by members of the public and to help scientists to measure the effect of the eclipse.
The questionnaire supplied a structured format with an astrophysics focus and was clearly designed to be filled in by individuals or citizen scientists without any scientific training or knowledge. The results were to be sent to A. Vibert Douglas at McGill with information identifying the person doing the observation.
The questionnaire had been designed by Ernest William Brown, British born astronomer, Professor at Yale and the president of the American Astronomical Society in 1931. Brown had led large scale campaigns to gather data in previous eclipses and devised the questionnaire with a clear astronomy and public cooperation focus. Most answers were yes or no, for example, could you see the corona all around the sun at any point, had long it lasted, how was this measured, visibility of stars or planets during the total eclipse and encouraging the use of the nearest street intersection or landmark or to mark on x on any map and include it with the report.
In an article on the role of Boy Scouts to gather data during the eclipse by E. Russell Paterson (reprinted from the Journal of the Royal Astronomical Society of Canada in May-June 1933) there is a two-page report by Douglas (see the Queens University reference for more information) on some of the results of this appeal in regard to the Province of Quebec. She analyzed the data and praised the activities of the Boy Scouts and a group from College Ste. Marie for their efforts to help measure the real edge of the shadow in contrast to the predicted one.
Sources cited
Branswell, Brenda McGill University, Astrophysics Student Research Award named for A. Vibert Douglas, 05-31- 2024 https://giving.mcgill.ca/all-stories/astrophysics-award-honours-student-research-nod-pioneer
Dood, Dianne. Seeing Stars: Astrophysicist Allie Vibert Douglas popularized astronomy and opened doors for women in science, June-July 2024, p.38-45, CanadasHistory.ca https://www.canadashistory.ca/explore/women/trailblazing-astrophysicist-opened-doors.
McGill University Archives, Staff Card Index, A. Vibert Douglas
McGill University Archives, Dr. A. Vibert Douglas,1912-1938, Royal Victoria College, Muriel Roscoe, Administrative records, RG 42, cont.1, file 0040
Queens University Archives, Digital Collections, Lectures, Speeches, Publications and Manuscripts https://digital.library.queensu.ca/publications-title-m-r Report of Observation of Total Eclipse by Boy Scouts, August 31, 1932, by E. Russell Paterson, reprinted from the Journal of the Royal Astronomical Society of Canada, May-June 1933, University of Toronto Press, 1933 with note on Reports of 1932 August 31Eclipse by A.V. Douglas. P.210-21.
Queens University Archives, Digital Collections, Lectures, Speeches, Publications and Manuscripts https://digital.library.queensu.ca/publications-title-m-r The 1932 Total Solar Eclipse by A. Vibert Douglas. Reprinted in the Teacher's Magazine, Quebec. 1932.
Shaw, A.N and Douglas, A. Vibert Total Eclipse of the Sun: When, Where and How to See it. Renouf Publishing Company, Montreal, 1932.
Thomas, J. (1984). John Stuart Foster, McGill University, and the Renascence of Nuclear Physics in Montreal, 1935-1950. Historical Studies in the Physical Sciences, 14(2), 357–377. https://doi.org/10.2307/27757537
Wikipedia Biography on E.W. Brown https://en.wikipedia.org/wiki/Ernest_William_Brown
The event that never was - Disruptive weather at the Irish Ship Fever Monument Commemoration in Montreal in 1912
In 1847 more than 75,000 Irish immigrants came to Montreal to escape the famine in Ireland and more than 6000 died in Montreal of typus or ship fever. A Ship Fever monument or the Black Rock was created in 1859 to mark this horrific event near the quarantine sheds in Pointe-Sainte-Charles.
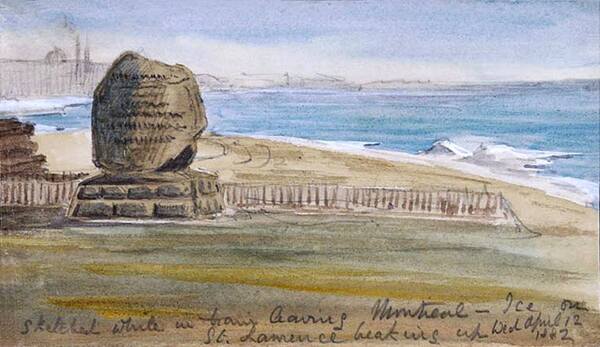
https://montrealirishmonument.com/wp-content/uploads/2021/12/11188487_10152765147232233_4970275728300393666_n.jpg. Montreal Irish monument. Accessed March 10, 2025.
Community remembrance events were held at this memorial in 1897, 1913 and 1942 (McMahon. P.48) but this blog on St. Patrick's Day in 2025 is based in the weather and how it impacted the planned 1912 event to delay it for a year.
A headline in the Montreal Gazette on September 30, 1912, WEATHER WORST FOR highlighted the rainy, abnormally cold and at times snowy weather in Montreal for September. Therefore, it is not surprising the outdoor Ship Fever Monument event was cancelled when it rained heavily all day on the 30th.
However, a great deal of planning was done involving outreach to the Irish community in North America with more than 400 representatives coming to Montreal from Quebec, Ontario and America to take part in the procession. Unable to hold the event the organizers according to the newspaper accounts (Gazette Sept. 30, 1912, page 5) moved to find alternative venues and showed resilience in the face of extreme weather.
Moreover, other venues were not found for the public part of the event, but the organizers still adapted to the circumstances and added a public element to the indoor religious part of the event
The religious element of the outdoor ceremony a song was included in a high mass in St. Patrick's Cathedral. The Irish Catholic Mayor of Montreal, Dr. John James Edmund Guerin who was also present expressed regret over the cancellation.
The following year in 1913 the event was held, and this cancellation is a forgotten event, but it is important to look at the flexibility and hope that previous generations have brought to help ameliorate severe weather conditions.
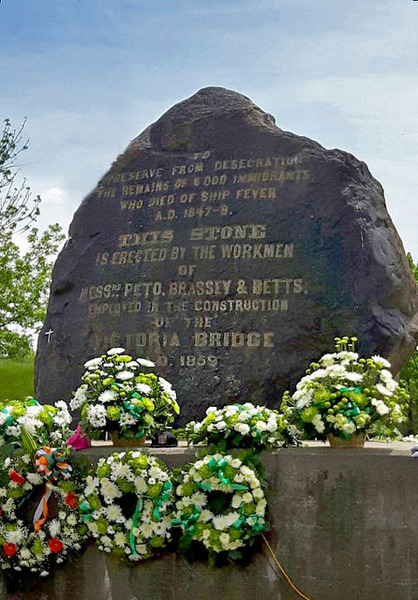
https://montrealirishmonument.com/wp-content/uploads/2021/12/MontrealIrishMonument.jpg. Montreal Irish monument. Accessed March 10, 2025.
References
ProQuest, Online, The Gazette, September 30, 1912, p.5
Montreal's Ship Fever Monument: An Irish Famine Memorial in the Making by Colin McMahon. The Canadian Journal of Irish Studies , Spring, 2007, Vol. 33, No. 1, Ireland and Quebec / L'Irlande et le Québec (Spring, 2007), pp. 48-60. Published by: Canadian Journal of Irish Studies
Montreal Irish Monument Foundation. https://montrealirishmonument.com/
James John Edmund Guerin. Mayors of Montréal, Archives de Montréal. (http://www2.ville.montreal.qc.ca/archives/democratie/democratie_en/expo/maires/guerin/index.shtm
The 1932 Eclipse Outreach Pamphlet by McGill’s A.N. Shaw and A. Vibert Douglas
The concerted public outreach campaign by McGill concerning the Solar Eclipse of August 31, 1932, was multifaceted. In previous blogs we have highlighted the Quebec wide radio broadcast and the related McGill News article by A.N. Shaw as well as the St. Lawrence River trip organized by McGill to have the best view possible of the event. The most detailed outreach package was a pamphlet published by A.N. Shaw and his astrophysicist McGill colleague A. Vibert Douglas. Alice or Allie Douglas’ role in this project will be examined in more detail in a follow up blog.

Front title page of the pamphlet by A.N. Shaw and A. Vibert Douglas, Total Eclipse of the Sun: When, Where and How to See it. Renouf Publishing Company, Montreal, 1932.
The pamphlet was titled Total Eclipse of the Sun: When, Where and How to See it and endeavored to present all the information needed for members of the public to enjoy and participate in the event. Maps concerning the path of the eclipse across Canada and the Unites States were supplied along with a timetable for how long the total eclipse would last at a variety of locations in Quebec where the eclipse would pass.

The path of the Solar Eclipse across Quebec. Map from the Journal of the Royal Astronomical Society, p.3 in A.N. Shaw and A. Vibert Douglas, Total Eclipse of the Sun: When, Where and How to See it. Renouf Publishing Company, Montreal, 1932.
The timetable for McGill University was even more detailed showing when the partial eclipse would begin and end. The plan of a major event occurring at the downtown campus Observatory (located where the Stephen Leacock building now sits) to partake of the eclipse came to an unfortunate end as the cloud cover hampered the viewing. The eclipse was carefully described in easy-to-understand language including the role of the moon and the rarity of a total eclipse of the sun. The authors’ explanation noted that given the orbiting movement of all the bodies the moon still had to be close enough to the earth to block out the entire sun.

Diagram of the coming Solar Eclipse (modified from Drawing by DR. A.C.D. Cromelin), p. 6 A.N. Shaw and A. Vibert Douglas, Total Eclipse of the Sun: When, Where and How to See it. Renouf Publishing Company, Montreal, 1932.
In the What to Look For section provided valuable safety tips for viewing the eclipse, as well as advice to Boy Scouts and Girl Guides to help scientists by doing an experiment to help trace the shadow bands of the eclipse utilizing basic white sheets, two sets of sticks and a compass to record data. Elements such as the corona, the outer radiance around the sun viewable in the eclipse, were highlighted with advice to seek the prominences described as red fiery tongues of light stemming from the cyclonic storms around the sun.

Solar Corona and Prominences, 1918 eclipse, p.12 in A.N. Shaw and A. Vibert Douglas, Total Eclipse of the Sun: When, Where and How to See it. Renouf Publishing Company, Montreal, 1932.
Practical tips were also proved to safely take photos of the eclipse. There was also a call for observations from the public on wildlife behavior. There were also several quotes from scientists who had recorded their enthusiastic reaction to the breathtaking splendor of the previous total eclipses to appeal to the public to engage with science and the eclipse in this once in a lifetime event. The authors described it as a phenomenon of such striking and unforgettable character that no persons who can possibly be within the favored area at the right time should allow trivial circumstances or apathy to prevent them from making the attempt to view it. (Shaw and Douglas p. 4).
The recording of weather data has been happening for centuries, often by individuals for their own purposes or at times by members of the public in response to requests. The beginning of systematic weather data collection occurred in Canada in the late 19th century creation of government weather stations including the McGill Observatory. The goal of the Data Rescue Archives and Weather (DRAW) project is to rescue this valuable older data only available in analogue form by using citizen science crowdsourcing and participatory archives orientations to encourage members of the public to enter this date into databases to be used for both scientific research purposes and personal use.
Citizen Science is a modern term coined in 1989 meaning the active participation of the public to aid researchers, but notably the public has been encouraged to gather data for the 1931 Total Eclipse in this article but in an unstructured or in the case of the measurement of the eclipse’s shadow a semi-structured manner. By the end of the article the structured approach for public cooperation takes form in terms of an appeal by McGill astrophysicist Allie Vibert Douglas to fill in an amazingly easy to read and follow questionnaire related to astronomical research. More to follow....
Introducing DRAW Member: McGill School of Information Studies Practicum student Celia Martini
Introducing…
Who:
Celia Martini
From:
Virginia, USA
Role at DRAW:
I’m aiding the research project on disruptive weather events, more specifically examining the McGill community's experiences in the early 20th century and using the findings for outreach and promotion of the DRAW project.
Favourite part of DRAW?
I’ve done a lot of digitization in the past so I can’t help but admire the photographs – But in all seriousness I love how public and involved the project is.
Favourite Season?
Winter!
Favourite Weather Symbol?

DRAW weather symbol
Thunderstorm. It looks a little like my handwriting when I write an uppercase “R”, which many people have confused for a 12 when trying to read what I’ve written. If I had written weather observations a hundred years ago would poor transcribers be pulling their hair out over which of the three to put down?
Favourite Cloud Type? Why?
Mammatus clouds! Though usually formed out of cumulonimbus clouds, they can actually be formed out of several different types of clouds. I have a very vivid memory from what I was young of being in the car with my grandfather when we noticed the clouds making this pattern. He quickly blew way past the highway speed limit as he was worried we might get caught in a tornado.
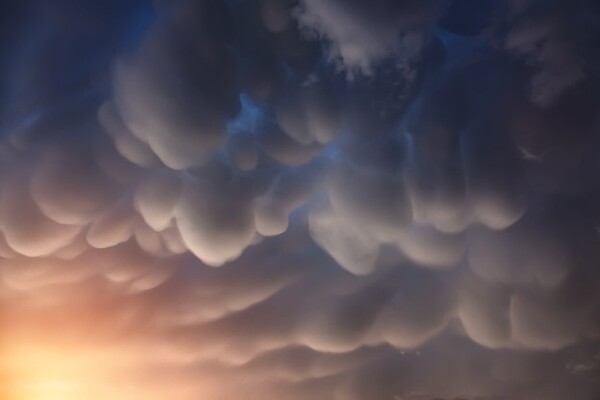
Mammatus Clouds in the Nepal Himalayas
by Anton Yankovyi, Creativecommons.org/licenses/by-sa/4.0/ via Wikimedia Commons
And of Course:
Coolest thing you’ve learned while participating in DRAW?
Learning about such a specific part of history I never would have even really thought about. I mean look at how much data they kept! It might seem a little silly but taking down all that information each day by hand must have been a lot of work. And now others are putting in a lot of work to make sure it’s usable in the 21st century.
Sweet or Salty?
Sweet
Star Wars or Star Trek?
Star Wars
Cats or Dogs?
Cats
Favourite Animal?
Sidewinder Snakes
Favourite place in Montreal?
This one isolated rock in Mont Royal Park that’s really nice to read at.
Data Rescue: Archives and Weather: From a McGill Research Citizen Science Project to a Participatory Archives
Location: MCLL (McGill Community for Lifelong Learning) mcll.scs@mcgill.ca +1 514-398-8234 680 Sherbrooke West, suite 229 Montreal, QC H3A 2M7 Cost: $10

DRAW webpage screen capture, 2023 by Gordon Burr, DRAW project.
This presentation will cover the history of the McGill Observatory from 1863 on and the creation of the online DRAW (Data Rescue: Archives and Weather) project in 2015 to capture in a database form the data hidden in the Observatory’s handwritten weather registers. Ordinary citizen scientists without specialist scientific training have rescued more than one million data points for research use by climate scientists. Weather data carefully gathered by weather observatories like McGill’s was not entered into databases on an ongoing basis until the 1950s and has scientists relying only on more recent data to describe climate changes.

McGill University campus with view of McGill Weather observatory (first smaller building to the left of the main Arts Building) ,1874ca, Unknown photographer, public domain, PR023224. McGill University Archives.
By contributing to this project, the data has become available for research use and extends the data analysis back to the 19th century providing scientists with a much richer and longer view upon which to study climate change. Building on the citizen science accomplishments of the project a participatory archives component was added by DRAW where individuals could capture their own rescued data in a personal directory and then be free to use this same data for personal use.

Image composed by Philip Brohan, UKMO of the Weather for Winter 1880 from rescued weather data from the ACRE (Atmospheric Reconstruction over the Earth) International Surface Database, ca. 2018 from Vickie Slonosky of the DRAW Project..
The establishment of a social media program thanks largely to work done by students in the McGill School of Information Studies has helped us make a functionating participatory archives element where students could create their own weather data archival records and then as researchers interpret them in their own research projects and then publish the results in blogs. A multi year program emphasizing weather for McGill Convocation Days from 1863-1914 within the INFS 641 Archival Description and Access course that I teach in the School has been undertaken with students interpreting weather on these days and linking these to other historical issues.
We still need your help finish the transcription or rescue of data from the historical handwritten registers of the McGill Weather Observatory located on the downtown campus of the University until the 1960s. To do so please sign up at our DRAW website:
Click on link and start transcribing!here
If you are interested in seeing the results of the SIS students’ weather themed Convocation research projects, please peruse our blog on the same DRAW website.
McGill Physicist A.N Shaw and 1932 Eclipse Media Outreach
Physicist Albert Norman Shaw created an experiment to measure the meteorological conditions of the Eclipse on August 31, 1932, from a camp in Magog. The results of this experiment were published in the Journal of the Royal Society of Canada in January 1933. A. Norman Shaw’s “Notes on the Variations of Temperature, Humidity, and Wind during the Eclipse of the Sun at Magog, August 31,1932: with comments on the risk of dew, and the use of temperature observations”, Journal of the Royal Society of Canada, January 1933, University of Toronto Press, 1933. (See Blog 109 McGill Eclipse Research in Magog for more information). Shaw’s involvement with the Eclipse extending beyond the purely scientific interest to a full-blown engagement plan to include the public of Quebec in this experience.

A SOLAR ECLIPSE IN 1900 This photograph by Professor E. E. Barnard shows the sun's corona during the period of totality. A total eclipse of the sun provides what is perhaps the most awe-inspiring of Nature's phenomena. From article by A. Norman Shaw on “The Total Eclipse of the Sun on August 31, 1932”, McGill News, June 1932 p. 1, McGill News, Vol.13, no. 4, 1931-1932 found in A. Shaw fonds, MG 2006 c. 6, file 192, McGill University Archives.
This engagement of the public was a way to provide scientific knowledge by venturing beyond academia through learned journals to using popular media such as radio, newspapers and magazines. This information was clearly aimed to educate the public on the methods and processes of scientific research. This was done by both Shaw and his McGill colleague astrophysicist Allie Douglas in the language now espoused by the proponents of scientific literacy as the “ability to understand basic key scientific concepts and processes, and to use this knowledge to make more informed personal decisions and to better engage with society.“ Source: https://guides.library.utoronto.ca/scienceliteracy#:~:text=Science%20literacy%20is%20the%20ability,from%20Science%20Literacy%20Week%202017
The first element of the plank for the public education campaign was a 15-minute Quebec wide radio address on CKAC on December 11, 1931. The information in the address was later published in the alumni magazine, the McGill News in June 1932 as The Total Eclipse of the Sun on August 31, 1932. McGIll News, Vol.13, No. 4.
The question of the eclipse’s worth as a public event was posed by Shaw himself and he supplied a series of thoughts grounded in science but wrapped in his almost poetic rendition of the total eclipse experience as a spectacular show.

What is there in the observation of an eclipse to attract the attention and interest of the general public? Why was it that scores of thousands went miles up or down Great Britain to see the total eclipse of 1927? The answers are to be found in the unique and thrilling character of the phenomenon, coupled with its particularly important scientific value. When we are in the complete shadow, that is, during what is called the period of totality, the appearance of the sky round the obscured sun is one never to be forgotten, and it can easily be understood why enthusiasts will cross continents and oceans to view it.
In one moment, the stars spring into visibility and shine as in the evening, and round the jet-black intervening moon there glows softly, from away beyond it, the glorious corona caused by the outermost parts of the sun's atmosphere. This glowing halo of white or silvery hue is sometimes threaded with brilliantly coloured prominences, which consist of masses of incandescent gases shot out from the surface of the sun sometimes for thousands of miles.
A strange hush falls over the land' scape preceded by the conspicuous action of the birds and animals preparing rapidly and excitedly as though for night; while the sky and clouds near the horizon may assume unusual and beautiful shades which outrival those of the sunset or the sunrise.
The engagement of the public forms the heart of his message including a basic description of the eclipse as the moon blocking the sun ably supported by (in the magazine version at least) a clear graphic from Phillp's Splendor of the Heaven to illustrate the process.
The length (from 2:14-4:50 EDT) and rarity of total eclipses of the sun as a once in a lifetime event is adroitly contrasted to other more frequent partial eclipses. Practical safety advice is given clearly directed to “nonscientific persons” to experience the Eclipse through smoked glass with perhaps binoculars and a camera to help enjoy the event. The theme of Blog 109 of all in from McGill is also stressed citing the University’s support of British eclipse expeditions and by organizing both Boy Scouts and airplanes to measure the boundaries of the eclipse. This is the first inkling that we have of the citizen science aspect of this program where non-scientists such as Boy Scouts gather data for scientific analysis.
For Montreal he placed great emphasis on getting the best view possible by documenting locations within the city where the eclipse would pass. He supplied by a map (in the article) showing the path of the central line eclipse across Quebec providing useful advice concerning the best view in along the central line of the eclipse running through Lake St. Peter, near Maskinonge through Magog and Acton Vale in the Eastern townships to the United States.

THE PATH OF TOTALITY ACROSS QUEBEC. This map, from the Journal of the Royal Astronomical Society, shows the position the shadow will occupy in consecutive minutes with adjustment to Montreal Daylight Saving Time. From article by A. Norman Shaw on “The Total Eclipse of the Sun on August 31, 1932”, McGill News, June 1932 p. 3, McGill News, Vol.13, no. 4, 1931-1932 found in A. Shaw fonds, MG 2006 c. 6, file 192, McGill University Archives.
The scientific interest and experiments in gathering data on the phenomenon was also a key element of his work. He cited the use of the spectroscope to analyze vibrations linked to the distribution of light and provide more information on the chemical composition of the sun’s atmosphere. The testing of the bending of light from the stars was explained in terms of testing the validity of Einstein's Theory of Relativity. The measurement of effect of the eclipse on the transmission of electromagnetic waves was framed in the language of his radio listeners as a means to investigate radio signals.
He ended his message on a positive note by encouraging everyone in Quebec to engage in an extraordinary astronomical event as a once in a lifetime opportunity not to be missed. As a Montrealer who experienced the total solar eclipse this past year (2024) I could not agree more with Shaw.
McGill’s A.N. Shaw doing Eclipse Research in Magog, Quebec
Born in England and educated at both McGill and Cambridge, Albert Norman Shaw was a professor in the McGill Physics department. Shaw's research was largely around thermodynamics. Given his connection to Cambridge, along with the McGill aid to setting up the British eclipse research camp in Magog , Quebec, he was able on short notice to secure the aid of Frederick John Marrian Stratton, Professor of Astrophysics at the University Cambridge, to set up his own experiment at the camp. The camp was situated in a better place to capture the eclipse than Montreal.
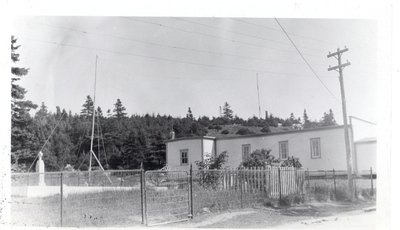
Transmitting station used by A.N. Shaw during observation of solar eclipse, showing St. Patrick's Hall and antenna system 1932ca, Public Domain, PR027437. McGill University Archives
Shaw’s goal was to measure the meteorological conditions during the Eclipse by measuring the variations of temperature and relative humidity. The instrument utilized was a Julien Friez Hygro-Thermograph no. 2250 and measurements were taken every three minutes from 1:24 pm to 5.15 pm.

Apparatus set up indoors for measurement of the eclipse by A.N. Shaw, 1932, Public Domain, PU027427. McGill University Archives
The temperature recording was verified against two thermometers, the time recorded against the official chromograph of the camp and the humidity against the Assman Ventilated hygrometer and the variations duly noted. The results were supplied in a graph.

Photo of graph relating to data from the solar eclipse observed by A.N. Shaw, 1932, Public Domain, PR027439. McGill University Archives.
The viewing of the eclipse in Magog also suffered to a certain extent from the cloud cover but on this hot day with temperatures of 84 degrees Fahrenheit in the shade at 1:20 pm the cloud cover only obscured the first part of the eclipse.

Map showing path across Quebec of the central shadow of the total eclipse of the sun on August 31, 1932, Public Domain, PR027453. McGill University Archives.
For Shaw the possibility of dew on the apparatus was of potential concern to the measurement of future eclipse events He describes his reaction in somewhat unscientific terms as “the sudden disposition of dew on mirrors could seriously effect measurement and constitute an exasperating disturbance." (Shaw, Notes p.36) Thankfully for his experiment at Magog absolute humidity remained at zero as the eclipse approached and the temperature drop and rise during the eclipse was not enough to cause any disruption.
References
Albert Norman Shaw, https://archivalcollections.library.mcgill.ca/index.php/shaw-a-norman-albert-norman-1886-1964
Frederick John Marrian Stratton,https://www.rasc.ca/honorary-member-professor-fjm-stratton
A. Norman Shaw’s “Notes on the Variations of Temperature, Humidity, and Wind during the Eclipse of the Sun at Magog, August 31,1932: with comments on the risk of dew, and the use of temperature observations”, Journal of the Royal Society of Canada, January 1933, University of Toronto Press, 1933.
McGill University’s Eclipse Cruise on the Saguenay
Wilfred Bovey, the Director of the McGill Department of Extra-Mural Relations, and responsible for external education programs organized a cruise to the Saguenay for McGill graduates and others to have a better opportunity to be in the path of the Eclipse. (Eclipse, McGill News, Vol.13, No.4, 1931-1932, p.12 and p.47)
Bovey was virtually born at McGill where his father was H.T. Bovey, a long-time Dean of Applied Science at the University. After receiving his undergraduate degree from McGill he studied law at Cambridge University, practiced as a lawyer in Montreal before enlisting in the Canadian army in the First World War and obtaining the rank of Lt. Colonel. He left the law practice in 1923 to serve as the Secretary for his former commanding officer and then McGill Principal Arthur Currie. (Col. Wilfred Bovey, obituary, McGill News, vol38, No.1, 1956-57)

Captain Bovey (seated in middle) and officers of the 5th Royal Highlanders, Montreal, QC, 1914, Notman and Son, 1914, Notman Photographic Archives, McCord Museum, Object Number: II-206458.
Bovey, the McGill Director of Extra-Mural Relations since 1927, was aware of the eclipse for months as the person who Principal Arthur Currie delegated the task of drafting a letter to the Quebec Premier Taschereau to ask for the Quebec population to have holiday day during the eclipse. (RG 2 c.63 File 0119 File title: Physics: Staff & 1932 Eclipse of the Sun, 1926-1932. McGill University Archives). The close relationship between Currie and Bovey is reflected in this photo of their informal interaction during a Convocation event.

Colonel William Bovey and Sir Arthur Currie at the convocation, unknown date, Public Domain, Photo #: PU002785, McGill University Archives.
While in Montreal the cloudy conditions on August 31st obscured the eclipse, it was quite viewable from Sorel and Louiseville on the St. Lawrence. The McGill cruise ship SS Richelieu from the Canada Steamship Lines with 1000 passengers on board provided a magnificent experience with clear view of the total eclipse from Lake St. Peter, below Sorel.

When the eclipse was happening, the ship slowed down and the decks were full of passengers gazing skywards. Another Canada Steamship, the SS Quebec also provided an excellent view of the eclipse though their return route from the Saguenay.

S. S. Richelieu. Canada Steamship Lines at Murray Bay on Saint Lawrence River [last season of operation]. Murray Bay, Quebec, Canada (864-39), Call Number, WA MSS S-2957, David Plowden Collection, Box, 70. Created August 1964, Yale University Library Digital Collections.
The cloudy skies in the morning meant that many passengers were afraid of missing the eclipse but as the ship entered the St. Lawrence at 4 o’clock the sky had cleared up, the ship slowed down to enable everyone crammed on the decks more opportunity to view the eclipse.
As the Gazette reporter wryly noted passengers were amazed and delighted to find that by taking the Saguenay cruise, they had seen much more of the eclipse than those who had remained in Montreal. (Gazette September 2, 1932, p.19).
For more on the trials and tribulations of the viewing of the eclipse from Montreal see Pallas Lau’s wonderful DRAW blog entitled “McGill and the Montreal Solar Eclipse in 1932”. (https://draw.geog.mcgill.ca/en/connect/blog#Blog102) on the role of the McGill Observatory in the planning for the viewing experience in Montreal.

The McGill News enthusiastically noted in the Eclipse article (p.47) that copies of this photo taken by S.J. Hayward from the deck of the steamship could be obtained from the Department of Extra-Mural Relations by the alumni for 25 cents.
Sidney John Hayward, a British immigrant, was a commercial photographer with a studio in Montreal and the official photographer of the Canada Steamships line. (Library and Archives Canada Blog, posted on October 31, 2019.
The photo also shows a small speck of the planet Jupiter near the far right of the photo. To look for Jupiter This was one of the pieces of advice given by the Dean Arthur Stewart Eve, Director of Physics at McGill in the Gazette on October 31, 1932, as one of the highlights of the event.
McGill University and the Eclipse of 1932: Seizing the Moment
The eclipse of 1932 was a phenomenon of intense public interest in the same way that we have experienced the excitement and wonder of this event in 2024.

A. Norman Shaw of the Department of Physics,1920ca, Photographer: William Notman, Public Domain, McGill University Archives.
While the role of the Observatory has already been highlighted by Amelia Kennan in Blog 102 this is the larger story of McGill University’s involvement in this event locally, provincially, nationally and internationally. The role of McGill physics scientists such as A.S. Eve, A.N Shaw and A. Vibert Douglas on the generation of interest amongst the public for science-based matters is a largely unexplored area of research and a key element in the development and expansion of science literacy education. The administrative records of the McGill Principal Arthur Currie provide wonderful evidence of the whirlwind of activity behind the scenes to engage new audiences and extend collaboration with other scientists.

Dr. Allie Vibert Douglas, as Vice President of the McGill Physical Society, from the Online McGill Yearbooks, McGill Library, 1936, p. 145
The starting point was a letter from McGill scientist A. Vibert Douglas announcing a resolution from the Royal Astronomical Society of Canada recommending that a half holiday be granted to everyone in Quebec to view the total solar eclipse citing its rarity and scientific importance and asking Currie to lobby the Quebec Premier Taschereau for this idea citing the opportunity which this occasion offers to thousands of people to see the impressive celestial spectacle. (RG 2 c.63 File 0119 File title: Physics: Staff & 1932 Eclipse of the Sun, 1926-1932.) McGill University Archives). Currie proceeded to do so and Taschereau agreed to give a half holiday for all provincial employees. Currie also approached the Clarke Steam ship line to acquire free passage for the scientific equipment required and a discount on the tickets of two scientists on the steamship Northumberland. (Ibid)

Sir Arthur Currie, addressing crowd at McGill University, 1930ca, Public Domain, PR000364, McGill University Archives.
The key figure in this drive as far as Currie was concerned was the Dean of Graduate Studies and Research, A.S. Eve.

A. Stewart Eve, Director of the Macdonald Physics Building 1919-1935,1930ca, Public Domain, PR001403, McGill University Archives.
The McGill scientists aided various research groups such as the Joint Eclipse Committee of the Royal Society and the Royal Astronomical Society from Great Britain by directing them to a prime spot directly in the predicted path of the eclipse. To improve their scientific work on the eclipse both Currie and Eve helped this body set up a camp in Magog, Quebec near the McGill camp set up for Prof. A.N. Shaw’s Eclipse data collection with radio observations on the ionosphere and wind patterns. (Ibid)

Buildings at farm where the receiver and the receiving aerial used by A.N. Shaw to record the solar eclipse were located. 1932, Public Domain, PR027420, McGill University Archives.
Frozen Ground: Disruption to McGill student life and Remembrance
Despite the pleasurable aspects of winter as shown in the collage of students enjoying wintertime activities such as skating (and indoor basketball) at the Royal Victoria College, winter extremes also held the possibility of causing the possibility of injury and disruption to the life of McGill students.

Winter sports collage from the Royal Victoria College, Old McGill, 1911, p.117 from the Online McGill Yearbooks, McGill Library.
In the very first year of the publication of the McGill Daily in 1911 a headline SERIOUS ACCIDENT announced that student Billy Mais suffered a compound fracture of his leg due to his fall on some frozen ground on campus while playing ruby.
Mais was famous on campus for his athletic prowess as President of the Boxing Club and member of the English Rugby team. The reporter also carefully noted the speedy ambulance response to the call for aid.

McGill Boxing Club Image, Old McGill, 1913, p. 254 from the Online McGill Yearbooks, McGill Library.
Originally from Kingston, Jamaica, Herbert Roxburgh (Billy or Herb) Mais was born on November 19th, 1890, and educated at Watson’s College in Edinburgh before becoming a Bachelor of Science student at McGill graduating with a B.Sc. in 1913. When interviewed by the dedicated Daily reporter in hospital later in the day he was described as cheerful.

Executive of the Science Debating Society, Old McGill, 1913, p.257 from the Online McGill Yearbooks, McGill Library. Mais is standing at left in rear row.
Mais was also the treasurer of the Science Debating Society and topped off his athletic career at McGill as the Vice-President of the McGill Athletic Association in 1914.

Executive of the McGill Amateur Athletic Association, Old McGill, p.248 from the Online McGill Yearbooks, McGill Library. Mais is seated second from left in the first row.
Like many of his McGill contemporaries he enlisted in the First World War. In October 1914 he joined the Royal Engineers where he became a Lieutenant. He served in France during the war where he was mentioned in dispatches for bravery. He was wounded twice, once in August 1916 and the other at Gonnelieu where he succumbed to his wounds on November 30, 1917, at the age of twenty-seven. His photo in the McGill Honor Roll is shown below.

McGill Honour Roll, 1914-1918 p. 66 https://mcgillremembers.mcgill.ca/ww1/honourroll/1926honourroll_Oct2022.htm
The memory of his sacrifice in the First World War is important to note but sometimes we also have a chance to see more of the individual’s personality despite the lack of formal documentation. These were real people with personal narratives of worth just as all our personal narratives, largely undocumented in traditional archives, is worthy to someone. Mais’ cheerfulness in the wake of a serious injury and the motto that appears under his name in the McGill student yearbook of 1913 (McGill Online Yearbook, 1913, p.145) “None but himself can be his parallel” supplies some evidence of his outlook on life.
Montreal Observatory - Community Weather Research Source in 1912
The headlines from the Gazette on September 30, 1912 spoke to the great variety of seasonal fluctuations in the Montreal weather.
WEATHER WORST FOR MANY YEARS
September Capped the Climax of a Most Unusual Summer Season
SNOW FELL YESTERDAY
Rain on 18 Out of 28 Days and Yesterday Was the Coldest September Day in Nine Years

Rain graphic image is from Pixabay downloaded as a royalty-free image on September 20, 2024.
The Gazette article deep dives into the weather data to produce a picture of the wettest and coldest Montreal summer for 20 years. Clear identification is made of the amounts of rainy days per month during the summer and highlights the smattering of snow in September with the lowest minimum temperature in September for the past 9 years. The total amount of precipitation in September to date was 6.32 inches in stark contrast to the average rainfall for September for the past 37 years has been 3.38 inches.
Where did this detailed statistical information come from? The article provides some clues assigning the quote on the weather during the summer to the weatherman (the nickname for the Director of the McGill Observatory Prof. A.J. Kelly) then cites the source of the McGill Observatory for snowfall in September.
Later on the same page (Gazette, Sept. 30, 1912 p. 5) there is a citation based on research done by the Gazette reporter at the McGill Observatory

Montreal Gazette, ProQuest, September_30, _1912_(Page_5_of Abstract - source the weather ledgers of the Observatory
This abstract upon which the findings of the article were based came because of a field trip to the McGill Observatory where the reporter crunched weather numbers from the best source on climate in the city the McGill weather registers.
The McGill Observatory clearly served as the repository for the history of weather for the city and this important community role provides evidence of the practical uses of scientific research by the Montreal beyond McGill. The Observatory contains the most important source of climate data in Canada and was located on the McGill Campus until 1963 when it was pulled down to make way for the Leacock Building.

Weather observatory (building with turrets) and pumping station (reservoir) from cupola of Arts Building, 1901ca, McGill University Archives, PR028687
The weather sample from Sept 7, 1907, is as close as I can be to the unprocessed weather register images because the ones for 1912 have already been rescued from the analogue ledgers used by the Gazette reporter in 1912 into the database for the DRAW project.

McGill Observatory Weather Ledger - April 28 to May 4, 1907
Once the DRAW project is completed the data rescued will be made available as a data set for additional research with a particular interest being shown by historical climate researchers to create a fuller picture of climate change research.
Most of the data found in the analogue weather registers is buried in this paper-based format and not usable for scientific research. Most climate change research is based on datasets created in the 1950’s onward when databases were first used to gather statistical data on climate change.

Sign up to DRAW https://draw.geog.mcgill.ca/
There is still some work to do to finish this project so sign up to DRAW and enter data using our array of tools guided by our help products. Any data you enter will form a part of a larger data set, but your data is always available in your personal account for your own use.
If you are a volunteer and wish to report on your contribution to research, we have a certificate that will enable you to do so.
30th April 1907 Convocation Ceremony
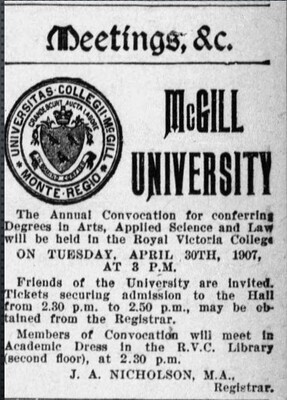
Meetings, &c., The Gazette, April 30, 1907, p.7. https://www.proquest.com
The McGill Convocation, held on April 30th 1907, had not just literal but metaphorical clouds hanging over it. Earlier that month, two major buildings, the Macdonald Engineering Building and the Old Medical Building, had burned down, and the ceremony, according to the Montreal Gazette, “were of a more subdued order than usual”. One photo shows the burned out Macdonald Engineering Building, the facade the only thing left of the aftermath. Many important scientific models and faculty records were destroyed in the Macdonald Engineering Building fire, while the Old Medical Building was home to a museum and library.
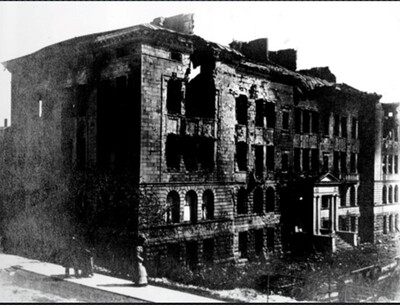
McGill University’s Macdonald Engineering Building after the Fire of 1907, 1907 McGill University Archives, Photo Number PR023149
The weather itself mirrored the gloomy atmosphere. The listed remarks for the day read “Overcast all day with heavy rain”, “Overcast” having replaced a crossed out “Cloudy” — perhaps showing some unrealized hopes from the recorder that the weather would clear up slightly! The recorded temperature at 3 pm, soon after the start of the Convocation at 2:30, was 37.9 degrees Fahrenheit (corrected temperature).
At 3pm it was raining and there was 18 mile (28.9682 km) per hour North Easterly winds, which likely would have managed to cast a gloom through the windows of the Royal Victoria Library where the ceremony was being held.
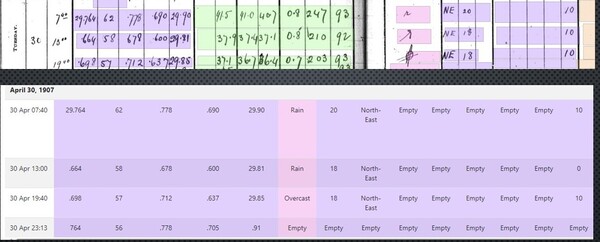
Transcribe | DRAW: Data Rescue Archives and Weather (DRAW Transcription tool) accessed 2024 . 2 images//https://draw.geog.mcgill.ca/en/transcriptions
The photo below of the Royal Victoria Library from the McGill Archives, taken in 1903, shows the room the convocation would have taken place in as it likely would have appeared.
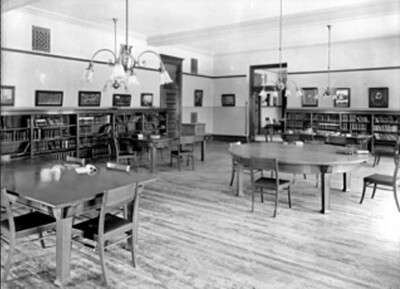
Royal Victoria College, 1903, Library of Royal Victoria College, 1903. McGill University Archives PL006770
Still, the convocation was an anticipated event. Dr. William Osler’s speech addressed the regretful loss of the Macdonald Engineering Building and the Old Medical building, but took a positive tone. According to the Montreal Gazette, Dr. Osler stated his belief that Canadians would help McGill in “rising from her ruins to still ampler progress and prosperity”. The announcement for the Convocation invites “Friends of the University” to the event, and the image from the front of the 1907 yearbook for McGill shows a cheery man dressed in red and gold welcoming friends, family and staff. These happier touches show that the celebration of the graduates was not entirely overshadowed by the sad events from earlier in the month, suggesting a neutral atmosphere.
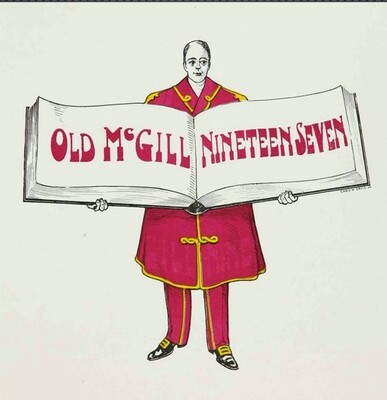
1907 Old McGill Yearbook, 1907, p. 8 McGill Library. https://yearbooks.mcgill.ca/
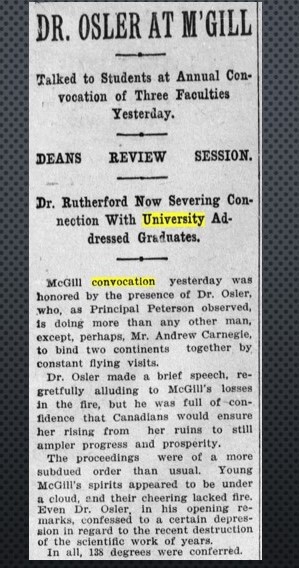
Dr. Osler at M’Gill, The Gazette, May 1, 1907, p.9. https://www.proquest.com
Dr. Osler himself was a celebrated participant in the ceremony. His surprise appearance at the convocation, and his interest in the rebuilding efforts post-fire, took up much of the Gazette article on the Convocation. Osler was a renowned author and public speaker and was additionally known for being one of the founders of Johns Hopkins Hospital. A graduate of McGill, he would go on to donate his history of medicine library to the university. The collection is still held by McGill today.
As the authors of this post are soon-to-be McGill graduates, those attempts at celebration despite the outward gloom of the day stuck out to us. Don’t we all hope for nice weather on our graduation day? The attempts to find cheer in the face of such a rainy, windy, cold day, shadowed by the aftermath of two fires speaks to our own desire to enjoy and celebrate our achievements at the university.
Disruptive Weather: Impact on McGill Student Life more then 100 years ago
Weather events have had a direct impact on the social interactions on the campus of McGill especially as concerns McGill student life. Disruptive events are not the same as extreme events such as the huge natural disaster Ice Storm of 1998; sometimes just a few centimeters of snow or rain can cause changes to planned activities. Vulnerabilities can also change over time as societal priorities evolve.
In 1912 McGill students in their yearbook noted the founding of a Canadian military course with the approval of the Imperial government as a first for a colonial university but predicted with the lack of student interest it would soon be dropped. (McGill, Yearbook, 1912 p. 26). This McGill Contingent of the Canadian Officers' Training Corps created in 1912 is touted in the McGill Milestones as the first such university-based officers' training program in North America becoming a major supplier of military training for McGill students in both World Wars. The creation of this entity could also be viewed as a harbinger of the planning for the First World War, but this is only seen in the context of future developments. The writing of history transposes a set of current events into an object of historical interest that may be interpreted in many ways.
In history, context is the key to understanding events and McGill disruptive events related to sports occurred frequently based on weather conditions.
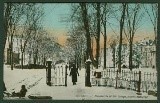
Postcard of the entrance to McGill College in Winter, 1910ca. McGill University Archives, 2005-0069.03.7
On the football front, in 1912 a game between McGill and the University of Toronto was hampered by snow and hail resulting in an ice coating over the venue's seats in Ottawa. (Gazette, November 14, 1912) With the promise of milder weather, a field with a sound drainage system and planning for this venture by the Club secretaries of the two clubs who negotiated with the Ottawa Club for the rental of the field. The flexibility needed to account for the potential weather conditions and to secure a breakeven point in terms is highlighted.
The title of the article stated the game may be played on the night of November 14th with 1000 McGill students and graduates being expected to attend. Despite the reluctance of the reporter to call the game a certainty an advertisement just beside the article announced the cost of the tickets and the train journey from Montreal promoting a round trip for the game leaving November 15th and returning November 16th.
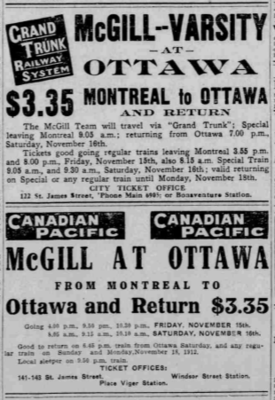
Train Advertisements for Montreal-Ottawa trip for the University of Toronto via McGill football game. Gazette, Online ProQuest, November 14, 1912
In 1913 student hockey games' vulnerability was contingent on weather's impact on outdoor rinks. Even in January, a month famous for Montreal cold spells, the unusually mild weather impacted the home game between Queen’s University and McGill. As reported in the Gazette (January 18th p. 16) this meant the game was sluggish due to the ice being covered by water making it difficult to control or pass the puck. But despite these difficulties the game was continued and completed with frequent breaks. The teams reverting due to this climate event to individual play rather than team play because of these waterlogged conditions.
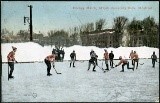
McGill Hockey postcard, 1907, McGill University Archives. 2007-0090.03.3
These adaptations to disruptive events in student sporting events show how McGill students' social lives as players and spectators were impacted by disruptive weather events. Coping mechanisms based on effective planning measures, and flexibility allowed them to mitigate these disruptions by adapting to the climate and adjusting their plans. This remains an indication of how the weather has impacted all our lives both today and yesterday.
McGill and the Montreal Solar Eclipse in 1932
On a day laden with anticipation in 1932, Montreal stood on the cusp of witnessing a celestial marvel—the solar eclipse. This event, fervently awaited by the masses and the scientific community alike, was shadowed by the unpredictability of weather, a theme resonating deeply with the McGill Campus due to its susceptibility to disruptive weather events. Amidst this backdrop, the McGill Observatory, though mentioned briefly, played a crucial role in the narrative through its weather forecasting efforts, epitomized by Professor A.J. Kelly's somber prediction for the day.
August 27, 1932 (page 11 of 22). (1932, Aug 27). The Gazette (1867-2014) Retrieved from https://proxy.library.mcgill.ca/login?url=https://www.proquest.com/newspapers/august-27-1932-page-11-22/docview/2158732545/se-2
The weather's whims highlighted the delicate balance between human expectation and nature's unpredictability. Despite meticulous preparations by astronomers and the city's palpable excitement, Professor Kelly's forecast from the McGill Observatory painted a picture of uncertainty, with a mix of clouds and potential rain threatening to obscure the eagerly anticipated eclipse. This moment serves as a poignant example of the broader implications of weather on significant events, highlighting how even the most carefully laid plans can be at the mercy of environmental forces.
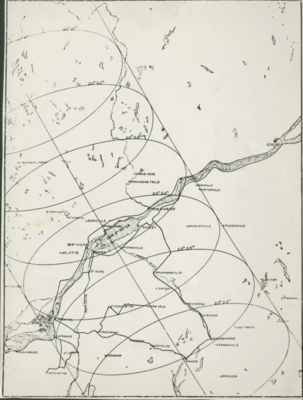
Map showing path across Quebec of the central shadow of the total eclipse of the sun. August 31, 1932. PR024753, McGill University Archives
The effort to make this rare astronomical event accessible to the broader community was marked by Sir Arthur Currie's advocacy. Currie, McGill's Principal and Vice-Chancellor, alongside the Royal Astronomical Society, campaigned for a collective experience of the eclipse, a phenomenon not due to recur for another 360 years. Their push for a city-wide dimming of lights, though not entirely successful in securing a full holiday, underscored a communal spirit aiming to enhance the visibility of the eclipse for all.
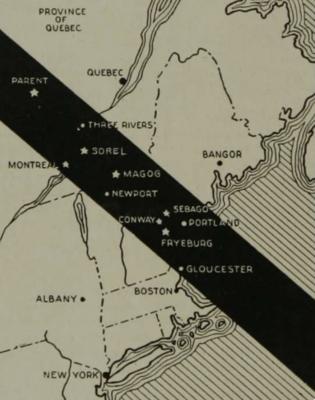
Map showing path across northeastern United States within which the eclipse was total. August 31, 1932. PR024754, McGill University Archives
While the McGill Observatory's mention in the context of the eclipse day was limited to Professor Kelly's weather prediction, it nonetheless underscores the Observatory's role as a vital source of scientific insight and guidance for the community. This event from Montreal's history illustrates not just the anticipation and efforts surrounding the eclipse but also the Observatory's part in bridging scientific understanding and public engagement, however understated it may have been in the grand narrative of the day.
The Total Eclipse of 1932: Photo of the Solar Corona taken by G. Harper Hill at Maskinongé, Québec which is located to the east of Montreal and provided a better view of the eclipse https://articles.adsabs.harvard.edu//full/1932JRASC..26..337H/0000337P006.html
Future Directions for Online Participatory Archives: DRAW (Data Rescue Archives and Weather) provides valuable lessons learned
Gordon Burr, is an adjunct professor in McGill’s School of Information Studies where he specializes in archives and was a founding member of the DRAW Research project in 2015.
Before beginning the talk he made the following land acknowledgment
McGill University is on land which has long served as a site of meeting and exchange amongst Indigenous peoples, including the Haudenosaunee and Anishinabeg nations. We acknowledge and thank the diverse Indigenous people whose footsteps have marked this territory on which peoples of the world now gather.
L'Université McGill est sur un emplacement qui a longtemps servi de lieu de rencontre et d'échange entre les peuples autochtones, y compris les nations Haudenosaunee et Anishinabeg. Nous reconnaissons et remercions les divers peuples autochtones dont les pas ont marqué ce territoire sur lequel les peuples du monde entier se réunissent maintenant.
Presentation by Gordon Burr at the Association of Canadian Archivists Annual Conference in the Exploring Climate Crises through Archives session, Tuesday June 11, 2024. .
Slide 8 McGill School of Information Studies - Archival Courses - McGill Convocation Day Project - Speaking Notes
The goal was to connect McGill Convocation dates to archival materials and weather data transcribed by SIS students. The outreach products created, such as the Blog entry and related Instagram post to advertise the blog, showcased the material, highlighted the data and provided an experience on how to engage communities. If students chose to do so they could submit their work for inclusion in the DRAW Blog.
The blog and Instagram narratives had to be based on a theme or point of view of the student’s choosing and include a description of the weather based on translating the rescued weather data into a narrative form.
The student was now given the experience of being a researcher and connecting weather data with the intent to create an interesting and memorable outreach product.
The blog shown here created by McGill SIS students (Amelia Keenan, Chloe Montpetit, Fiona Enright and Ashleigh Belyea) was the story of Dr. James Grant who was receiving a copy of his degree to replace the one he had lost during the sinking in the foggy St. Lawrence of the Empress of Ireland in 1914 in 14 minutes with the loss of more than 1000 passengers and crew. Grant barely made it to safety. Once ashore he treated the survivors for their injuries as shown in the photo.
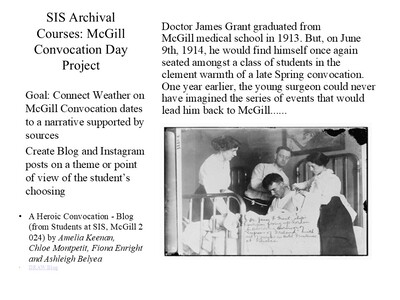
Presentation by Gordon Burr at the Association of Canadian Archivists Annual Conference in the Exploring Climate Crises through Archives session, Tuesday June 11, 2024. Slide 8 McGill School of Information Studies - Archival Courses - McGill Convocation Day Project
Slide 9 Social Media Platforms - Speaking Notes
The DRAW social media platforms the McGill students were utilizing had been developed since 2019. Due to some grant money directed towards science outreach, the expertise provided from students in McGill’s School of Information Studies plus volunteer time once the grant money ran out, we began a social media presence. This was a bootstrap operation learning as we went drawing largely on local standards used in the McGill institutional setting. Kudos to then SIS students and after graduation DRAW volunteers Rachel Black, Jazmine Aldrich and Amelia Keenan for their stellar professional quality work to co-ordinate the DRAW social media program.
DRAW developed several internal policies and guidelines to govern the use of social media including a Hashtags Reference Guide to be applied to the three social media selected Twitter, Instagram and Facebook.
The goal of our social media program was to engage new users and to keep current users coming back to rescue data and participate in the DRAW archival experience. The ways selected to accomplish this were to keep users updated on recent activities, including events such as workshops and improvements to the site. The type of social media platform and content provided was matched to appropriate social media audiences.
The content created by DRAW is often promoted through social media. The blogs produced concern weather and its impact on society, and include guest posts, introductions of DRAW team members, and transcription tips.
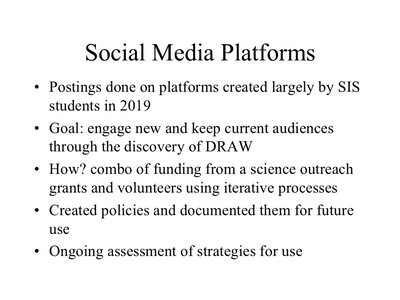
Presentation by Gordon Burr at the Association of Canadian Archivists Annual Conference in the Exploring Climate Crises through Archives session, Tuesday June 11, 2024. Slide 9 Social Media Platforms
Slide 10 Impact of Social media on DRAW - Speaking Notes
The DRAW social media program has proven to be a pleasurable and effective way to engage the public, without the specialized resources required to produce scholarly articles. In an internal study this effort was identified as the primary factor in improving the usage of our web site as shown by an increase (based on 2022 figures) of 51% in new data points and in the number of users by 37% to 617.

Presentation by Gordon Burr at the Association of Canadian Archivists Annual Conference in the Exploring Climate Crises through Archives session, Tuesday June 11, 2024. Slide 10 Impact of Social media on DRAW
Slide 11 Building the Records Keeping Infrastructure - Speaking Notes
DRAW has been concerned about the future of this repository from our beginnings in 2015
We have an open archives information (OAIS) conceptual model as the framework for the construction of our digital repository and tied to the norms related to the preservation of scientific datasets.
As part of this move towards making DRAW a participatory archive we have also been working on the backend to create a records administrative structure replete with internal policies
This is meant to actualize the conceptual OAIS model as not just a data repository but to create a solid online archive including a classification plan, retention schedule and an archiving policy to ensure the long-term preservation and accessibility of our institutional records.
The record keeping policy created by DRAW coordinator Rachel Black in 2020 follows the ISO 15489-1:2016 standard principles concerning the classification disposition and retention of records. DRAW has the additional requirement to document the complex work processes related to the database and the website to ensure knowledge transfer. This documentation is a crucial element in the DRAW experience and consists of a combination of screen shots, to- do lists and videos to help capture elements such as our media policy and pre and post processing of the data.
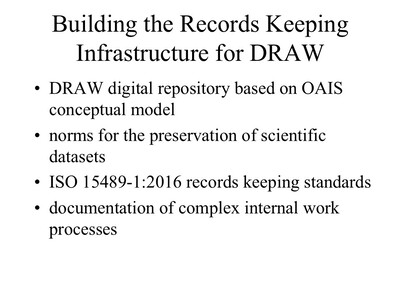
Presentation by Gordon Burr at the Association of Canadian Archivists Annual Conference in the Exploring Climate Crises through Archives session, Tuesday June 11, 2024. Slide 11 Building the Records Keeping Infrastructure
Slide 12 Changing Role for Archivists - Speaking Notes
The question – What is your role as an archivist in science-based research? - has been a prescient one since the beginning of the project. We have provided our expertise with historical records in the creation of appropriate metadata linking the historical roots of the original registers to current day digital file names, embraced the audience engagement outreach opportunities through the creation of social media programs and content and contributed to the various projects as researchers
However, the creation of a participatory archives ambience for DRAW drew on our most basic skills in record keeping, appraisal and access to make these archives safe, authentic and secure. All of this was done to give researchers the opportunity to access these records now and in the future.
DRAW enlarges the outreach role for archivists to make available rescued weather records. We can engage audiences through the prism of a participatory archives where individuals create archival records and then use these records to create their own personal narratives.
There is a public interest in conducting research and producing a narrative. The key goal in archival literacy education is to enable other groups then academic researchers such as undergraduate students to do historical research but the DRAW advantage is that there is a dual opportunity to do both historical research and contribute to a crucial missing element for contemporary weather research: the data rescue of weather sources buried in the archives.
Presentation by Gordon Burr at the Association of Canadian Archivists Annual Conference in the Exploring Climate Crises through Archives session, Tuesday June 11, 2024. Slide 12 Changing Role for Archivists
Connect to DRAW Slide
Thank you! If you wish further information on DRAW or contribute to the capture of weather data please use the contact information provided in the slide.
Presentation by Gordon Burr at the Association of Canadian Archivists Annual Conference in the Exploring Climate Crises through Archives session, Tuesday June 11, 2024. Connect to DRAW Slide
This is the end of Part 2 (and final part) of the Presentation
Future Directions for Online Participatory Archives: DRAW (Data Rescue Archives and Weather) provides valuable lessons learned
Gordon Burr, is an adjunct professor in McGill’s School of Information Studies where he specializes in archives and was a founding member of the DRAW Research project in 2015.
Before beginning the talk he made the following land acknowledgment
McGill University is on land which has long served as a site of meeting and exchange amongst Indigenous peoples, including the Haudenosaunee and Anishinabeg nations. We acknowledge and thank the diverse Indigenous people whose footsteps have marked this territory on which peoples of the world now gather.
L'Université McGill est sur un emplacement qui a longtemps servi de lieu de rencontre et d'échange entre les peuples autochtones, y compris les nations Haudenosaunee et Anishinabeg. Nous reconnaissons et remercions les divers peuples autochtones dont les pas ont marqué ce territoire sur lequel les peuples du monde entier se réunissent maintenant.
Presentation by Gordon Burr at the Association of Canadian Archivists Annual Conference in the Exploring Climate Crises through Archives session, Tuesday June 11, 2024. .
Slide 1 Archival Paradigm Shift - Speaking Notes
In 2015 the DRAW project was created as a McGill multidisciplinary research funded entity with academics from Geography, School of Information Studies, School of the Environment and Computer Science along with archivists to rescue analogue weather data in the McGill Observatory registers (dating from 1873 to 1963) found in the McGill University Archives to transcribe into a database friendly form on a website. The value for climate research purposes was high given the fact that current climate modeling is usually based on data input in databases from the 1950’s onward and the older historical data buried in paper records would provide a more complete picture of weather patterns
We began as a crowdsourcing outreach project tied to a citizen scientist approach. Citizen scientists are members of the public who add scientists to gather data with the most famous weather data rescue application being Old Weather. DRAW has evolved considerably since then to also acquire a participatory archives emphasis, and this talk is about this evolution and the lessons learned along the way.
Partly this change is due to how archivists view themselves. This archivist’s shift clearly stated by Terry Cook in 2013 from a custodial bent to an active participant role working in collaboration with communities including marginalized ones to jointly engage in the archival process was a clarion call for the re-thinking of the profession. Terry Cook, ‘Evidence, memory, identity and community: four shifting archival paradigms’ in Archival Science: International Journal on Recorded Information, 13(2-3), 2013. The loosening of barriers between archivists and their audiences has helped nudge the profession into the participatory archives' mode. The rise of these archives based on WEB2.0 technology, social media and fueled by an increasing amount of digital collections has presented archivists with the opportunity to target user engagement and increase access to their holdings.
Presentation by Gordon Burr at the Association of Canadian Archivists Annual Conference in the Exploring Climate Crises through Archives session, Tuesday June 11, 2024. Slide 2 Definition of Participatory Archives
Slide 2 Definition of Participatory Archives - Speaking Notes
Participatory archives revel in the public participation in the act of “custodial arrangements, collections policy, curation and dissemination, training and consultancy”. New frameworks for community engagement in the archive sector: From handing over to handing on’ in International Journal of Heritage Studies, 16(1-2), 2010.
Archives have utilized participatory archives in a variety of forms including social tagging, commenting, crowdsourced transcription like DRAW and crowdfunding models. BENOIT Edward & EVERLEIGH Alexandra (ed), Participatory archives: Theory and practice, Facet, 2019.
Presentation by Gordon Burr at the Association of Canadian Archivists Annual Conference in the Exploring Climate Crises through Archives session, Tuesday June 11, 2024. Slide 3 Engagement with Communities
Slide 3 Engagement with Communities - Speaking Notes
The emphasis on user and community engagement are the most significant upsides of participatory archival projects. By relying on volunteers and community members to help with the description and processing of records, participatory archives engage the wider community, and a mutually beneficial exchange happens providing for greater relevance for archives. The narrative becomes both more complex and more in tune with the communities the records were about or created by. ’Participatory description: Decolonizing descriptive methodologies in archives’ in Archival Science, 20(2), 2020
DRAW provides the opportunity for our users to keep access to the archival records they have created and use them for their own research ends. DRAW’s community is different, an online one with people having an interest in weather and provided with the opportunity to live a unique archival experience to create archival content for both their use and a larger scientific research community.
Presentation by Gordon Burr at the Association of Canadian Archivists Annual Conference in the Exploring Climate Crises through Archives session, Tuesday June 11, 2024. Slide 4 Participatory Archives: Challenges and Opportunities
Slide 4 Participatory Archives: Challenges and Opportunities - Speaking Notes
The challenges faced by DRAW are those of many online participatory archives especially smaller ones whose funding is limited. The costs of the technology required to keep these smaller archives viable is a significant factor in both their creation and continuation. The creators may also find themselves with a heavy workload to meet deadlines or to keep the archives running. Also new professionals coming into the archival field may also feel stressed about the use of free volunteer labor.
Despite these tensions archives are using the participatory archives model to engage communities, often online, at levels never seen before and emphasize the engagement opportunities of these endeavors. Although community based participatory archives projects vary according to community or audiences targeted it has become the best way for archives to remain relevant now and into the immediate future. How? Seek collaborators, borrow and adapt elements that work elsewhere, and document all your processes!

Presentation by Gordon Burr at the Association of Canadian Archivists Annual Conference in the Exploring Climate Crises through Archives session, Tuesday June 11, 2024. Slide 5 First Step - Building Outreach Capacity
Slide 5 First Step - Building Outreach Capacity - Speaking Notes
When the website was created in 2015, we began to examine the best method and procedures to help our citizen scientist users to enter data in a seamless and accurate way. This process is an iterative one as we continue to learn from our crowd about how to improve this activity. Website usability was a key lynchpin for the success of DRAW. We are an online synchronous archive without the in-person help usually available in most archival settings. Students from the McGill Department of Geography and the McGill School of Information Studies participated in usability testing. This resulted in numerous changes to the data transcription process and the fine tuning of our processes. This was especially helpful in the design of our floating data transcription bar. To recruit new users, we made several outreach seminars in the McGill community.
The goal to motivate members of the public to transcribe visually dense, technical scientific information containing obsolete scientific terms, symbology and abbreviations was accomplished through the creation and testing of our GUI.
User feedback led to other engagement tools such as videos and tutorials, blogs, FAQs and community outreach via social media and workshops.
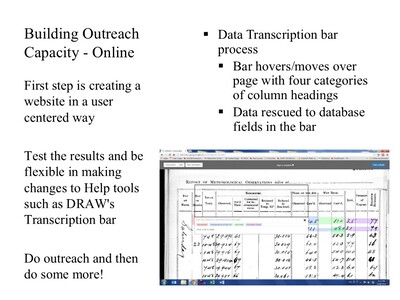
Presentation by Gordon Burr at the Association of Canadian Archivists Annual Conference in the Exploring Climate Crises through Archives session, Tuesday June 11, 2024. Slide 6 Make Use of Educational Applications
Slide 6 Make Use of Educational Applications - Speaking Notes
Although one of the McGill Geography courses was utilizing DRAW as a client option since 2016 the biggest advance in the educational use of DRAW was made in 2018 when the DRAW project became the focus of a curriculum module to engage Dawson College (junior college) students with the citizen science goals of the project.
The pedagogy used in the project was later analyzed in a research paper using a combination of tools including written reflections, video tapings, and exit interviews to measure knowledge translation and the effectiveness of this on-line DRAW experience. Key findings included the importance of the DRAW citizen science experience and the informed use of historical sources to aid in the community engagement process of the students. A component for this knowledge translation was the support provided by the website to encourage students to feel as if they were actively engaged in the process.
The Dawson project created an active learning classroom curriculum with teachers where students link the weather data to contextual historical sources such as newspapers. The requirement for weather related sources to aid the pedagogical experience led to the creation of DRAW’s Educator’s Corner section on our website.
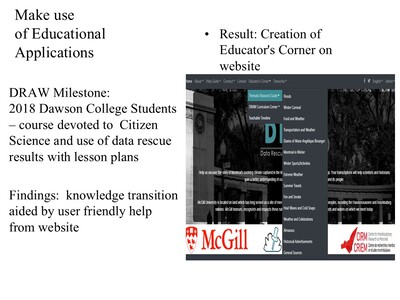
Presentation by Gordon Burr at the Association of Canadian Archivists Annual Conference in the Exploring Climate Crises through Archives session, Tuesday June 11, 2024. Slide 7 Influence of the Crowd and the Pandemic on DRAW
Slide 7 Influence of the Crowd and the Pandemic on DRAW - Speaking Notes
Although we started as a citizen science crowdsourcing project:
The following factors; the influence of the crowd especially the reaction of students to our various educational projects; the pandemic and the shift in archival expectations we become more aware of the engagement opportunities in participatory archives.
In the pandemic especially the dramatic shift away from in-person teaching led instructors to seek online teaching sources pushing DRAW to improve our products and services especially in social media. This was helpful to place the online DRAW archive in a favorable position to help provide relevant content.
The new DRAW lesson plans for archival courses in McGill’s School of Information Studies drew upon previous student experiences including the need to align relevant weather themes with course goals and lesson plans as well as ensure the availability of online contextual sources to support the assignments.
Presentation by Gordon Burr at the Association of Canadian Archivists Annual Conference in the Exploring Climate Crises through Archives session, Tuesday June 11, 2024.
This is the end of Part 1 of the Presentation - The second and final part will be published next week.
Reflections on the Research and Presentation of Three Draw Blogs
Marie-Laurence Caron created three Blogs for the DRAW Project as a Practicum student from the McGill School of Information Studies in 2023. The blogs are on the DRAW site- Rescue Weather Data to help Researchers!, https://draw.geog.mcgill.ca/en/connect/blog#Blog84 Weather and Disruption https://draw.geog.mcgill.ca/en/connect/blog#Blog87 and the History of Weather Observation at McGill University. https://draw.geog.mcgill.ca/en/connect/blog#Blog88 This piece is her reflection on this experience originally done in a video format. We have provided the script and images from the video due to space issues in making the video available online. As part of their practicum, School of Information Studies Students are asked to create a short video on their reflections on the online participatory archives experience of DRAW including search strategies employed, rational behind the selection of three blog narratives and lessons learned.
Here is the script for her video,
Boolean Search
The process leading up to my final project for the practicum at DRAW began with the Boolean Search activity (Fig. 1) I had to do to explore different sources on which was stored useful records and materials that could potentially serve to create outreach posts and materials for the DRAW Archive at McGill. During the Boolean Search process, I was able to see what was there in the databases I queried and searched for this project, and also what wasn’t there as well. By doing a Boolean Search, I was able to discover new themes that were outside of the suggested keywords and terms to use at the beginning of my search
Some examples of the databases I queried for this project included the McGill Yearbooks, (Fig. 2) which included records that had been scanned and archived at McGill. Although the Boolean Search was less effective and impossible to perform on this platform, it was still an interesting resource to consult for images taken of McGill in the past.
McGill Student Publications (Fig. 3) on the Archive.Org website were a bit easier to search for than the McGill Yearbooks I first queried. One the major problems I faced during my search was that the Boolean terms are not recognized as operators in this platform, which mean that if I typed in “McGill” AND “Ice”, for instance, it would include “AND” as a term in my query, rather than rejecting it as a Boolean operator. Even so, this database platform still helped me to find useful content specifically related to events that happened at McGill.
Lastly, one of the databases I was able to explore in this project was the Historical Newspapers Montreal Gazette database found on the ProQuest provider. (Fig. 4) This platform was ideally suited for Boolean search. The Advanced search function, which you can see here allows users to enter separate terms and link them together in a query with the Boolean operators AND/OR/NOT, which ended up being quite useful for me to find relevant materials for the three blog posts I had to write for the DRAW archive later.
Documentation of Search Strategies
The provided keywords words I had received at the beginning of my search seemed at first to be highly relevant to the needs and main purpose of my project. For instance, some of the suggested keywords I had to use for my Boolean search included: “ice and flood” and also “flood” and “damage”, which one would think would return good results when used in a Boolean search in various platforms and databases. However, that wasn’t always the case. (Fig. 5) The key terms and the results returned by the databases varied greatly in terms of relevancy and precision, depending on which one was queried. By starting the process of my project with a Boolean Search, I was thus able to determine which search strategy worked best and which ones didn’t as well. Documenting the search strategies for future users of DRAW was not only helpful for other users on the website, but also to me as well when I had to go back and think about the selection of the three narratives for the next step of my final project. (Fig. 6)
Selection of Three Narratives (Fig. 7)
Once the search strategies were fully developed and prepared, it was now time for me to go back and think about which narratives I would select for my project and also where I would have to go to find relevant materials in databases. The main goal for my practicum project was to find and select three key narratives with themes linked to the weather. (Fig. 8) It had to include disruptive weather events that occurred at McGill and Montreal as key facets of the topics covered, since those are all key aspects that define DRAW as an archive about weather data. The selection of the three narratives thus forced me to think about what makes a narrative stand out for current and prospective users of that archive. Based on the experience I gained in this practicum, the three aspects I determined to be essential to make good outreach materials for an archive were: Variety. Quirkiness. Relevancy. (Fig. 9)
Selection of Three Themes
Next, once I had found the three narratives that fit the three aspects and criteria I had set for myself during this project. I now had to determine the recurrent themes I encountered in the articles and materials that I found. Some questions that arose during this step of my project were: How to best summarize the key themes of a narrative? How to differentiate one story from another? I thus thoroughly analyzed the three articles and narratives I’d selected for my project and answered those two questions, which led me to organize the outline I had to deliver with my identified themes and keywords for review and approval by my site supervisor before I could start to create the three blog posts that would serve as outreach materials for the DRAW Archive.
Outline
Preparing good outreach materials was more challenging than I thought and had planned. Outlining forced me to think not only of the content and key themes of my blog posts which I did for this project, but also about the visual aspects as well, such as the photographs and images I would use, which would be attached with the narratives I’d selected to catch the eye of the users who would then find them on the DRAW website. (Fig. 10) Finding photographs and visual aids for my narratives was a process that forced me to re-think the key themes of my three blog posts since the images attached with the articles I wrote would need to be relevant to what I discussed while also eye-catching to the viewer. (Fig. 11) Outlining was thus something that not only made me think of what I had done so far in the project, it was also a step that forced me to think ahead for what I had to do and what the result would look like, to both the users and the archivists of the archive.
Final Outreach Material
Finally, it was time to write the three blog posts for my project. For me, this was the most satisfying part of the practicum since it allowed me to use all the knowledge, I had learned in the past few weeks at DRAW to then deliver a good final product based on the hard work I had done in the archive and the ideas I had developed and planned with the help of my site supervisor at DRAW. Creativity played a role in making outreach materials for the archive. While writing the three blog posts, I also found additional sources to use which I had not thought about before during my previous search and planning. I was thus able to further link and attach new materials to the three narratives I had selected for my project, which made the content of my final blog posts feel more full and complete, and interesting to the users of the DRAW Archive. (Fig. 12)
Conclusion
In conclusion, what I learned from this experience is first how to make use of the free resources that are available to the archivists working in an archive.(Fig. 13) Becoming familiar with the various databases online which contain free materials and articles related to the ones stored and preserved at archives like DRAW adds value to the search and experience of the user when they come to visit the website of the DRAW Archive to find key data about the weather for their projects or research. By documenting my search process and search strategies, I was able to learn how to point users to resources online, such as databases and online archives, and connect the records they would find on those other sources to the ones they would find at DRAW. Documenting the search strategy was thus a step that involved literacy instruction, which for me is a key task for archivists when they create outreach materials targeted to the users of the archives.
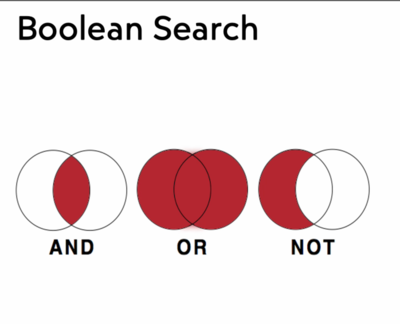
Fig.1 Screenshot from Marie-Laurence Caron’s video on Reflections on the Research and Presentation of Three Draw Blogs.
Fig.2 Screenshot from Marie-Laurence Caron’s video on Reflections on the Research and Presentation of Three Draw Blogs.
Fig.3 Screenshot from Marie-Laurence Caron’s video on Reflections on the Research and Presentation of Three Draw Blogs.

Fig.4 Screenshot from Marie-Laurence Caron’s video on Reflections on the Research and Presentation of Three Draw Blogs.
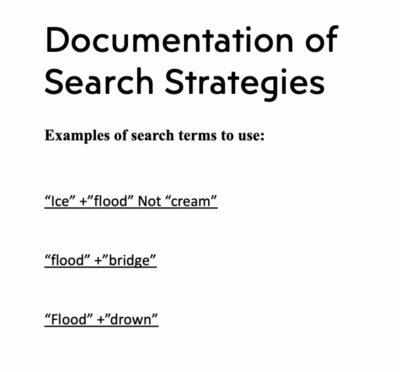
Fig.5 Screenshot from Marie-Laurence Caron’s video on Reflections on the Research and Presentation of Three Draw Blogs.

Fig.6 Screenshot from Marie-Laurence Caron’s video on Reflections on the Research and Presentation of Three Draw Blogs.
Fig.7 Screenshot from Marie-Laurence Caron’s video on Reflections on the Research and Presentation of Three Draw Blogs.
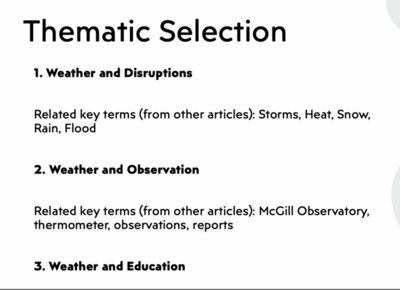
Fig.8 Screenshot from Marie-Laurence Caron’s video on Reflections on the Research and Presentation of Three Draw Blogs.
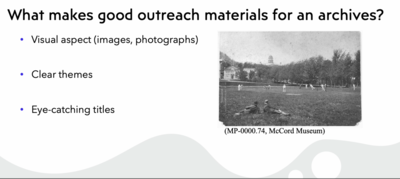
Fig.9 Screenshot from Marie-Laurence Caron’s video on Reflections on the Research and Presentation of Three Draw Blogs.
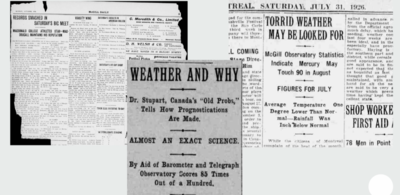
Fig.10 Screenshot from Marie-Laurence Caron’s video on Reflections on the Research and Presentation of Three Draw Blogs.
Fig.11 Screenshot from Marie-Laurence Caron’s video on Reflections on the Research and Presentation of Three Draw Blogs.

Fig.12 Screenshot from Marie-Laurence Caron’s video on Reflections on the Research and Presentation of Three Draw Blogs.

Fig.13 Screenshot from Marie-Laurence Caron’s video on Reflections on the Research and Presentation of Three Draw Blogs.
DRAW Participatory Archives: Reflections on the experience by a Practicum student
As part of their practicum, School of Information Studies Students are asked to create a short video on their reflections on the online participatory archives experience of DRAW including search strategies employed, rational behind the selection of three blog narratives and lessons learned.
Pallas Lau was a SIS Practicum student working for DRAW in the Winter term 2024.
Here is the script for her video,
Welcome, everyone. Today, I’m excited to share with you an incredible journey of discovery, learning, and contribution during my practicum at DRAW McGill, an experience that has profoundly shaped my understanding of archival work and its significance. As a practicum student tasked with exploring historical weather events through McGill's archives, my adventure into the past was both enlightening and inspiring.
Boolean Search
My journey began with a foundational task: the Boolean search. This initial step was crucial, serving as my entry point into the vast historical records and narratives harbored within the DRAW Archive. This process was not just about finding information; it was about uncovering the layers of stories that have been woven into the fabric of the McGill community and Montreal at large.
I approached this project by seeking out specific weather events that I find interesting and outstanding. Firstly, I went to do a Boolean search. Using the database found on the ProQuest provider. I decided to use the Montreal Gazette, Quebec's oldest daily newspaper and the oldest continuously published newspaper in Canada. There were so many stories to choose from, so I had to use special search terms and strategies. Flipping through the archive, you can see centuries of local history, many of it about weather.
Focusing on the positioning of McGill University in the city, I chose to first write about the flood in 2013, named the McGill Flood. I was able to use the search terms of “McGill” and “flood” and “2013” to find as much as I could on the topic.
I was then interested to see if McGill Observatory was involved in the handling of any major weather events in Montreal. Fortunately, I had a list of suggested search terms from DRAW, including a variations of weather indicators like “icy,” “smoke”, and “deluge.” I used the terms “weather” and “Phenomenon” with the AND operator, which brought me to the 1932 solar eclipse. Similar to the 2024 solar eclipse, this one was visible from parts of Quebec, and McGill University was instrumental in the city’s managing of the celestial spectacle.
Finally, I did another search on disasters, focusing on Montreal’s notorious cold weather. You can see here that just looking up “cold” yields many results – this means I should pivot and refine my search. I used the search terms “snowstorm” and “blizzard”, which led me to a fascinating event in 1936 when temperatures in Montreal reached a record low in May. I then was able to learn from the article, and search for more information about the event, including the involvement of McGill Observatory. ("McGill" AND "snowstorm" AND "blizzard").
I documented all my search strategies in a document for DRAW’s future use, so that other volunteers can learn from my search strategies to find interesting narratives surrounding the McGill Observatory.
When I had gathered a group of events that I was interested in, I began to reflect on reoccurring themes and the McGill Observatory’s involvement and impact with the city of Montreal. I did notice that the Observatory used to provide weather readings for the paper, so using “McGill Observatory” as a search term alone yields daily results from several years of the publication. Noting the observatory’s responsibility, I began to write about the cold wave and eclipse events, bringing in evidence of the Observatory’s suggestions and directions for citizens. Nevertheless, I chose my three topics as they seemed the most provocative; I felt that writing about the 1932 would be a timely choice for 2024, as Quebec enjoys another solar eclipse, and that a cold wave in May would provide frustration for Montreal citizens in any years of its history.
Deep Dive into Selected Narratives
Among the many stories I encountered, three stood out for their significance and the richness of the narratives they offered:
The McGill Flood of 2013: See https://draw.geog.mcgill.ca/en/connect/blog#Blog94 This event was a testament to the resilience of the McGill community in the face of unexpected disaster. Through articles and photographs, I pieced together a narrative that highlighted not just the chaos of the flood but the collective effort to overcome it. This story was emblematic of the broader themes of community strength and resilience against environmental challenges.
The 1932 Solar Eclipse: (Check in on September 9th, 2024 for this blog) Delving into this celestial event, I explored its anticipation and impact on Montreal, with a particular focus on the role of the McGill Observatory. The eclipse offered a unique lens through which to view the interplay between science, community, and the natural world. It was a story of collective excitement and scientific endeavor, enriched by the visual aids from Le Samedi, which captured the public’s imagination and engagement with the event.
The Cold Wave of 1936: See https://draw.geog.mcgill.ca/en/connect/blog#Blog96 This narrative highlighted the unpredictability of weather and its immediate effects on daily life in Montreal. Through the records and data from the McGill Observatory, I explored the implications of such extreme weather events on the community, drawing parallels to contemporary concerns about climate change and environmental resilience.
Crafting Outreach Materials
The culmination of my research was the creation of three blog posts, each telling the story of the selected narratives with a focus on their historical and contemporary relevance. These posts were designed not just to inform but to engage the DRAW McGill audience, connecting them with the past in a way that was both educational and compelling.
The process of writing these posts was an exercise in creativity and synthesis, requiring me to weave together facts, narratives, and visual aids into cohesive and engaging stories. It was a challenge that pushed me to apply all the skills and knowledge I had acquired during my practicum, and the result was deeply rewarding.
Conclusion
Reflecting on my time with DRAW McGill, I am struck by the profound sense of purpose and responsibility that comes with archival work. It is a role that extends beyond the mere preservation of history; it is about making history accessible and meaningful to the wider community. The opportunity to contribute to this mission, to be a part of a team dedicated to the democratization of historical data, has been both humbling and inspiring. This practicum has not only enhanced my skills as a researcher and writer but has also deepened my appreciation for the power of archives to connect us with our past, inform our present, and guide us toward the future. As I move forward in my academic and professional journey, I carry with me the lessons learned and the inspiration drawn from this incredible experience.
Thank you for joining me on this journey of discovery, learning, and connection. It was an unforgettable adventure, one that has left an indelible mark on my understanding of the importance of archives in preserving and sharing our collective memory
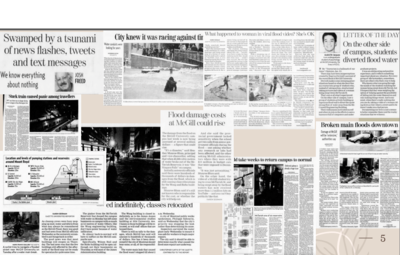
Collage of images on the McGill Flood of 2013 from the Montreal Gazette, dated January 29-30, and February 2, 2013, from the Gazette Pro Quest newspapers, created by Pallas Lau.
Cloudy and Cooler Weather but a historic celebration on Convocation Day
One could say that studying the weather involves an attempt to glimpse at the future. Weather forecasts are the predictions influencing our plans and choices and our expectations and attitudes for the day to come. In the top-left corner of the front page of the June 9th, 1922, edition of The Gazette (Figure 1), the weather forecast for the day simply reads: “cloudy and cooler” (“Weather Forecast”, 1922). Similarly, on the eve of the ceremony, the soon-to-be law and medicine graduates gathered at the new medical building to hear the class prophets share their own predictions. Instead of overcast skies, the class prophets foretold successful careers, shifts towards profitable or dubious enterprises, and even the “humorous” prospect of a feminist future (“Medicine and Law Heard Prophecies”, 1922).
Predictions are often most interesting in hindsight. For instance, the weather forecast on June 9th, 1922, predicted a gloomy and colder summer day. Yet, that day marked a grand celebration, a bright and joyous moment that would go down in McGill history. That spring, five brave and determined young women – Eleanor Percival, Jessie Boyd, Lilian Irwin, Winifred Blampin, and Mary Childs - were the first women to receive their medical degrees at McGill. They can be seen in Figure 3 standing in the front row alongside their cohort. The cooler June weather, however, was suited to the frosty relations behind the photo. Their male peers, who vastly outnumbered them as the yearbook photo showed, were quite vocal in their disagreement with the women’s acceptance into the program. Earlier in their studies Miss Boyd’s house had been picketed by many of her male peers who demanded she and the other four withdraw from their studies.
Elements from archives such as this photo allow us to look back in history and see just how our political climate has changed alongside the meteorological weather, an element subtly present to some degree in most photographs, and one that can tell us a lot. In recent years the power of citizen science in sourcing and making sense of data for archives has been harnessed more and more by organizations. The draw of the archive as a place for widening one’s perspective and learning about history is already attractive, and the beauty of participatory archives is the way they allow users to engage directly.
DRAW is an archive of scientific records sourced directly from the McGill Observatory and transcribed by members of the community. Beyond allowing for collaboration and participation, DRAW helps us capture data-based markers that allow us to understand weather conditions. This data allows us to interpret and speculate how that weather impacts human experience. The weather impacts our daily lives from the activities we do to the clothes we wear. It can significantly influence the course of our day. For example, the McGill Convocation on June 9, 1922, was a cloudy Friday with some heavy morning showers. The images chosen from a 1921-1922 copy of The McGill News display black and white photographs of 1922 McGill graduates in their caps and gowns (Figure 4 & 5). In one image, the graduates are lined up to go into The Convocation Hall (Figure 4). As a participatory archivist of DRAW, one may speculate that the grounds were muddy from the earlier rainfall. In another image, graduates convene outside The Convocation Hall (Figure 5). Understanding the weather data and observing accompanying images may lead one to question whether the rainfall and cooler weather impacted the event's attendance. Nevertheless, these specific images were selected to underscore the influence of weather data on our everyday experiences.
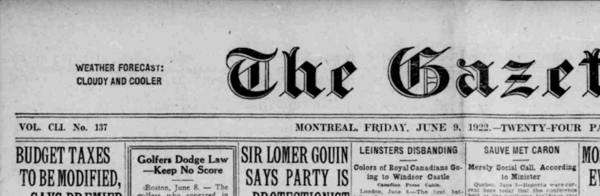
Figure 1: June 9, 1922 (Page 1 of 24). (1922, June 9). The Gazette (1867-2010). https://www.proquest.com/historical-newspapers/june-9-1922-page-1-24/docview/2150856917/se-2
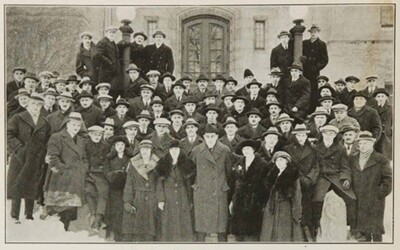
Figure 2: Old McGill. (1923). Medicine Class of ’22 [Photograph]. McGill Yearbook 1923, 1922-1923. McGill University Library. Montreal. p.54 https://yearbooks.mcgill.ca/viewbook.php?campus=downtown&book_id=1923#page/60/mode/2up
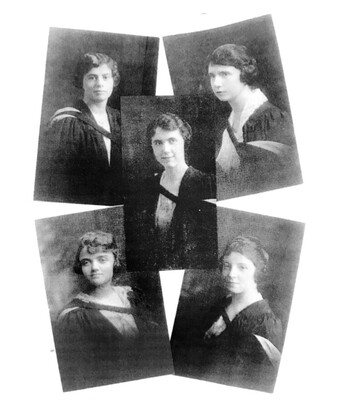
Figure 3: Lilian Irwin, Jessie Boyd, Winifred Blampin, Eleanor Percival and Mary Childs [photograph](1922). Healthenews.mcgill.ca/. https://healthenews.mcgill.ca/100-years-ago-mcgills-first-female-med-grads-received-their-hard-won-degrees/
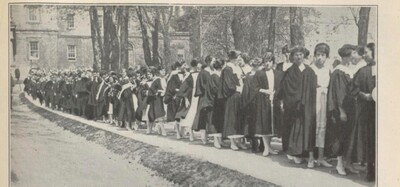
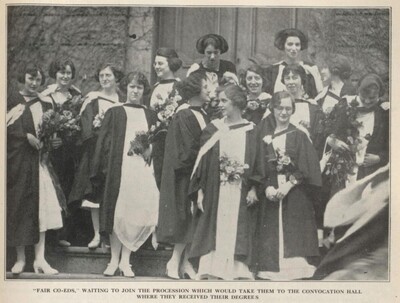
A cold wave
In a twist that seems to defy the natural order, Montreal found itself wrapped in the cold embrace of winter, even as calendars marked the time for summer's warmth. This peculiar weather phenomenon, a mingling of seasons out of step with expectations, prompts a reflection on the unpredictability of weather and its profound impact on the community, as observed through the lens of the McGill Observatory's records.
The month of June, often heralded by the warm embrace of summer, presented an anomaly that left even weather reporters puzzled. James Russell Lowell's musings on the rarity of a day in June took on a new meaning as the city experienced its coldest temperatures in three years, with a startling minimum of 43°F. This departure from the norm was not only a record for recent Junes but a clear indication of the unpredictable dance of climate patterns. Even more startling was the belated blizzard that blanketed the city in May, breaking all records for the month since weather recording began in 1875. With 1.3 inches of snow falling and temperatures fluctuating wildly, Montrealers were forced to reconsider their expectations for the season. This event, unprecedented in its timing and intensity, underscored the variability of weather and its capacity to disrupt daily life, challenge preparedness, and even affect the natural cycle of planting and growth in gardens.
The McGill Observatory, standing sentinel over the city's climatic rhythms, provided critical data that not only documented these unusual events but also offered insights into the broader trends at play. Through the observatory's records, we are reminded of the delicate balance between human expectation and the natural world's inherent unpredictability. These events serve as poignant examples of how climate patterns can defy expectations, leaving a mark on the collective memory of the community and challenging the notion of seasonal norms.
As the city navigated the unexpected return of winter conditions, the role of the McGill Observatory became ever more critical. By offering forecasts and documenting these anomalies, the observatory underscored its pivotal role in the community—not just as a source of meteorological data but as a beacon of knowledge that informs, prepares, and sometimes even astonishes its audience. This intersection of science, expectation, and reality highlights the importance of continued observation and study of our changing climate, a task to which institutions like the McGill Observatory are indispensably suited.

May 21, 1936. Page 4. Gazette. Belated Blizzard Blankets City, Breaking all records for May. ProQuest Historical Newspapers, Montreal Gazette Online.
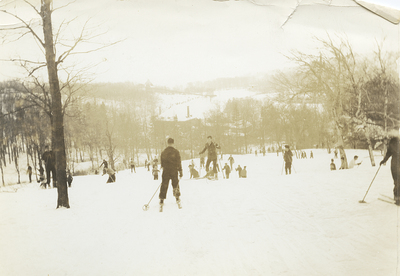
Skiers on Mount Royal, Montreal QC, 1936. Photographer: Harry Sutcliffe (1878 - 1942) Date:1936/01/12 Object Number: M2011.64.2.4.210 McCord Museum, Gift of Peter, Paul, Robert and Carolyn Sutcliffe.
Mild Temperatures at McGill’s 1914 Convocation, But Weather Anomalies Around the World: Comparing DRAW data to Historical Newspapers
The date is May 12, 1914. McGill’s downtown campus is abuzz with the annual convocation ceremony (fig. 1). Graduates mill about, happy for their long ceremonial robes in the cool spring weather, and proud family members wear the latest summer fashions from Henry Morgan (fig. 2). Chatter about a new McGill stadium floated about the convocation ceremony (fig. 3) The Montreal Gazette reported a record number of degrees being awarded this day, yet politely assured readers that the lengthy processions were not too tedious. As a souvenir, the families might have brought home a postcard showcasing an idyllic university on a calm, sunny day (fig. 4).
Unlike the cool weather framing McGill’s convocation, around the globe, the conditions are less hospitable. Tornadoes, heavy storms, and ice fields are reported in the Montreal Gazette on this very same day.
The DRAW project aims to digitize the data collected by the McGill Observatory over the years. The observatory, pictured in a twentieth-century postcard as a highlight of the McGill campus (fig. 5), was erected in 1863. Records from the DRAW project’s logbooks allow us to look at the data as a whole or focus on one day for a more detailed historical weather forecast. On May 12, 1914, the day of the Convocation, Montreal was overcast with highs of 54º F in the afternoon and lows of 41º (fig. 6). The logbook record includes technical data and descriptions of the conditions that help piece together the climate of the past. Even in May of 1914, the McGill observatory’s data was used to decipher patterns in the weather. Apparently, May’s rainfall was only 5% of the 32-year-average that year, leading to droughts in the area, according to the Montreal Gazette. This led to forest fires, and while there were no clouds, the smoke and weather conditions led to decreased sunlight.
At the same time as this logbook’s creation, the public could get weather information from their local newspapers. Reporting on weather included a small feature on the front page of the Montreal Gazette, which debriefed on the previous day’s conditions. Moving beyond Montreal, the paper also reported on weather across Canada, which was said to be “fair and cool” on the 11th of May (fig. 7). More exciting news, about extreme and disastrous weather, was reported from across the globe.
Devastating Tornado in Wisconsin
A devastating tornado swept through southern Wisconsin on May 11, 1914, leaving in its wake four casualties, several injuries, and nearly $1M in damages (fig. 8). In some places, the tornado stretched three miles wide. “The storm reportedly blew a cement block through the roof of Stoughton High School, toppled the scaffold at the ski jump, and blew down all the phone lines in northern Albion township” says the Koshkonong Prairie Historical Society. See https://www.facebook.com/KoshPrairie/photos/a.494790447266041/2886343464777382/
Record Rain in Michigan
On May 12, 1914, a rainstorm lasting over 36 hours fell on Michigan, creating a new record for the month of May (fig. 9). The over three inches of rain that fell on Detroit flooded parts of the city, damaging property. In its outskirts, the countryside also flooded, damaging farms. One death was reported.
Snowstorm in Australia
Snow in Sydney is a rare affair, but on May 11, 1914, the city received 1 inch of snowfall after days of diluvian rainfall (fig. 10). Sydney’s inhabitants were surprised to wake up to discover a blanket of snow covering their city on May 12th. The last report of such atypical weather had been recorded almost 100 years earlier, in June 1836. See https://www.dailytelegraph.com.au/news/from-ancient-frogfalls-to-modern-fish-rains-theres-snow-way-to-forecast-weird-weather-events/news-story/878246bded5e5d68c884000cee3dbae7
Massive Ice Fields on Newfoundland Coast
1914 was a tough year for the coast of Newfoundland. In March, a blizzard stranded and killed 132 sealers of the SS Newfoundland, and shortly after, at the beginning of April, another Blizzard (See https://www.heritage.nf.ca/articles/politics/sealing-disaster-1914.php) sank the SS Southern Cross and killed 173 of its men. Barely two months after the terrible icy events, Captain Agassiz of the Uranium steamer reported unusually large icefields of 450 feet on the coast of Newfoundland, making navigation hazardous in the region (fig. 11).
Weather data can be useful for animating specific historical events, like the McGill Convocation, where we can construct a vision of the past based off its cool, cloudy days. Looking out at the campus now, we can re-imagine what McGill would have looked like on a spring afternoon over one hundred years ago. However, the DRAW project allows us to manipulate this data in new ways, revealing patterns in the climate over time. This could only be done through the transcription of data.
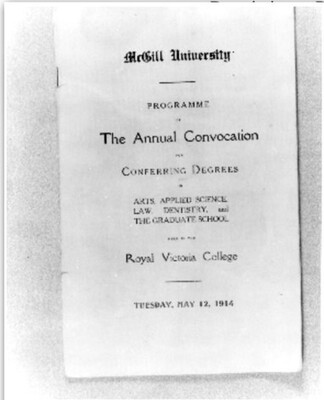
Figure 1: McGill University Convocation Programme, May 12, 1914. Montreal: McGill University Archives, PR001155.
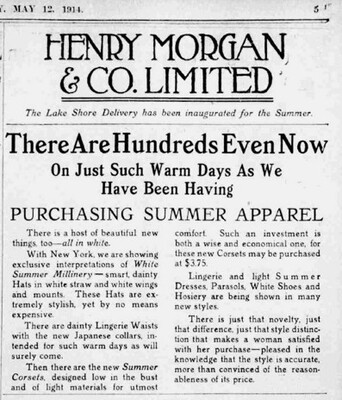
Figure 2: Advertisement for Henry Morgan and Company. Montreal: The Gazette. May 12, 1914. Page 5. Retrieved from Proquest Historical Newspapers
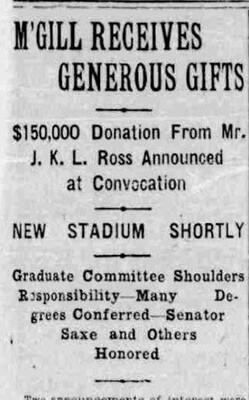
Figure 3: McGILL RECEIVES GENEROUS GIFTS. Montreal: The Gazette. May 13, 1914. Page 11. Retrieved from Proquest Historical Newspapers.
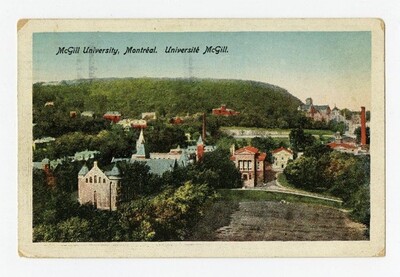
Figure 4: McGill University, Montréal, Université McGill. c. 1903-1926. Post card. Montreal: Bibliothèque et Archives nationale du Québec. https://collections.banq.qc.ca/ark:/52327/2282732.
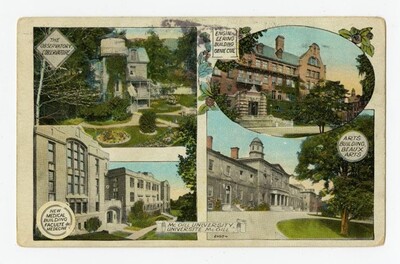
Figure 5: McGill University. Université McGill. c. 1922-1926. Post card. Montreal: Bibliothèque et Archives nationale du Québec. https://collections.banq.qc.ca/ark:/52327/2386308.
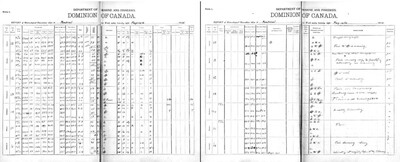
Figure 6: Logbook from the McGill Observatory. Week including May 12, 1914. DRAW Project. https://draw.geog.mcgill.ca/.
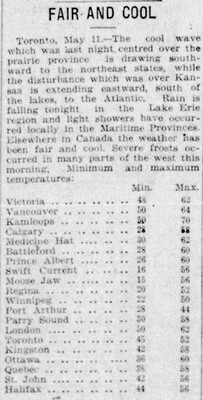
Figure 7: FAIR AND COOL. Montreal: The Gazette. May 12, 1914. Page 5. Retrieved from Proquest Historical Newspapers.
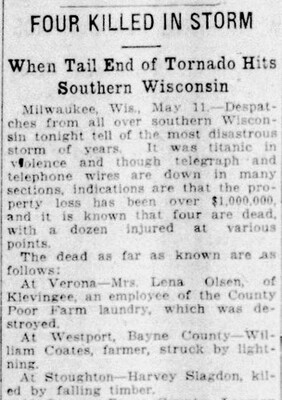
Figure 8: FOUR KILLED IN STORM. Montreal: The Gazette. May 12, 1914. Page 3. Retrieved from Proquest Historical Newspapers.
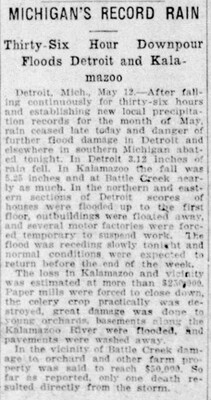
Figure 9: MICHIGAN’S RECORD RAIN. Montreal: The Gazette: May 13, 1914. Page 8. Retrieved from Proquest Historical Newspapers.
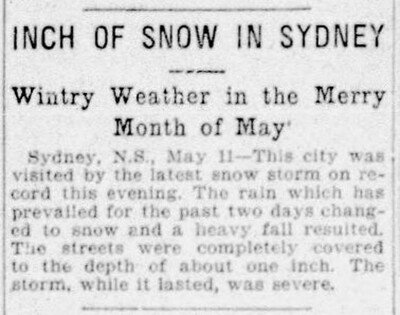
Figure 10: INCH OF SNOW IN SYDNEY. Montreal: The Gazette. May 12, 1914. Page 3. Retrieved from Proquest Historical Newspapers.
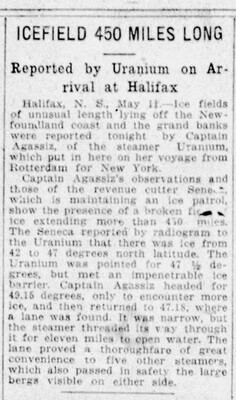
Figure 11: ICEFIELD 450 MILES LONG. Montreal: The Gazette. May 12, 1914. Page 1.Retrieved from Proquest Historical Newspapers.
On McGill's Great Flood
On January 28th, 2013, the McGill University community confronted an extraordinary challenge when a burst water main transformed parts of the campus into aquatic landscapes. The waters surged down McTavish Street, as if attempting to rewrite the storied history of the university in a single stroke. Captured dramatically by onlookers, images of students navigating the treacherous currents made headlines, symbolizing the event's suddenness and severity (Montreal Gazette, January 29, 2013). The day's chaos, later coined as “McGill’s Great Flood,” halted classes, displaced research, and stirred the McGill community into unified action. As the water rose, so did the students and staff, embodying the resilience and resourcefulness that are hallmarks of the institution (Montreal Gazette, January 30, 2013).
Yet, amid the unexpected torrents, one is reminded of McGill's longstanding commitment to understand and disseminating weather information—a tradition deeply rooted in the history of the McGill Observatory. Established in the 19th century, the observatory once stood as a vanguard of meteorological study in Montreal, diligently recording weather patterns and educating the community long before digital archives and online databases became the norm. This historical dedication to weather observation reflects a broader commitment to public service and knowledge—a theme that resonated profoundly during the 2013 flood. As water coursed through the streets, McGill's ingrained sense of responsibility to its community was palpable. Students and faculty pooled efforts to minimize damage, protect vital resources, and maintain a semblance of continuity amidst the chaos. The flood, while a singular event, cast light on broader themes of urban resilience and the impact of environmental events on community life. It underscored the interconnectedness of McGill's campus with the life of Montreal, a city that itself has weathered many storms (Montreal Gazette, January 30, 2013).
Digital and social media played an outsized role in the dissemination of information during the flood, with videos and photographs sparking conversations and bringing the community together in support and solidarity (Montreal Gazette, February 2, 2013). In a way, these platforms served a purpose akin to the observatory of old—providing crucial information in real-time, rallying community action, and documenting a moment of significance.
As the waters receded, and the campus slowly returned to its usual rhythm, the 2013 flood remained as a marker of both vulnerability and strength. It was a live demonstration of the kind of immediate, disruptive impact that weather can have—and a testament to the importance of preparedness and knowledge. In the spirit of the McGill Observatory's legacy, the Great Flood has become part of the university's continuous narrative of engagement with the forces of nature. It serves as a modern chapter in the ongoing story of how the institution and its people rise to meet challenges, armed with the wisdom of history and a collective resolve that looks beyond the immediate horizon.
Today, as we navigate through the ebb and flow of campus life, the resilience demonstrated in 2013 remains a wellspring of inspiration. It reminds us that while the McGill Observatory’s role as a physical entity has evolved, the commitment to service and the dissemination of weather knowledge continues to be as relevant as ever woven into the very fabric of the McGill community.
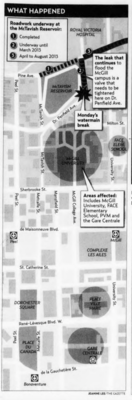
The Gazette, February 2, 2013
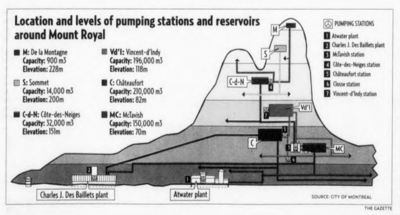
The Gazette, February 2, 2013
McGill Convocation 1913 Through the Lens of Weather Data
The sun rose on a chilly spring day on the morning of May 13, 1913. The Gazette had predicted showers; the McGill Observatory, at 8 o’clock that morning, had recorded a minimum of 46.6F -- the day would see a maximum of 56.2F. Overhead, cirrocumulostratus clouds were darkening the sky over Montreal. None of this deterred the attendees of a momentous occasion at McGill University: Convocation Day.
At Royal Victoria College, the crowd of black-robed graduates braced against the chill and threat of rain with college songs and class yells, maintaining a “general note of optimism and progress” (The Gazette, 1913). This was tempered only when Principal Peterson gave the news that McGill, without the gift of another $100,000, must delay the construction of a new gymnasium and campus; instead, he looked forward to the day improvements could be constructed, and suggested they be named Macdonald Park (The Gazette, 1913). The guest of honor that afternoon was Sir William Osler, who reflected on his past at McGill and looked to the future, and to the growth of the university on the world stage (The Gazette, 1913). Closing the event, Principal Peterson looked forward to the convocation of 1921, when McGill would celebrate its centenary, and “returning graduates would see a newer and finer McGill and glory in her achievements” (The Gazette, 1913). Despite the cloudy day and the brisk air, for the graduates, the outlook was bright.
Examining archival records provides a tantalizing look into the events of days past. As participatory archivists, 111 years later, it is impossible to read the newspaper account of that day without a sense of foreboding; the very next year would see the outbreak of World War One, during which many of the class of 1913 would have fought. Many of their number, along with Dr Osler himself, would not live to see the centenary of 1921, or would return to McGill having experienced one of the deadliest wars in human history. Examining records such as the weather recorded by the McGill Observatory allows us in 2024 to go beyond the written account and reconstruct some of the sensory experiences lived by those present on that day. To the historian, such details draw us closer to our predecessors, and help us construct a richer and more detailed understanding of their lived experience.
However, understanding past weather conditions goes beyond historical curiosity. Significantly, this data is crucial to scientists who seek to compare weather in the past with our current climate, and track changes as our world warms. 111 years later, we are living in a much warmer world. As new heat records are set every year and zombie fires linger under the snow (Yousif, 2024), our own convocation day, in May of 2024, is likely to far outstrip the conditions of that chilly day in 1913.
Ultimately, this data underscores the importance of archival preservation and accessibility. The weather logs, meticulously recorded by the meteorologists of the McGill Observatory and now preserved in the DRAW Archive, provide crucial information that will enrich the research of historians and climate scientists alike.
The Gazette, May 13, 1913, p. 1.
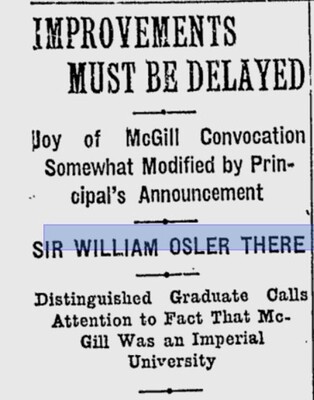
The Gazette, May 14, 1913, p. 13.
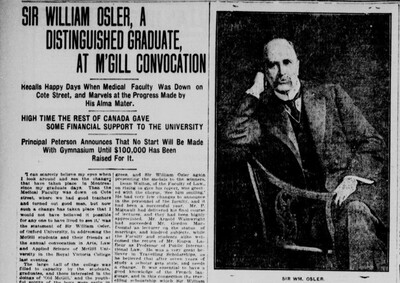
The Montreal Daily Witness, May 14, 1913, p.10.
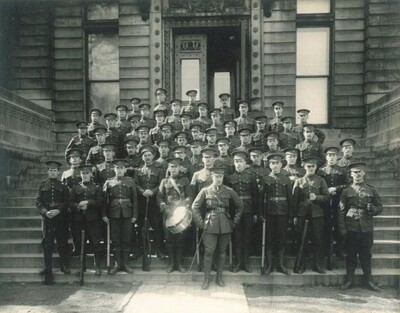
Members of the University Company Regiment on the stairs of the Redpath Museum in 1915 (from Wes Cross, (2022, November 10.) McGill in the First World War. McGill Reporter. https://reporter.mcgill.ca/mcgill-in-wwi/
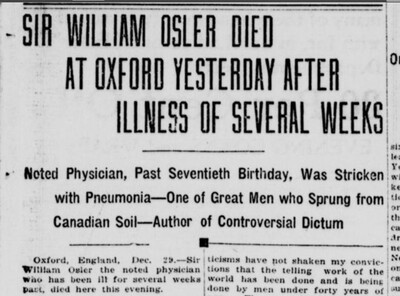
The Québec Chronicle, December 30, 1919, p.1
Rosy Hues Appear Through Clouds of Depression
Opening the DRAW McGill weather ledger to Monday the 21st of May 1933 we find that the high of this day in Montreal was a fair and warm 20°C. The low of this day was a mild 12°c but despite the 10.4 hours of bright sunlight recorded its likely that the wage-earning population of Montreal was likely not feeling terribly enthusiastic about Spring. The effects of the Crash of 1929, otherwise known as The Great Depression, were casting an ongoing pall on the city.
Samuel Bronfman, who would donate the building named in his honour to house the McGill Desautels Faculty of Management in 1971, was not untouched by the financial crisis. In 1933, Bronfman was a ‘trustee at large’ for the Jewish Federation of Philanthropies of Montreal at whose annual meeting on the 21st of May, news of a $40,000 accumulated budgetary deficit for 1931 and 1932 was announced. A sum worth almost $900,000 in 2024. Despite a concerted community effort, a shortfall in fundraising of $55,000 in 1932-33, meant that the financial outlook for the charity was bleak. An outlook made bleaker still by the fact that a reported one third of the Montreal population was dependent on direct relief from the government for unemployment at the time.
However, despite the discouraging financial outlook, according to the Montreal Gazette, some rosy hues were appearing through the clouds of depression. One rosy hue was the posting of the McGill ‘final year lists’ announcing that 500 degrees would be awarded on the Thursday of that week while 48 diplomas and certificates would be distributed at a later “little” convocation. Ten of the degrees awarded were a bachelor of ‘Library of Science’, (a course that is now taught as a master’s degree, students of which are frequent DRAW volunteers), all ten of these degrees were awarded to women.
In 2024 all McGill degrees are open to both men and woman but an announcement that one McGill school had decided to become co-educational provided something of a buzz in 1933. The surprising heading on the May 22nd edition of the Montreal Gazette reads “McGill to Make Drastic Changes.” One of these drastic changes was to raise the diploma requirements of the School of Physical Education. From 1912 until 1933, only women were trained at McGill to become teachers of physical education which up until then had been considered something of a ‘mere frill or a fad’ and therefore only deserving of a two-year diploma. By 1933 however, the demand for P.E teachers with ‘deeper training’ had become such that it was felt a graduate degree in arts or science was a more fitting pre-requisite. Which potentially led to the second change which was of course ‘To Admit Men Students’ into the program, though no further explanation or commentary is given in the Gazette article on this decision. The first two male students, Hugh James Purdie and Tom Schofield would graduate from the McGill Physical Education program in 1937.
The week of May 21st, 1933, while still under the cloud of the depression, was nevertheless fair and warm and indeed full of rosy hues appearing through the clouds, for McGill students in particular.
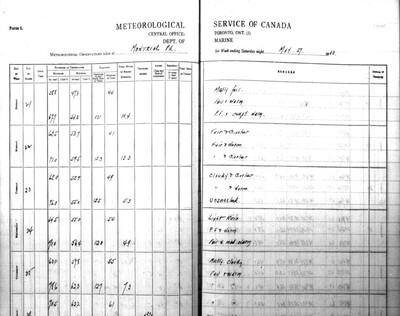
DRAW ledger page 2, May 21-27, 1933.
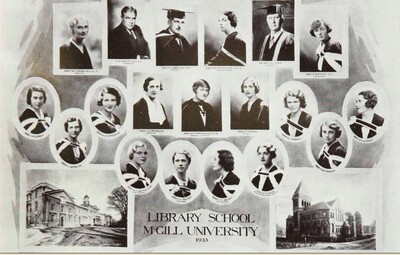
McGill University Library. McGill Yearbooks, 1933. The Library School, p.197. Photo Collage.
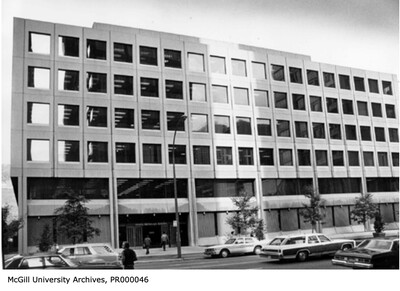
McGill University Archives. Description: Samuel Bronfman Building, corner of Sherbrooke and McTavish, 1975ca. Copyright unknown #PR000046. Photograph.
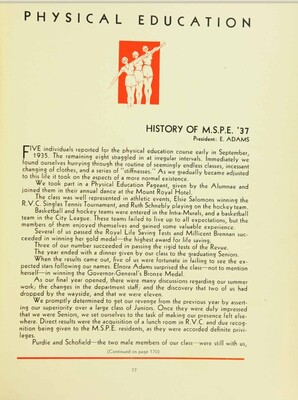
McGill University Library. McGill Yearbooks, 1937, Physical Education, p.77. Text.
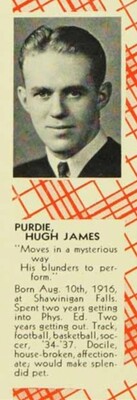
McGill University Library. McGill Yearbooks, 1937, Physical Education, p. 78, Purdie, Hugh James.
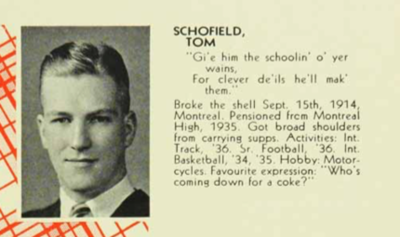
McGill University Library. McGill Yearbooks, 1937, Physical Education, p. 79, Schofield, Tom.
A Heroic Convocation
These four students in the McGill School of Information Studies created this blog as part of their 641 Archival Description and Access coursework in 2024.
On June 9th, 1914, on an overcast but otherwise fine afternoon, a young man adjusted his clothing against the gentle breeze pushing fluffy cumulus clouds across the sky and joined the crowds gathering at the Royal Victoria College. It was late spring in Montreal and while the man had enjoyed the afternoon breeze and the temperate 22 degrees celsius heat on his walk to the venue, by the time he had reached his destination, the relative humidity had crept up to a slightly uncomfortable 65%. Adjusting his clothing once more, 27-year-old Doctor James Grant found his seat just before 3pm amidst a sea of black robes and listened as Dean Harrison commenced lauding the school's recent benefactors and clapped politely as graduates of the agriculture school were awarded their degrees. The Doctor waited patiently for his cue to join the McGill convocation ceremony, but the man born on Christmas eve in a small Vancouver Island suburb wasn’t present on this day as a benefactor, or a graduate or even as a faculty member. Doctor Grant had in fact already graduated from McGill’s medical school the previous year but the events that led to his presence at this Spring convocation ceremony will absolutely astound you!
On May 28th, 1914, a mere two weeks earlier, Doctor James Grant had been too preoccupied with preparing his starboard cabin for a week’s long voyage to Liverpool to take much notice of the weather. As the ship's surgeon, Doctor Grant had been busy checking and double checking his medical supplies and surgical instruments as the ship's other 1,476 passengers and crew had made themselves comfortable for departure. Nevertheless, it was a fine afternoon as the Canadian Pacific liner Empress of Ireland sailed away from Quebec City down the Saint Lawrence river on a course to Liverpool. As night fell, Doctor James Grant turned in, unaware of a thick fog descending or the lights of another ship, a coal carrier called the Storstad, appearing in the distance downstream. At 2 a.m however, Doctor Grant became very aware as a jarring collision threw him from his ship's berth where he tumbled, landing beneath it. Flicking the light switch in the dark, Doctor Grant found the ship powerless and the uncomfortably close by sounds of metal screaming against metal followed by rushing water told the Doctor quick action was required. In his pajamas, the Doctor fought in the dark, struggling against the almost immediate list of the ship, to get first his starboard cabin door open and then to make his way to the port side. Once there he struggled to pull himself out of a porthole, that was by this time almost directly above him, getting stuck in the process. Desperate hands yanked James through the porthole into the cool night air, leaving his pajama bottoms floating in the dark water rapidly filling the ship's interior. The Empress of Ireland was sinking so quickly, Doctor Grant noted, that only three of her ample lifeboats had been successfully launched. Even more alarmingly, he saw precious few of the ship’s passengers with him on the vanishing island of the exposed hull or in the frigid water around it. Forced into the Saint Lawrence River and battling for his life, the Doctor spared only the barest of thoughts for his lost pajama bottoms as he was hauled into one of the lifeboats and rowed to shore. Borrowing a too large pair of trousers, Doctor James Grant spent hours providing critical medical care to the survivors as they made it to safety.
It took just 14 minutes for the Empress of Ireland to sink to the bottom of the Saint Lawrence River, tragically only 465 of the 1477 passengers and crew aboard made it to the safety of shore and Doctor James Grant’s care. The sinking of the Empress of Ireland would, for a short time, be Canada’s greatest maritime disaster and for many, the young Doctor would be its chief hero.
Shortly before the final address on that warm late Spring afternoon, less than two weeks after the sinking of the Empress of Ireland, Doctor James Grant was called to the dais by Principal Peterson. The Principal was thrilled to describe the McGill alumni’s heroic service in the aftermath of the disaster, finally revealing the reason behind Doctor Grant’s presence at the McGill convocation ceremony. In the wake of Principal Petersons glowing praise, Doctor Grant strode across the dais and shook the Principal’s hand warmly before receiving a duplicate degree to replace the original which had in fact sunk with the Empress of Ireland.
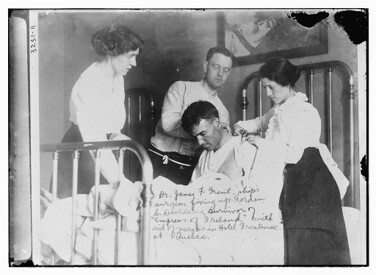
Dr. James F. Grant, ship’s surgeon, fixing up Gordan C. Davidson, survivor of Empress of Ireland, with aid of nurses in Hotel Frontenac at Quebec. Bain News Service. (1914). [Glass Negative]. Library of Congress. https://www.loc.gov/item/2014697511/ No known restrictions on publication. For more information, see George Grantham Bain Collection - Rights and Restrictions Information https://www.loc.gov/rr/print/res/274_bain.html
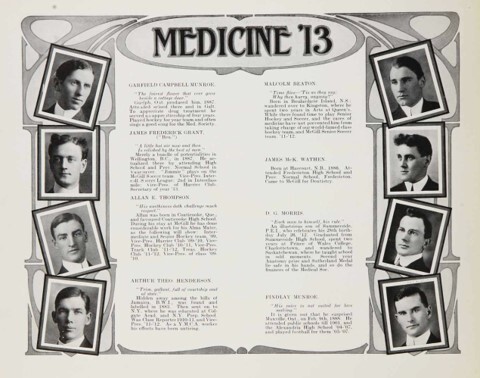
James Frederick Grant, Yearbook Photo, From the Old McGill 1913 yearbook. Student’s Society of McGill University. (1913). Medicine ‘13. In Old McGill 1913. (p. 118). [Yearbook]. McGill Library. https://yearbooks.mcgill.ca/viewbook.php?campus=downtown&book_id=1913#mode/2up Copyright McGill Library, 2011.
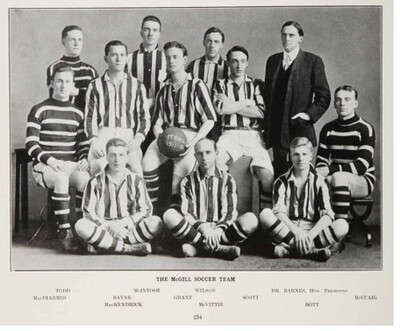
Photo of the McGill Soccer Team (1913). Grant (President of the Soccer Team) pictured in the center holding the ball. Student’s Society of McGill University. (1913). The McGill Soccer Team. In Old McGill 1913. (p. 254). [Yearbook]. McGill Archives. Copyright McGill Library, 2011. /p>
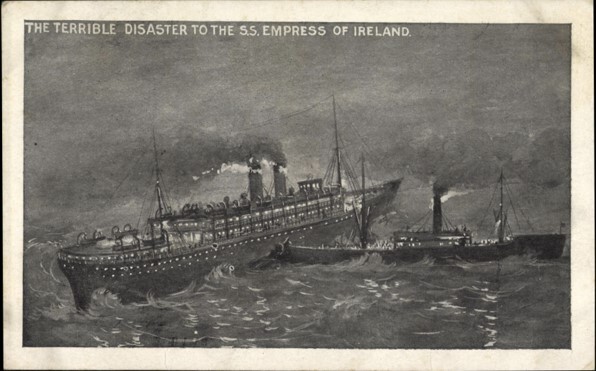
4. Postcard depicting the sinking of the Empress of Ireland. The Terrible Disaster to the S.S. Empress of Ireland. (n.d.). [postcard]. BAnQ. https://collections.banq.qc.ca/ark:/52327/1953411 Public Domain
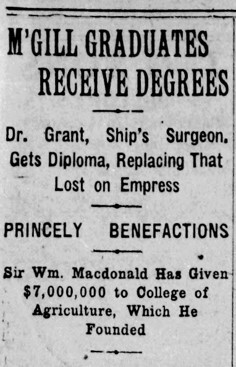
“McGill Graduates Receive Degrees”. Newspaper article (June 10, 1914) announcing McGill medical class of 1913 graduation, Dr. Grant’s attendance, and the sinking of the Empress of Ireland. McGill graduates receive degrees; Dr Grant, ship’s surgeon, gets diploma, replacing that lost on Empress. (1914, Jun 10). [Newspaper Clipping]. The Gazette (1867-2010). https://proxy.library.mcgill.ca/login?url=https://www.proquest.com/historical-newspapers/ june-10-1914-page-11-20/docview/2151260715/se-2 Copyright Postmedia Network Inc. Jun 10, 1914.
Beyond the weather ledger, Quintuplets and forest fires
Amelia Keenan, a student in the McGill School of Information Studies, is a DRAW practicum intern in Winter 2024 and created this blog post as part of her practicum work.
One of the most recent weather ledger pages left to transcribe on the DRAW website dates from the 27th of May to the 2nd of June in 1934. This ledger sheet isn’t particularly remarkable though experienced DRAW transcribers will note that there are only two entries per day instead of the more usual three or more. The almost 100-year-old handwriting is precise and even, suggesting that the person making the observations was a calm, confident individual. The few mistakes on the page have been crossed out with two neat diagonal lines with the corrections written legibly above them. The comments are easily decipherable, and equally mundane, reading fair + warm, cloudy + warm- a few scattered traces of rain, fair + not so warm, cloudy + cool to name a few. Perhaps the most exciting thing about this ledger sheet is a faintly written ‘to’ followed by a ‘b’ with a blob of ink next to it in the Weather column, hinting at some sort of pen mishap.
Looking at this page, imagining anything of note taking place is a difficult task. However, the pages of the McGill weather ledgers offer a contemporary jumping off point into compelling historic events. For example, for most of late May, early June in 1934 the front page of the Montreal Gazette had an article dedicated to the forest fires threatening various parts of Québec. The scattered traces of rain that made their way Montreal on the 29th were sufficient to put out fires in Northwestern Québec the next day but weren’t long lasting enough to put an end to the fires. The fires in Québec and in other provinces continued to be a front-page concern for most of the week though they shared that spot with news that would peak the curiosity of the country and beyond.
On the 28th of May 1934, while McGill’s weather observer casually jotted ditto for fair + warm in his ledger’s remarks column, five babies would be born to one young mother in Ontario. Yvonne, Annette, Cécile, Émilie, and Marie Dionne were the first ever set of quintuplets known to survive infancy. Just four days later, on the 2nd of June, the Montreal Gazette reported that the father of the identical infants had signed a contract to exhibit the infants at the Chicago World Fair. The girl’s appearance at the exhibition never came to pass but their parents would appear on vaudeville. The appearance of the parents on the vaudeville stage circuit led to concerns that they would exploit the children and so the Dionne Quintuplets Act in 1935 was passed to make the girls wards of the Crown. Once under the guardianship of the Crown, the government exploited the children’s fame instead. Revenue was generated by allowing the huge numbers of tourists to observe the quintuplets in a specially built nursery, multiple times a day. The girls also appeared in three films and while their parents were able to regain guardianship of them in 1942, the quintuplets would find that their childhood earnings had been mismanaged leading to lengthy battles with the government later in their lives.
Which goes to show that there is a fascinating wider context waiting behind even the blandest looking ledger page in the McGill DRAW project. Uncovering this context can be a matter of cross referencing the ledger dates with the Montreal Gazette and letting history take you where it may.
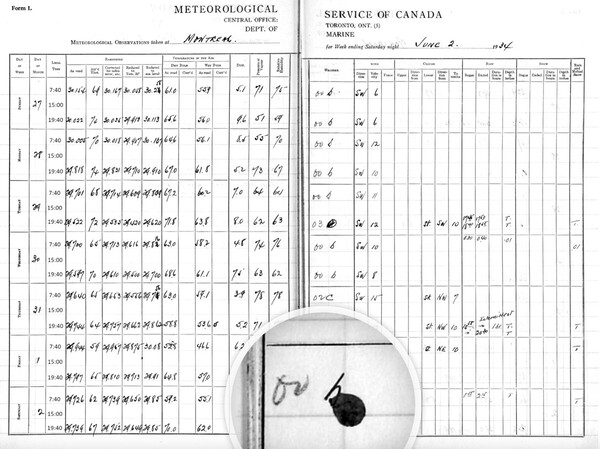
Title: Weather Ledger Page, June 2, 1934, Screen capture, DRAW, Copyright DRAW. Description: A page from the McGill weather ledger showing the weather observations from the 27th-31st of May and the 1st and 2nd of June 1934. With a small ink stain at the bottom of the page magnified.
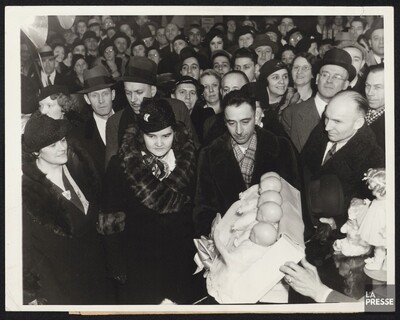
Title: Famille Dionne,1934-1944, Photographs,Fonds de La Presse, BAnQ https://numerique.banq.qc.ca/patrimoine/details/52327/4011198?docref=TbwZDadAhrCELJjETkoWmw Copyright: Public Domain Description: “Chicago, Ill. Mr. and Mrs. Dionne, Parents of the famous Canadian quintuplets and who are now visiting in Chicago where they will make a theatrical appearance, are shown here in a a Chicago department store where Mrs. Dionne was presented with doll replicas of her five daughters during the course of a shopping tour. D.2/7/35”
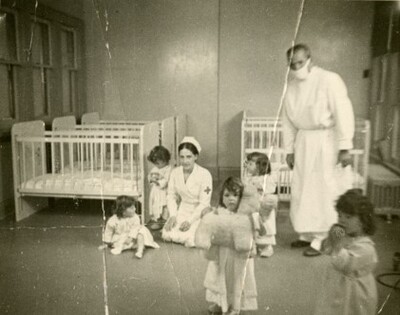
Title: Photograph, [around 1935]-1948, Fonds Jacqueline Noël, BAnQ https://numerique.banq.qc.ca/patrimoine/details/52327/3288241?docref=_jqD_OL244a8NyW5XbqYPg Copyright: Public Domain
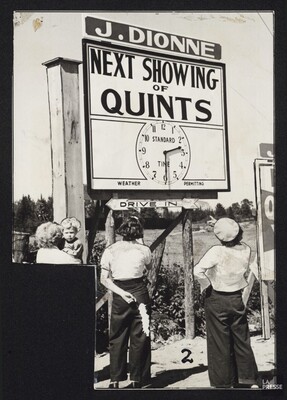
Title: Jumelles Dionne,1934-1947, Photograph,Fonds de La Presse, BAnQ https://numerique.banq.qc.ca/patrimoine/details/52327/4011158?docref=dUWlBXWIcYxRJ-jFXGOrsg Copyright: Public Domain Description: Three woman, one holding a child, standing next to a sign that tells the time of the ”Next Showing of Quints”
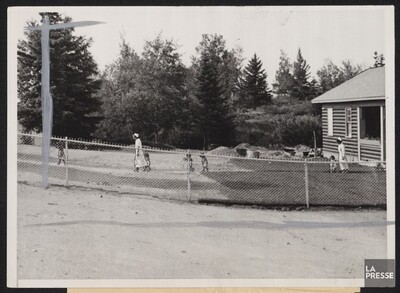
Title: Jumelles Dionne,1934-1947, Photographs, Fonds de La Presse, BAnQ https://numerique.banq.qc.ca/patrimoine/details/52327/4011158?docref=oYzOOoc2h7pPfrkvu7G-Kg Copyright: Public Domain Description: Photo from Wide World M-6318 Thousands watch Quintuplets at play. Callender, Ont.- The famous Dionne quintuplets with two of their nurses shown leaving their playhouse to go back to their hospital. The playhouse is constructed so that the thousands of visitors who come here to see the quints can watch the babies play in a center courtyard from a heavily screened porch through which the visitors walk. H- 8/7/36”
Thérèse Casgrain and Change
Amelia Keenan, a student in the McGill School of Information Studies, is a DRAW practicum intern in Winter 2024 and created this blog post as part of her practicum work.
On Friday the 10th of July, 1896 avid newspaper readers were enjoying the moderate breeze on the pleasant 23C day, a little less than their fellow citizens. The pages of both the English and French Montréal newspapers were filled with the comings and goings of Canadian Prime Minister, Wilfred Laurier and his political compatriots.
Sir Rodolphe Forget, attempting to find a quiet moment of exterior repose, was particularly irked by the wind’s interference in his attempt to remain au courant on the events of the day. Though, in truth, he was a little on edge from waiting. Abandoning any pretense of interest in news of the Democratic National Convention being held in the Chicago Coliseum, Sir Rodolphe rolled up his newspaper and tucked it neatly under his arm. Then he strode inside his impressive residence, past the aneroid barometer that seemed to be hovering between Fair and Change and the maids doing their invisible work to find out if the news he had really been waiting for had finally been delivered. Sir Rodolphe would find that his wife, Lady Blanch Forget (née McDonald) had indeed delivered their daughter, Marie-Thérèse.
The politicians in the papers and Sir Rodolphe had exactly two fundamental things in common. They were men and as such they held the right to vote. A right that Canadian women in 1896 were denied. However, the barometer reading on the 10th of July that year could not have been more appropriate. Change was coming for the ‘fairer sex’ in and Thérèse would be at the very forefront of the Canadian fight for suffrage. Thérèse Casgrain lead the women’s suffrage movement in Québec, fighting for the right for women to vote in provincial elections long after the right to vote in federal elections was won.
Thérèse Casgrain’s other notable achievements include being the first woman in Canada to lead a political party, Parti social démocratique du Québec, and ensuring that the women of Québec could receive their family allowance cheques in their own names rather than their husbands.
In later life Thérèse would become highly critical of nuclear weapons and a staunch defender of indigenous women’s rights. Thérèse Casgrain received multiple honorary doctorates in Law in recognition of her achievements, including one from McGill University in 1974.
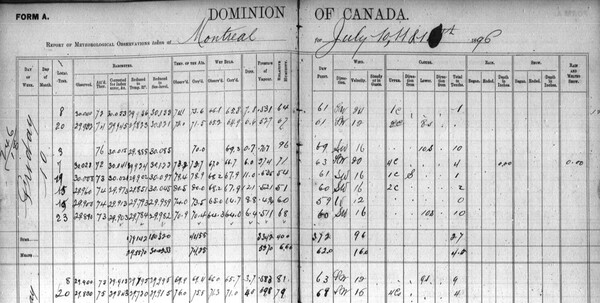
Screenshot of the McGill weather on 10-07-1896 ledger from the DRAW website.
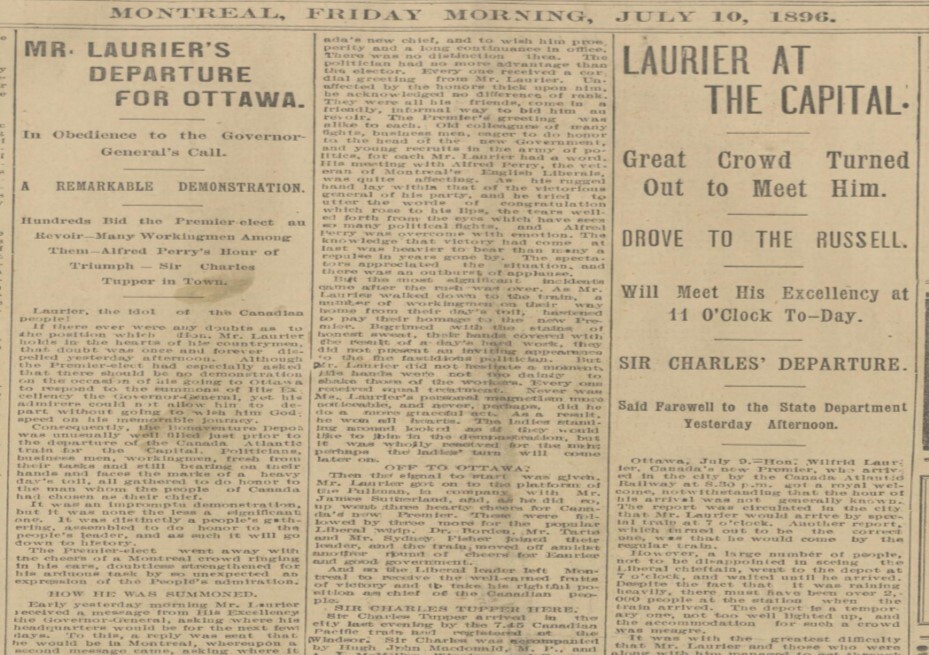
Montreal Daily Herald, 1896-07-10, Collections de BAnQ
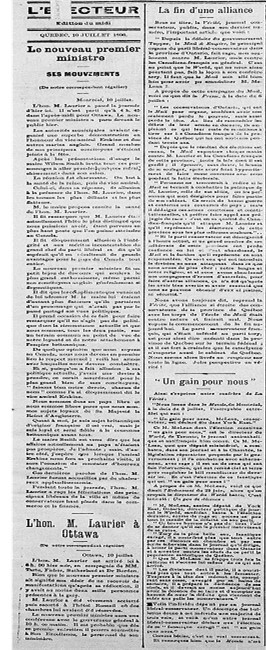
L'Électeur, 1896-07-10, Collections de BAnQ
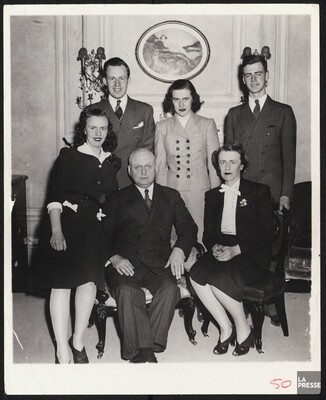
Thérèse Casgrain (seated right) with her husband Pierre-François Casgrain (seated left) and their four children, Hélène, Renée, Rodolphe et Paul Thérèse Casgrain, 1896-1981, 1940, BAnQ Vieux-Montréal, Fonds La Presse, (06M, P833, S1,D225)
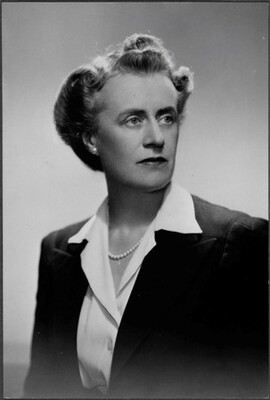
Photographic portrait of Thérèse Casgrain Credit: La Rose/Library and Archives Canada/C-068509
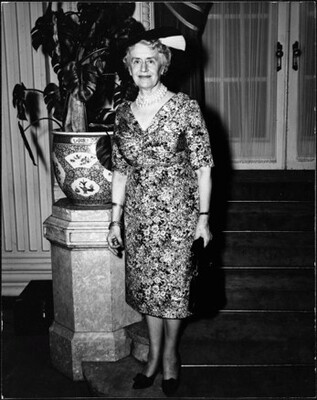
Thérèse Casgrain wearing a hat and a floral dress. Marie-Thérèse Casgrain. Mention: Thérèse Casgrain Bibliothèque et Archives Canada, PA-178170
History of Weather Observation at McGill University
Marie-Laurence Caron, a student in the McGill School of Information Studies was a DRAW practicum student in Winter 2023 and created this blog post as part of her practicum work.
The McGill Observatory is one of the key sources of historical weather data in Montreal. The historical records and weather logs which were produced and written down by the meteorologists working at the McGill Observatory throughout the years of its existence at McGill University (1863-1963) are now currently found and preserved in the DRAW Archive for researchers and users of the archive.
The meteorologists at McGill university have often used their knowledge to record and forecast the weather for major newspapers in the city of Montreal, like The Gazette, for instance. The articles of The Gazette frequently used the findings recorded in the weather logs of the McGill Observatory as a reputable source for the observation of weather events, which they would then relay to citizens in news reports. For instance, a news article in The Gazette issue of May 29, 1907, reported:
"“This year, according to the records of the McGill Observatory, shows very little else but showers and heavy rains. When these were not conspicuous, sleet and snow were registered.” Coldest in Years (1907, May 29). The Gazette
The McGill Observatory operated year-round and recorded weather on a daily basis on weather charts and weather logs, some of which can also be found in the DRAW Archive at McGill, for perusal, transcription and research. The weather logs produced by the McGill Observatory were used by scientists and meteorologists to make statistics about the weather and predictions as well to report in newspapers. For instance, on July 31st 1926, The Gazette reported the occurrence of “torrid weather” in Montreal, but also used the findings of the meteorologists at McGill to put what citizens felt into perspective by using science and statistics:
“Montreal’s scientific share of the eclipse of the sun on Saturday morning was marred by mists near the Earth’s surface and fleeting clouds which obscured the sun during most of the time that the moon was intervening between its surface and the earth.” “Thousands of people flocked to see the astral phenomenon, crowds on the streets stopping to watch the progress of the moon as it made its way across the surface of the sun. On St-Catherine Street at every corner there were many people viewing the sky, and traffic was almost stopped during the progress of the eclipse.” "While the citizens of Montreal complain of the heat of the month, statistics at the McGill Observatory show that the average temperature has been one degree lower than the normal temperature for July.” Clouds Obscured Eclipse (1925, Jan 26). The Gazette
The eclipse event had thus garnered a lot of attention from both the media and the citizens of Montreal during that week in 1925. Professors at McGill University who were also hoping to watch the eclipse from the McGill Observatory were quite disappointed by the cloudy weather that day since it made the attendance of the astral event a lot less optimal than they had originally planned and predicted.
"It was very disappointing,” said Prof. Kelly “Owing to bad sky condition. I was out early with observatory staff and others of the university interested in such matters. The eclipse started at 8:08, when the sun was only 12 degrees over the horizon. It was so low that the sun had not yet emerged from the pall of smoke hanging over the city. Owing to these conditions, we were unable to even get the time of first contact between the intervening moon and the sun.” Clouds Obscured Eclipse (1925, Jan 26).
The McGill Observatory was thus a place of observation in more ways than one in the city when it was still in operation. Weather and astral events have always been key subjects of interest and fascination to both the meteorologists working at McGill University and the citizens of Montreal. The weather logs and data that are currently being preserved and transcribed by volunteers and archivists at the DRAW Archive detail the rich history of weather in Montreal. Weather impacts both observations and key events in the city, but it can also inform the people of the present about the experiences of those in the past, as we have seen with those three stories here.
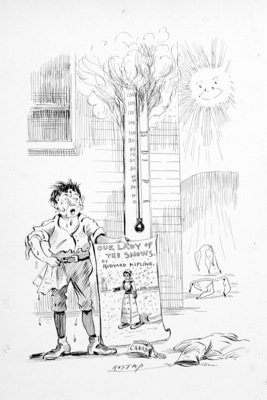
Heatwave by Rostap 1897, McCord- Stewart Museum Object number M2001X.6.43.6.56 (Documentary Art Collection).
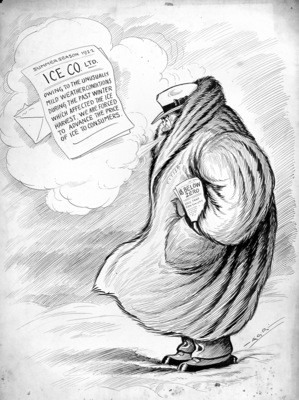
The Weather: A Peep into the Future by Arthur George Racey, 1922, McCord- Stewart Museum Object number M2005.23.245 (Documentary Art Collection) .
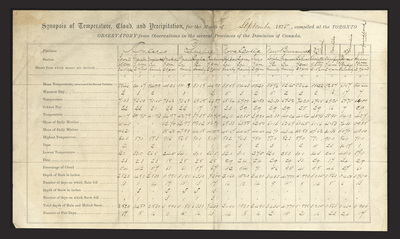
Weather Chart, Synopsis of the temperature, cloud and precipitation, 1875-09, McCord- Stewart Museum Object number M2001X.6.23 (Archives –Textual Archives) .
Weather and Disruption
Marie-Laurence Caron, a student in the McGill School of Information Studies was a DRAW practicum student in Winter 2023 and created this blog post as part of her practicum work.
"The first snow in Montreal started at 7 o'clock yesterday morning and the wind also increased in velocity, the snow drifting as it fell. The local snowfall was at the rate of one inch per hour up to 9:30 o'clock last night when McGill had registered a total snowfall of 12.2 inches during that period. Snow continued at a slightly lessened rate and was yet falling at an early hour today.” Fourteen Inches of Snow (1924, Feb 21). The Gazette
Weather has always been a fascination to many artists and poets. It amazes, excites, and fills our restless hearts with a sense of pure wonder as the weather changes with us and evolves, both with time and the seasons. Every year in Montreal, there is that collective moment of pure silence and dreamy awe when one first looks outside of the frosty windows of their home or their office, and then sees the first snow of the year falling ever so gently and softly on the streets below from the thick grey clouds of the dense and cold sky above.
The weather is not always so peaceful and calm, however. As the many records preserved at the DRAW (Data Rescue and Archives Weather) archive will quickly demonstrate, weather is often chaotic and unpredictable. We observe this every year in the city of Montreal, and it is especially true when it comes to the winters. Disruptive weather events occur on different scales at different times of the year. For instance, in 1924, the Montreal Gazette reported a snowstorm that occurred in Canada, which swept across the Great Lakes and Ontario before finally landing in Montreal where citizens spent the whole day battling with the aftermath of the storm. The impact of a snowstorm such as the one that occurred in 1924 can often be quite astronomical. Back then, the Gazette reported that the cost of the removal of every inch of snow in Montreal amounted to $6000. Fourteen inches of snow in just one morning in the city could thus cost up to $84,000$ of Montreal civic funds. Furthermore, snowstorms during the winter could also disrupt public transportation on a national scale. Nowadays, we often see disruptions in the city bus lines of the STM and the metro as well in Montreal when water floods in the underground subway lines. But back in 1924 in Montreal, the Montreal Tramway Company was the leading player in terms of public transport in the city. People took the trains and used the railway to get to work in the city. After the fourteen inches snowstorm occurred that morning in the eastern provinces of Canada, the Montreal Gazette reported that all scheduled trains eventually did reach their destinations in Montreal, but every one of them was delayed from one to eight hours. Railways were heavy sufferers of the storm since train tracks were located outside in the cold weather at the time, unlike the more modern underground subway lines we use today to reach the various parts of the city for work and for school.
Disruptive weather events like snowstorms in the winter are therefore not only costly in terms of time, public transportation and civic funds—they can also impact the lives of citizens in major ways in the city. Historical records and newspapers like the Gazette show that deaths frequently occur on the roads of Montreal in the winter after a heavy snowstorm occurred. Local accidents are also common when citizens travel on foot to get to their university or their workplace in the city. In the snowstorm of 1924, a fractured wrist and a bruised back were reported to occur to both the train conductor and a passenger of the Canadian Pacific train once they got off at the station in the city. The Gazette noted pointedly how some engagements which were planned for the day of the storm had to be cancelled as well. For instance, a major lecture was set to occur at McGill University which had to be reported to a later date in the season:
“Various engagements or events were postponed last night as a result of the storm. As A.W Crawford, director of Vocational and Technical Education in the department of Labor in Ottawa, failed to arrive in Montreal early enough last evening, the address which he was to have delivered on ‘Vocational Guidance’ under the auspices of McGill School of Social Services, had to be cancelled. A large audience gathered in the lecture hall of the McGill Chemistry Building to hear the address, which was scheduled to start at 8:30 o’clock. With regret, it was announced that the meeting would have to be called off. The lecture of Mr. Crawford will be delivered later in the season.” Fourteen Inches of Snow (1924, Feb 21). The Gazette
Snowstorms can be disruptive to many facets of daily life in Montreal. Although events and civic engagements sometimes must be called off because of the heavy snowfall in the winter, it’s important to record those disruptive changes in the weather with observations rescued form the analogue McGill Observatory logbooks and placed into a database form, in the in the DRAW archive of McGill. By learning from the past and those records, we can learn and better prepare for the future by lessening the impact disruptive events can have on the lives of citizens in Montreal.
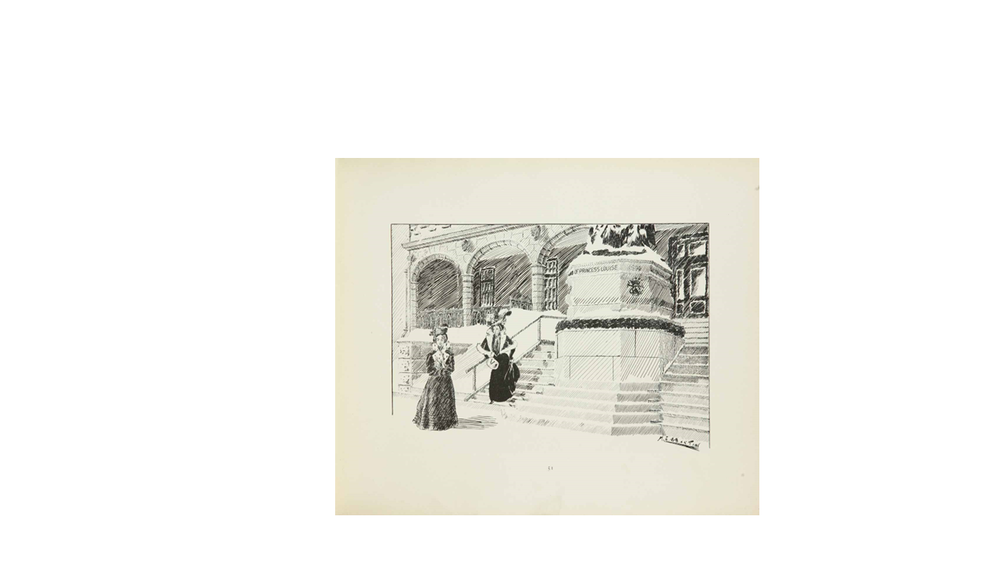
McGill Yearbook Collection, 1902
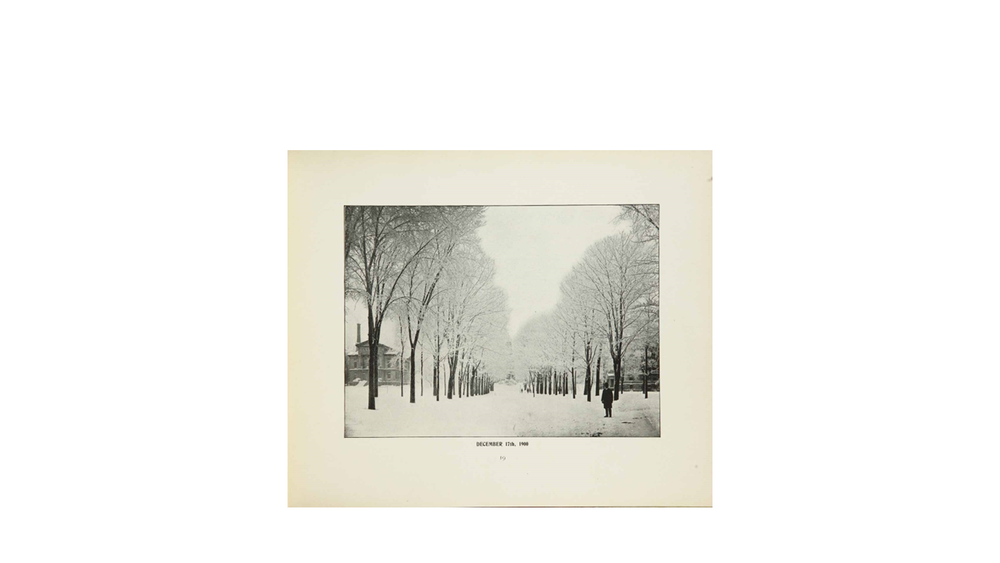
McGill Yearbook Collection, 1898
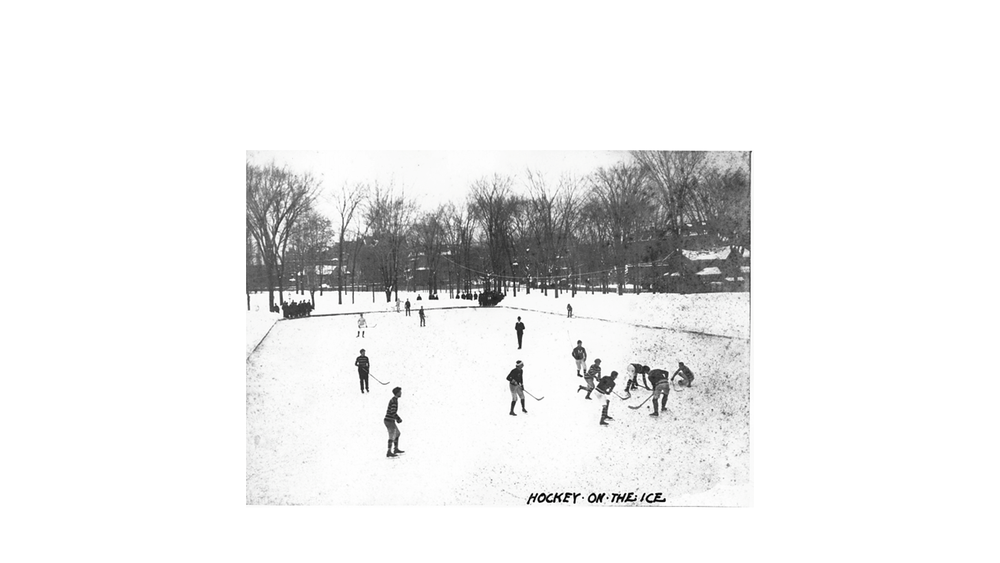
Hockey on the Ice, McGill Campus, about 1900, McCord Stewart Museum, Identifier MP-0000.2214
Unclouding History: Peer into Montréal’s Past with DRAW
Amelia Keenan, a student in the McGill School of Information Studies was a DRAW volunteer during the summer and created this blog as part of her introduction to DRAW.
The digital weather data preserved in the DRAW archive offers a fascinating window into the environmental past. As a DRAW volunteer transcriber, you can peer through that window and satisfy the curiosity piqued by Marie-Laurence Caron asking if you have ‘ever wondered what the weather was like on your birthday a hundred years ago in Montréal?’ in a previous DRAW blog.
The first step to becoming a DRAW transcriber is watching a short tutorial video narrated by then project co-ordinator Rachel Black. In addition to a brief but fascinating insight into the historical context of the weather data and its digitization, Rachel ensures that every step of the transcription process is clearly demonstrated and easily replicable.
Every effort has been made to remove the barriers to making a meaningful contribution to citizen science so following the tutorial there is an enlightening handwriting help blog to peruse. Then, after setting up your transcriber account, you are ready to start transcribing. The easy-to-use system allows you to choose a page at random or select special dates, such as your birthday, from the available weather log pages. The transcribing process is straightforward, although minor technical challenges may be encountered. Ensure you are working with a 100% page view if you find data boxes saving to unusual areas on the page, for example.
You’ll find yourself immersed in decoding the weather symbols, shorthand and inky stokes of century old cursive handwriting when transcribing. If you encounter marks that defy deciphering efforts, then the always available DRAW team will kindly help you to discern their meaning. Though for the most part transcription offers an enjoyable challenge there are also some surprises, such as a tiny newspaper clipping snippet glued into a page margin.
Unsurprising, however, are the historical records of snowfall and freezing temperatures that define the onset of January in Montréal even today. A piece of chilly information that finally satisfies this volunteer DRAW transcriber’s curiosity about what the weather looked like on her birthday 100 years ago in Montréal. Now, aren’t you a little curious?
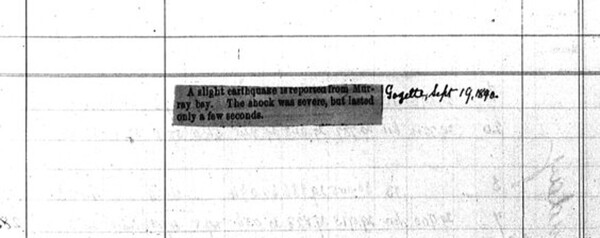
A small newspaper clipping found on page 1890-09-17 to 1890-09-19 of the DRAW weather archive. Text reads- A slight earthquake is reported from Murray bay. The shock was severe, but lasted only a few seconds. Gazette, Sept 19, 1890.
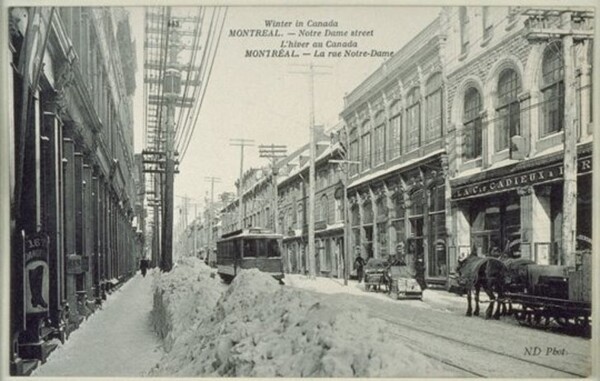
Unknown. (1870-1920). Albums Massicotte. ‘Rue Notre-Dame en hiver’ [photograph]. BAnQ https://collections.banq.qc.ca/ark:/52327/2081604, Text reads - Winter in Canada MONTREAL. - Notre Dame Street. L’hiver au Canada MONTRÉAL
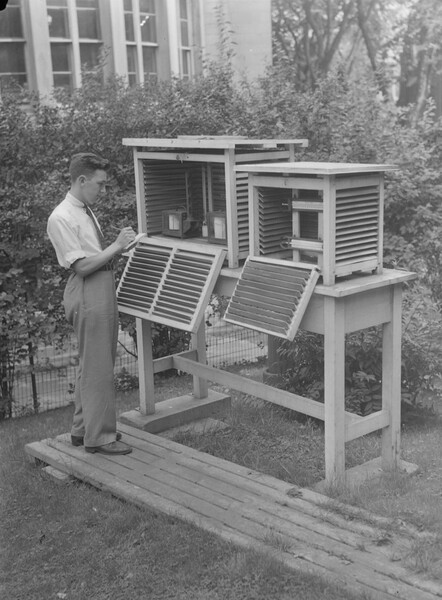
Poirier, Conrad (15.08.1945). ‘Feature. McGill Weather Bureau’ [photograph]. BAnQ https://numerique.banq.qc.ca/patrimoine/details/52327/2832702, Fonds Conrad Poirier, (06M,P48,S1,P11880), Description: Raymond Morcel, technician at McGill University's meteorological observatory, takes readings from the recording barometer of a weather shelter. (translated)
SAA Research Forum Presentation: Weather Research Project in Quebec: Using machine learning and social narratives from the past and the present to explore changes in vulnerability and resilience over time for weather events
Funded by FRQ Audace Grant: Team members: Victoria Slonosky, Renée Sieber, FrédéricFabry, Gordon Burr, Alyssa Conlon, Yumeng Zhang, Munchen Wang, Antoine Rehberg .
Team member Gordon Burr who made the SAA presentation is a double graduate of McGill University in history and Information Studies. He retired as a McGill archivist in 2017 and has been an adjunct professor in McGill’s School of Information Studies for more than 30 years. He has been active in the DRAW (Data Research: Archives Weather) project to enable the capture of historical weather data to assist in climate change research since 2015 and joined the Audace project last year. His areas of research interest are related to online participatory archives, archival outreach, and the engagement of more communities with archival sources utilizing archival literacy.
Does a disruptive weather event necessarily imply an extreme weather event? No: sometimes, an ill-timed few centimeters of snow can create more havoc than a massive storm. But what makes an event disruptive? Currently there is definite answer to this question; in general, we know that an event is disruptive only after the disruption has occurred and is being discussed. Ultimately, what makes a weather event disruptive depends on social responses: whether, under these specific circumstances, we are vulnerable or resilient in the face of the event. This can only be grasped, understood, and ultimately predicted by combining social narratives and meteorological considerations.
To achieve this goal, we aim to determine what has made events disruptive in the past (a century ago) and in the present (in the last decade) and how social changes influenced vulnerability and resilience. This breaks with existing paradigms that disruptive events are meteorologically extreme events; instead, disruptive events have an inherently social dimension.
For both past and present, we will use a combination of weather records and of social commentary (from newspaper articles to tweets) to both determine the meteorological intensity of that event as well as the magnitude and type of its impacts. Comparisons between the two sets in the past and in the present will help us identify what social aspects make us more vulnerable or resilient to a particular outcome of a weather event than another, and how those have changed over time. This will allow us to make predictions on what type of weather event may become more impactful in the future considering current societal and climatic changes.
A key aspect will be the use of artificial intelligence, nuanced by social science insights, to detect patterns in the huge dataset of commentaries and weather information that will help reveal the sources of our vulnerability to specific types of events. For these reasons, our team has expertise in meteorology, public perceptions and technical applications, and artificial intelligence.
The presentation discussed the methodology, issues in acquiring digital sources under copyright restrictions from sources utilizing a variety of standards, preliminary findings and promised discussion of the final results of this two year project at next year's forum.
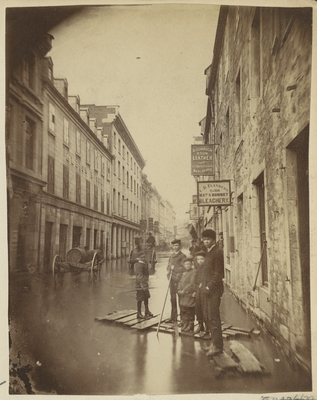
St. Paul Street Flood, Montreal, 1864, McCord Stewart Museum - Identifiers: MP-0000.1828.1.22
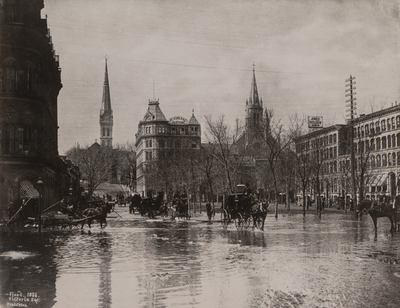
Flood in Victoria Square, Montreal, QC, 1886, McCord Stewart Museum, Identifiers: MP-14399
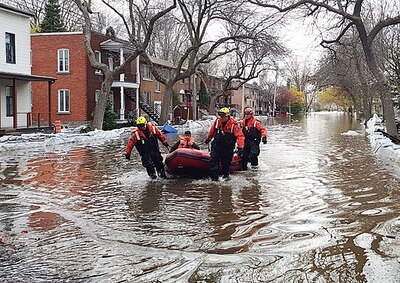
Quebec Floods, Montreal, 2017, Wikipedia Common, File 34416135641
Rescue Weather Data to help researchers!
Marie-Laurence Caron from the McGill School of Information Studies created this post as part of a Practicum project concerning social media and the DRAW (Data Rescue: Archives and Weather) Participatory archives. Her supervisor was Adjunct Professor Gordon Burr and a founding member of the DRAW team.
Have you ever wondered what the weather was like on your birthday a hundred years ago in Montreal?
The Data Rescue Archives & Weather (also known as DRAW) contains historical weather logs dating all the way back to the 1800s. The weather data that is currently being preserved and recorded at the DRAW archives can not only be used to satisfy your personal curiosity about what the weather was like in Montreal on the day you were born, it can also be useful for researchers and professionals across multiple fields of study. Weather is perpetually evolving every year. It is one of the few things in this world that is rarely constant on a day-to-day basis when it is observed and recorded. And as global warming becomes a more pressing issue across the countries of the world, weather data from the past become particularly relevant to the modern day researchers studying this as a global phenomenon. The historical weather logs and weather data preserved and kept at the DRAW Archive of McGill thus serve as a key source of information to study how the weather has evolved and changed in Montreal over the course of many generations here in the city and at the McGill Observatory.
Not only is weather data being carefully preserved at the DRAW Archive of McGill, it is also being transcribed from past historical records by both archivists and volunteers. The DRAW website provides a helpful tutorial and tools for new volunteers who are interested in drawing out information from handwritten historical weather logs so that it can be transcribed digitally for easier use and understanding. Deciphering the handwriting of written records can be quite tricky for the untrained eye. Furthermore, if you’re a researcher who needs to gather a large amount of weather data for your current research project or reports, having that data and information digitized in an archives like DRAW makes it more easily searchable and findable, which can really ease up both the process of research and data analysis. The volunteers and archivists working at the DRAW archives thus provide a valuable support for the researchers of today and tomorrow.
Weather always changes. It’s often unpredictable. But you can help record the way it has changed over the years and still continues to do so. It can be quite fun once you learn the process of transcribing when you become a member of the DRAW archives on the website. Join today and learn more about weather and data rescue with our team!
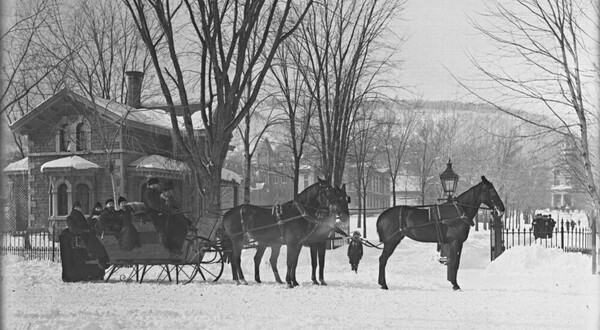
Gelatin Silver Glass Plate Negative (W. Stephen's tandem at McGill's gates, Sherbrooke St., Montreal, QC, 1889), Notman Photographic Archives - McCord Stewart Museum - Identifiers: II-88891.
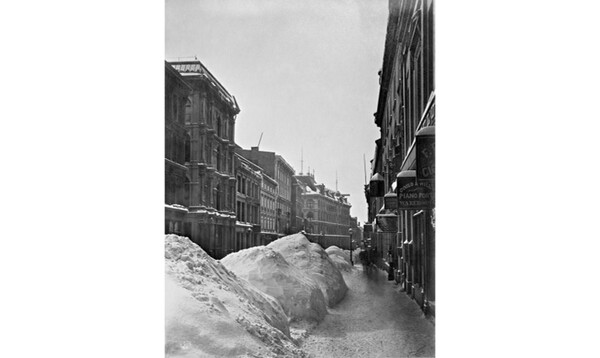
Tirage à l'albumine (Rue Saint-Jacques après la tempête, Montréal, QC, 1869), McCord (Photography - Documentary Collection), McCord Stewart Museum, Identifiers: MP-1968.31.1.28.
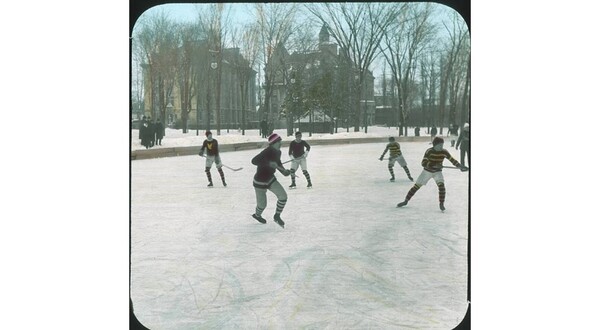
Transparency (Hockey game, McGill campus, Montreal, QC, about 1910), McCord (Photography - Documentary Collection), McCord Stewart Museum, Identifiers: MP-0000.25.1030
An Interview with Yves Lapointe, McGill University Archives
Caring for archival collections requires a passion for preserving history and seeing its value for many different milieus. Digging through primary sources, discovering gems of information, and discerning facets of history to create context to the past, and at the centre is the archivist. Yves Lapointe has a special connection to DRAW, as he is also the Director and University Archivist for McGill University. In his role, he provides leadership, direction and guidance on archival practices and in the preservation, accessibility and promotion of the University’s documentary heritage, including the records of the weather observatory.
DRAW member Lori Podolsky had the pleasure of interviewing Yves on his archival career, advice for upcoming archivists and participatory archives (such as DRAW). The entire DRAW Team thanks Yves for his time and contributions. If you would like to learn more about the McGill University Archives, you can visit their website: https://www.mcgill.ca/library/branches/mua
Lori Podolsky (LP): Tell me about your position as Director and University Archivist, your role within McGill University?
Yves Lapointe (YL): In conjunction with the MUA Terms of Reference, the Archives Act and the Act respecting Access to documents held by public bodies and the Protection of personal information, my primary role is to provide the University with a sound recordkeeping program. The implementation of such a program in a systemic approach requires the development of key recordkeeping tools (i.e.: A University-wide Classification Plan, a records retention and disposition schedule, a global records taxonomy, and ultimately a records management platform). Combined and interconnected, they provide the necessary elements to manage efficiently and coherently the life cycle of any document.
In this regard, my role is to have the MUA provide leadership, direction, counsel and guidance on records management and archives activities to the University; to promote, raise and encourage awareness of the role and importance of records management and archives to the University community. This is accomplished through the progressive development, implementation and promotion of recordkeeping policies, procedures and guidelines, ensuring compliance with federal and provincial legislation. It is also accomplished by developing, implementing and maintaining records management and archives services for all University Faculties and administrative units.
From my perspective, there are two aspects to consider in my role as University Archivist. The Records Management functions are to establish the appropriate framework to ensure the University manages its information assets through their life cycle according to requirements and best practices. As University Archivist, my role is to make sure that the University preserves its documentary heritage as well as all the necessary and required records of our institution for future generations. As archivist, my role is also to make available and accessible the archival material for research purposes, exhibits, student learning, etc.
LP: How did you become interested in archival work?
YL: I became interested in archives while doing research with primary sources during a course history class. I was working towards my BA in History doing research under the direction of Dr. Jean-Pierre Wallot, who was also National Archivist of Canada at the time. My research was on Montreal blacksmiths – how they worked, their tools, belongings, equipment, day-to-day work. I had to use inventories developed by notaries in the 1850s to get the information I needed. Those inventories located in the archives revealed so much. As things evolved, I became more attracted to this newly discovered field. I then decided to take a certificate in archival studies, followed by a Master’s degree in Library and Information Science.
LP: What drew you to archives as a profession?
YL: There is certainly more than one aspect that attracted me to the field. After learning about historiography and other facets of history, as I was digging through primary sources, I became more and more aware of their very often underestimated value, and gradually discovered the behind-the-scenes of an archive. I became more and more interested in the field and realized there was a place and a role for me to play.
LP: How did you become involved in DRAW?
YL: I became involved in the DRAW project immediately after my arrival in the Archives, during a homecoming event where we were introducing the platform to participants.
LP: What role do you have in the project?
YL: My role in the DRAW project is somewhat limited. Most of the project was already in place upon my arrival, relying on a great pool of experts. Nevertheless, I became a strong supporter of the project, promoting it during conferences, lectures in archival and information studies classes. We also developed hack-a-thon sessions to raise awareness and encourage crowdsourcing participation.
LP: What archival advice would you provide to new and upcoming archivists and to those doing archival research?
YL: Archivists are now coming out of school with impressive and robust training programmes. The challenges of the archival field and the profession are numerous. However, for the last few decades the biggest of them seems to reside in the management of electronic records and long-term digital preservation. As technology never ceases to evolve and change, as archivists our challenge is to continuously adapt to make sure access to these archives is possible, in the near and distant future. New archivists should therefore learn as much as possible about all the different technologies that surround information. Artificial intelligence is one emergent technology that sounds very promising and for which very little has come out so far. In a not-so-far future, we might witness the possibility of performing deep analysis or any other archival functions on archival records’ data, either born-digital or digitized with optical character recognition.
LP: What is an archival collection or fonds?
YL: An archival fonds is basically all of the documents that an individual or an organization has accumulated, produced, or received in the course of their duties or activities throughout their life. For a professor, for instance, it would be all the courses and conferences delivered, research files, honours and awards. For an organization it would be all the records closely tied with its mission and based on its activities. A collection, however, is the result of the accumulation of material at random, being therefore the complete opposite of a fonds. In many instances both concepts are very often used to identify the same entity. Moreover, the ensemble of all the fonds in an archival institution’s repository is also identified as the collection, meaning the holdings.
LP: How is an archival collection acquired? How do you decide on whether or not to acquire an archival collection?
YL: There are several aspects to consider in the process of acquiring a fonds. It has to be within the scope of the unit’s mandate and part of its acquisition policy and strategy. There are a number of criteria to look into such as its size, the research potential, the connection with other fonds or collections, the medium- and long-term preservation requirements, the presence of prohibitive restrictions, etc.
LP: How is an archival collection processed and described?
YL: After acquiring a fonds or a collection, to facilitate their access, they are processed and described according to recognized and well-established principles and standards in the field. In Canada, for the last thirty years, the Rules for Archival Description (RAD) have guided how fonds and collections should be described. Although it may seem a long time, because of the vast quantity of archival material involved, it is not always possible or needed to have a detailed description of all the holdings of an archive, especially not at the item level. A fonds or collection will go through the process of arrangement where it will be organized in homogeneous and logical series or levels based on the creator’s activities. The ultimate result of the processing, arrangement and description is what archivists call a finding aid. It has become best practice to process from generic to specific and gradually enhance archival descriptions. The finding aid can therefore evolve progressively providing descriptions to fonds level, series, sub-series, files and eventually item level.
LP: How is an archival collection made available to people?
YL: Once a fonds or collection is processed, and the finding aid is ready for dissemination to the public, it can be made accessible on the archive’s web site. For many years, finding aids were made available in an individual file. The McGill Archives uses Access to Memory (AtoM), an online archival description and access system which allows us to have all of our holdings available and easily accessible, with a search capacity. This allows users to get an account of material we may have before coming to the Reading Room for consultation. More and more we are making the fonds and collections available with digitized copies of some material. If not available online, then the material can be made available to users in the Library and Archives’ Reading Room, if there is no restriction.
LP: Who can access archival collections?
YL: Unlike books in a library consultation and lending environment, archival collections in general are not in an open access and cannot be taken out of the institution that holds them. However, McGill University being a public institution, it is possible for researchers and the public to access the fonds and collections held in the Archives. Because of the nature of archives, and the resources available, it takes time to have the requested material ready for consultation. So, it's always a good idea to send a detailed research request before visiting the archives, either online, by phone or in person; and plan the upcoming visit to the Reading Room for consultation.
LP: What new collections have you acquired?
YL: One of our recent acquisitions, that is in some interesting ways connected to DRAW, is the fonds of Emeritus Professor Lawrence Mysak, former director of the Earth Systems Modelling Group in the Department of Atmospheric and Oceanic Sciences at McGill. Although the fonds has not yet received archival processing and description, it is accessible.
LP: What archival collections relate to DRAW?
YL: The material for the DRAW project derives from several fonds or collections in the McGill Archives. The fundamental ones come from institutional records from the Department of Meteorology at McGill, and consist of the Weather Observatory Registers, where meteorologists meticulously recorded their four to six daily observation logs. Complementing these records, the MUA also holds the Albert John Kelly Fonds. Albert J. Kelly was Director of the McGill Observatory from 1922 to 1943, and well-known to the public as a weatherman and also as a timekeeper for the nation's railroads and many of its industries.
LP: Participatory archives and the role of the citizen archivist has been gaining momentum in the archival community. How do you implement these initiatives in your archives?
YL: In recent years, we witnessed the emergence of citizen archivists’ participation in providing additional help to enhance archival description. DRAW is an extraordinary and complex example where the contribution of the public can benefit everyone and serves to raise awareness. The establishment of an initiative of that sort requires resources that go beyond those of an archive. This inevitably involves having a multidisciplinary team. Technology is also a very big part of the equation. Projects have to be developed carefully to be sustainable. There are many other ways of engaging citizens into participating in archives, like promoting on social media, having online events. A first consideration should be given to the media type before developing a crowdsourcing initiative to have a clear objective to reach. It can be easy to engage the public in an initiative but making it lasting can be very challenging.
LP: What roles does the citizen archivist play in the future or evolution of archives?
YL: Citizen contribution seems to be very promising for the evolution of archives. The archival community has demonstrated a willingness to open the door much wider to public participation in providing information to digitized material, transcribing letters, translating them, providing locations, dates and names to photographs. Will that be necessary for born-digital archives? Although the community has triggered and witnessed many very interesting citizen participation initiatives involving archives, I believe we have yet to see the full potential of this digital humanities component. In this equation, archivists should not forget that citizen participation relies on these two crucial elements, citizens and participation. The challenge archivists will continuously face is engaging both to be successful.
LP: How is DRAW an example of participatory archives?
YL: DRAW is an excellent example of archival crowdsourcing because of its multidisciplinary aspect. Often the need to develop a citizen contribution and participation comes from the archive itself, to complete information about the material or the object, which is the usual goal. With the DRAW project, this goes a little further as once the material is transcribed, not only will the data be available for reuse, it will serve to complete weather information that was dormant for the last 150 years, adding it to the already complex Canadian and internal weather data in hope to better understand several aspects of climate change.
Post-processing: Where's all the data? (Part One)
DRAW has been up and running for a number of years now, and citizen scientists have been faithfully transcribing pages from the McGill Observatory weather logs. We have over a million pieces of data. So you may be wondering, when can we see some data? What are the results? Is there any scientific analysis coming out of this project?
Thanks to a grant from the Bieler School of the Environment, Dr. Victoria Slonosky and Nathan Leuranguer have been working this summer on the first steps of data transformation, what we’ve been calling post-processing. “Post”, because it’s after the observations have been transcribed from the image files to the database through the web app. “Processing” because, well, there’s a lot of work to be done to the transcribed data before we can start to analyze it scientifically.
We’ll describe some of the steps here and in future posts. It’s complicated! Not only do we want to clean up the data, we also want to track any changes, and to track why we’re making changes. All of the original transcriptions stay the same, and the amended values move forward in a copied version of the data. We’re also creating flags, so that at each step we know why a value was amended, what the original value was and what the changed value is. A value might be changed more than once on its post-processing journey.

Screenshot of a table indicating changes made to transcribed data during post-processing.
As a test, we decided to start with looking at the pressure values. The first thing to check is whether an entry is of the right type. For pressure, temperature, and other measurements, is the value entered a number?
Nathan spent several weeks just inspecting the database, running manual queries for many different conditions to get an idea of what the data looked like. In the process, he came across a number of stray characters in the data entries.
Nathan found all of the following non-standard characters in some of the numerical data entries:
? * & , # ^ @ $ ( ) [ ] { } “ / .. (more than one decimal point)
Running many similar queries allowed us to understand common patterns in how transcriptions can and do go wrong.
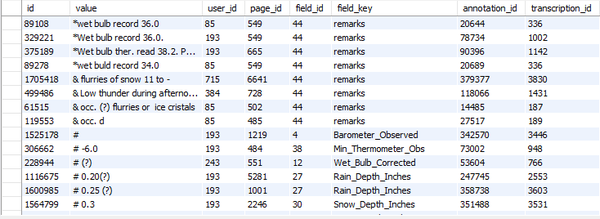
Screenshot of a table indicating transcription issues identified during post-processing.
All of these mistakes, non-standard keyboard entries, typos and other stray characters need to be removed and flagged as a first step.
Next, we looked to see if the pressure values had the number of digits we expected — generally two digits, a decimal point, and then two or three values after the decimal point. It’s very easy to mistakenly type 2.938 or 293.8 instead of 29.38 when the pressure is recorded in inches of mercury, as it is in the DRAW records. These are easy to fix and flag automatically, by multiplying or dividing by 10. Less easy to fix is a situation which many of you have no doubt come across when transcribing pressure: what do we do when there are no leading digits, that is, no numbers, such as 29, before the decimal point? This turned out to be much trickier than we anticipated, and will take a blog post of its own to answer.
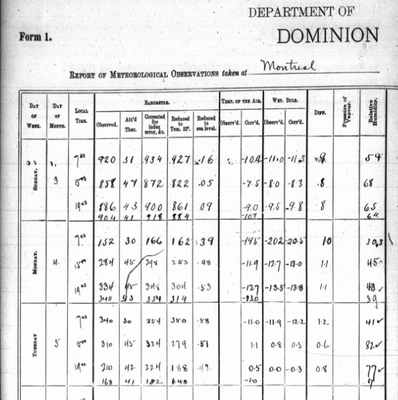
Example of a logbook page where the leading digits of the barometric (pressure) values were not recorded by McGill weather observers.
Keep an eye out for future blogs by Vicky and Nathan that will treat other challenges in post-processing!
Lawrence Mysak’s Memoirs - Part Four
Earlier this year, we had the privilege of publishing three extracts from the memoirs of McGill Emeritus Professor Lawrence Mysak, who made enormous contributions to 20th and 21st century climatology, especially in oceanography, climate variability, climate modelling, and other fields we’ve read about in this series. Professor Mysak has graciously offered us two more extracts of his memoirs, which we will be sharing on the DRAW blog in this post and a future one.
The McGill University Archives recently acquired Professor Mysak’s papers, which will be available for future researchers and historians of science.
Allan Robinson: My Harvard PhD Supervisor (written February 15, 2022)
In September 1964, the beginning of my second year at Harvard as a PhD student in applied mathematics, I enrolled in the course “Geophysical Fluid Dynamics” (GFD). I was fascinated by fluid mechanics and wanted to write a PhD thesis in this general area. Since Canada is surrounded by three oceans, it made sense for me to consider a mathematical problem in ocean dynamics. This GFD course, about the dynamics of the atmosphere and oceans, would certainly give me a good background to do this type of research. But who was Allan Richard Robinson, the instructor for the course?
In my first year at Harvard, I took two courses from Professor George Carrier, whom I greatly admired for his brilliance and enthusiasm for all things related to fluids, including oceanography. He was my first choice for a PhD supervisor. I asked him in September 1964 to consider taking me on as a PhD student later that academic year once I finished my course work.
“Lawrence, I would normally be delighted to be your PhD thesis supervisor,” he said. “But next year I will be away on sabbatical.”
“Oh no,” I responded. Professor Carrier saw that I was disappointed to hear this.
“Why don’t you consider Allan Robinson as a potential supervisor?” he suggested. “As a recently appointed faculty member he’s on the lookout for new graduate students to supervise.” Only later did I learn that Carrier supervised Robinson’s PhD thesis at Harvard a few years ago and held him in high regard.
Robinson’s GFD lectures were pedantic but informative. I quickly learned about the effects of the earth’s rotation on large-scale currents in the atmosphere and ocean, and how the ocean temperature and salinity affected the ocean’s density and overturning motion. I got annoyed at the frequent interjections by Jim Baker and Peter Niiler, Robinson’s postdoctoral students who sat at the back of the class. However, this activity livened up the classes and introduced me to the give-and-take of academic debate. Later both Jim and Peter helped me with the last chapter in my PhD thesis.
There was no final exam for the course; instead, we had to write a 10-page term paper about some topic in ocean or atmospheric dynamics. Towards the end of the term, I went to Robinson’s office to discuss possible topics for a paper on oceanography.
“What is your interest in the oceans?” Robinson asked me.
“I would love to write about ocean waves,” I replied.
I was always intrigued about wave motions, and in Professor Carrier’s fluid mechanics course that I took last year, the discussion about waves in fluids made me eager to learn more. Robinson then pulled out of a file cabinet a short paper he recently published (Robinson 1964) in the Journal of Geophysics (JGR). It was entitled “Continental shelf waves and the sea level response of the sea surface to weather systems.”
“Take a look at this,” he said. “For your term paper I want you to explain the physics and expand on the mathematical operations in this paper. Also, you should describe the observational evidence for these waves.”
When I dug into the JGR paper, I discovered that the term “continental shelf waves” was newly coined by Robinson. Through an elegant analysis of the shallow water equations for fluid motion on a continental shelf, he came up with a theory of coastal trapped waves travelling along a sloping shelf (hence the term continental shelf waves). This wave theory could explain the northward travelling sea level signals that were recently observed along the east coast of Australia (Hamon 1962, 1963). Since there were no other published papers on shelf waves besides those of Robinson and Hamon, I didn’t have to do any extensive background reading for my term paper. Hence it was brief but evidently well written: I got an A for the course.
During the spring semester, I took a reading course from Professor Robinson in which I attempted to generalize his theory for the case of shelf waves travelling around a large circular continent that crudely represented Australia. As I seemed to be making good progress on this project, toward the end of the semester Robinson pulled me into his office one day and said, “I would like you to be one of my PhD students.”
I was stunned. Usually, it was the other way around at Harvard. During your second year you were expected to visit various professors and beg one of them to take you on as a student. However, even though I now had a supervisor it was not all clear sailing. Before starting my thesis research, I had to pass an oral PhD qualifying exam in June 1965.
I’ll never forget that oral exam. The examiners represented half a dozen different areas of applied mathematics and engineering science, and their challenging questions forced me to “think on my feet.” I managed to answer two of them well, but I stumbled through most of the others. Robinson took pity on me near the end of the examination period and said, “Pose your own question in GFD and give us the answer.”
I tried to explain the phenomenon of baroclinic instability of large-scale flows in the atmosphere and ocean. However, it was evident to the examiners that I had a poor understanding of the processes involved. To save the day, Robinson persuaded the examining committee to give me a conditional pass for my oral: During the next week I had to write a report to explain clearly the nature of baroclinic instability and its role in ocean dynamics.
Fortunately, the report was accepted, and I was free to formally start my thesis research under Allan Robinson. I soon discovered that Robinson used the “puppy method” when starting off his new PhD students.
“I want you to complete your mathematical solution for shelf waves around a large circular continent, a project that you started in the reading course this past spring. After that, try to compute the sea level energy spectrum that would arise in response to an observed atmospheric weather system travelling eastward across Australia,” he said.
He didn’t suggest when we would next meet to discuss the progress in my research. He wanted me to work on my own, like the young puppy tossed into the middle of a pond and told, “swim to shore.” If the puppy makes it to shore by itself, great. If the puppy starts to flounder, however, a lifeline is thrown out to the puppy, who is then slowly pulled to shore. As a Robinson student, I learned that if I were to solve the posed problems mainly by myself, I would soon be out of Harvard with my PhD. But if I needed a lot of help with my research, I would be grinding through my thesis project for several more years.
That summer I made some progress in my research without his help, but I was preoccupied with my upcoming marriage to Diana in Edmonton followed by a honeymoon in Jasper Park. When we returned to Boston in September, I was refreshed and ready to prod on with my thesis research. After a month, however, I was really stuck and made an appointment to see Robinson in his office. I filled his blackboard with many equations which I hoped would lead to the solution of the island shelf wave problem. “What should I do next?” I said in desperation.
Robinson listened carefully as I made my presentation, but at the end he had nothing to offer in the way of solving my mathematical problem. After a long pause he said, “Larry (as I was called then), if one method doesn’t work, you’ll just have to find another.”
Fortunately, a couple of months later, I did find a solution after some helpful discussions with my fellow PhD students. After solving the large-island shelf wave problem, I was able to determine theoretically the effects of offshore stratification and a longshore current on the shelf wave speed. It was now spring 1966. To complete the thesis, I still needed to find a mathematical expression for the shelf wave energy spectrum and compare this with the observed spectrum. As Robinson was going to England for a sabbatical in September 1966, I needed to get this done quickly. In June his postdocs Jim and Peter came to my rescue. We met together in a small classroom and brainstormed with Robinson on how to use the methods of time series analysis for linear systems to solve this spectral problem. We quickly came up with the solution, and I was now able to put together a draft of my thesis.
In July 1966 I gave the draft to Robinson. He looked at it briefly and then suggested I send a copy to Professor Carrier, who was on holidays in the remote woods of Maine. Clearly, Robinson wanted the approval of his academic father before he allowed me to graduate. After about three weeks, I phoned Carrier for his comments. “The thesis is short, but the results are significant,” he said. As chair of the Committee on Applied Mathematics that oversaw my PhD program, he then told me that I can now set a date for my PhD thesis defense.
I successfully defended my thesis (Mysak 1966) in early September 1966, and a week later I passed my language requirement for the PhD. I did Russian for this since I had taken two courses in Scientific Russian as an undergraduate at the University of Alberta.
Looking back, I now realize that I was lucky to have completed all the requirements for the PhD in just under three years. I attribute this to having had an “easy problem” to work on for my thesis and previous experience in research, first as a summer student working for the Canadian Defense Research Board and later as an MSc student doing research in Australia. Other Robinson PhD students often took several years to complete their theses. I heard second hand later that a few of his students were in fact quite scarred by their thesis research experience at Harvard. Much later, I also learned that Robinson was not liked by some of his colleagues. Was this because of his tendency to be arrogant?
My next major encounter with Robinson was in Cambridge, England in spring 1972. We both happened to be on sabbatical as “senior visitors” in the Department of Applied Mathematics and Theoretical Physics (DAMTP), University of Cambridge. After finishing my PhD and spending a brief postdoctoral period at Harvard to write up my thesis for publication (Mysak 1967a, 1967b), I started my academic career as an assistant professor of applied mathematics at UBC in September 1967. After four years at UBC, I was eligible for a sabbatical and chose DAMPT because of the many researchers and visitors there working in GFD. I had had little contact with Robinson once I left Harvard. I think this is because I often felt intimidated by his sophisticated New England/Ivy League demeanor. Also, our research interests went in different directions. I continued to work on shelf wave and related coastal problems for the next decade (Mysak 1980) whereas Robinson focused on mid-ocean eddies and the Gulf Stream (Robinson et al. 1979). Thus, it came as a surprise when one day in Cambridge he suggested that we have dinner together at his favorite country inn.
We drove together to the inn in his Alfa Romeo, a car he purchased overseas to bring back to the USA. I remembered that Allan always had a taste for fancy sports cars. The inn had a beautiful garden with peacocks strutting about, and we were able to eat outside on the terrace. The food was excellent. I noticed that Allan chose the most expensive meal on the menu. He also ordered a cigar to enjoy with his coffee after dessert. Our conversation was quite relaxed as we focused mainly on trying to understand the lifestyle of British academics. I recalled the bill came to nine pounds. Allan pulled out a fiver, and I happened to have four one-pound notes sticking out of my wallet, which Allan noticed.
“That’s fine for your share of the bill,” he said. “Let’s keep the professor-student relationship intact.”
“Would you like to come to my flat for a brandy when we get back to town?” I offered.
“Great idea,” he replied. “I want to talk to you about some serious scientific issues.”
What the hell does this mean? I thought to myself. Time will tell.
After the first sniff of brandy, Robinson came right out with a question I had been struggling with as an applied mathematician in a large department of mostly pure mathematicians. Did I belong there, or would I be better off in an oceanography department since I was using mathematics to solve various ocean wave problems?
“Larry,” Allan asked, “are you more interested in working as a methodologist or as a phenomenologist?” By this he meant that a methodologist has a bag of mathematical tools and then looks for problems in the physical world to apply them. A phenomenologist, on the other hand, is more interested in an observed feature in nature that he or she is trying to understand; the mathematical tools come into play later as needed to rigorously describe the feature.
“I’m not sure,” I replied. “I have probably been thinking of myself mainly as a methodologist. But perhaps I should think more about the other approach to research.”
When I returned to UBC in fall 1972, I thought again about the question that Robinson posed. After doing research with a few observational oceanographers at UBC and elsewhere, I discovered that it was indeed thrilling to be able to use my mathematical tools to model and explain a variety of puzzling oceanic and climatic observations. Thus, the dinner with my former PhD supervisor proved to be a game changer for me. As a consequence, over the years, I have studied, for example, the impact of natural climate variability in the Northeast Pacific on sockeye salmon migration, the influence of sea ice cover variations in the Greenland Sea on the overturning ocean circulation in the northern North Atlantic, the effects of vegetation and the earth’s orbital variations on glacial inception, and the impact of global warming on outdoor skating rinks.
The last time I met Allan Richard Robinson (known by his colleagues as AR2) was in December 2005 when I happened to be giving a seminar on climate dynamics at MIT. After the seminar, he invited me to his office at Harvard. Robinson looked happy in his three-piece suit (Fig. 1), and he enthusiastically described his new work on the theory of physical-biological interactions in the ocean. He then led me to a corner shelf which displayed the theses of his approximately 30 PhD students. I was his third or fourth student, and it was clear that he was proud of his academic sons and daughters.
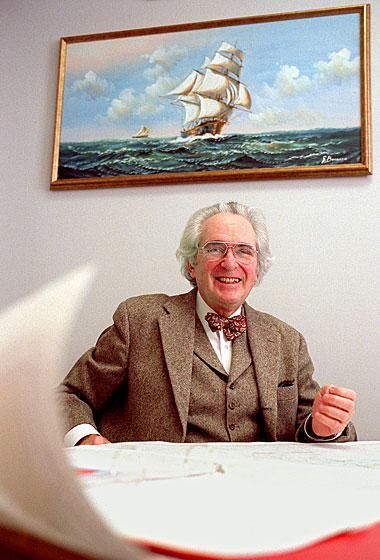
Fig. 1: Allan Richard Robinson, Gordon McKay Professor of Geophysical Fluid Dynamics at Harvard University, 1968-2007. (From The Harvard Gazette, Sept. 2009)
Recently I discovered that I was one of eight students Robinson chose to list in his academic family tree (Fig. 2). I knew that his PhD supervisor, his academic father, was Professor Carrier, but from this tree I also learned that my academic great, great, great grandfather is the eminent German fluid dynamics professor Ludwig Prandtl. He was the first one to describe the boundary layer in flows with very little friction. The tree also shows that Stephen Timoshenko is my great, great grandfather. He is widely regarded as the “father of applied mechanics” in the USA. Timoshenko was born in Shepetivka, Ukraine and did graduate studies at the University of Göttingen under Prandtl. Before coming to the USA., he was professor at the Kiev (now Kyiv) Polytechnic Institute. Being of Ukrainian descent, I want to pass on this discovery to my children, Paul and Claire.
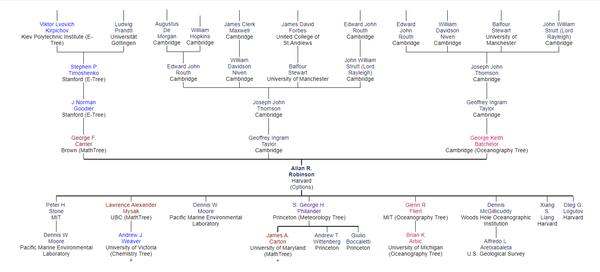
Fig. 2: The academic family tree of Allan Robinson. The eight academic children of Robinson shown in the tree include Peter Stone (PhD 1964) and three students doing research in the mid to late 1960s: Lawrence Mysak (PhD completed in 1966 but conferred in March 1967), Dennis Moore (PhD 1968) and George Philander (PhD 1970). (From Physics Tree - Allan R. Robinson Family Tree (academictree.org))
Allan Robinson died unexpectedly of cardiac arrest in 2009. He was 76 but still active in research. While I was never close to him on a personal level, I greatly appreciate the support that he gave me as a young PhD student nearly 60 years ago. During my 50 years of active graduate student supervision (1967-2017), I have tried to offer similar support to my students. However, I never used the puppy method when my students started out on their thesis projects.
References
Hamon, B.V., 1962. The spectrums of mean sea level at Sydney, Coff’s Harbour, and Lord Howe Island. J. Geophys. Res. 67, 5147-5155.
Hamon, B.V., 1963. Correction to “The spectrums of mean sea level at Sydney, Coff’s Harbour, and Lord Howe Island”. J. Geophys. Res. 68, 5635.
Mysak, L.A., 1966. Continental Shelf Waves, PhD Thesis, Harvard University, 69 pp..
Mysak, L.A., 1967a. On the theory of continental shelf waves. J. Marine Res. 25, 205-227..
Mysak, L.A., 1967b. On the very low frequency spectrum of the sea level on a continental shelf. J. Geophys. Res. 72, 3043-3047..
Mysak, L.A., 1980. Recent advances in shelf wave dynamics. Rev. Geophys. Space Phys. 18, 211-241..
Robinson, A.R., 1964. Continental shelf waves and the sea level response of the sea surface to weather systems. J. Geophys. Res. 69, 367-368..
Robinson, A.R., D.E. Harrison, and D.B. Haidvogel, 1979. Mesoscale eddies and general ocean circulation models. Dyn. Atmos. Oceans 3, 143-180.
Featuring the CMOS Archives
This article is a special feature to DRAW by Bob Jones, archivist for the Canadian Meteorological and Oceanographic Society (CMOS) since 2014. For 15 years prior to that, Bob was the CMOS Webmaster. You may email him at archives@cmos.ca.
In 2005 it was suggested that the Canadian Meteorological and Oceanographic Society (CMOS) start a photo archive containing images of all the people who have or are working in Canadian meteorology and / or oceanography. This was partly the result of finding so many course photos but the project soon expanded well beyond that. To see how it has evolved today, a look at our Canadian Meteorological Historical Photos index and Canadian Oceanographic Historical Photos index will help. These are subsets of the greater CMOS Archives.
Although there are exceptions, especially in the much smaller oceanographic pages, the main purpose of the photos project is to show the people. Related artifacts such as meteorological instruments, buildings and scenery such as in the High Arctic are not usually shown. Oceanographic ships are shown because of their integral data collection linkage to the ocean discipline and ocean science research.
The people photos project, especially on the meteorological side, is well advanced and we are close to meeting our goal of including everyone. Try it yourself by thinking of someone you know who has worked or is now working in Canadian meteorology – then go to the Canadian Meteorological Historical Photos index and try their name(s) in a search box. You may be surprised to see a young photo of uncle Henry who worked as a weather observer or meteorologist in the 1950s.
Of course as you DRAW folks well know, there are gaps in all databases. We are still finding course photos; researchers are missing who started work directly at some university or institute; and occasionally new photos from the greater oceanographic community (much smaller than the meteorologists and atmospheric scientists). These all badly need additions.
Also be aware that McGill is well represented in many photos, like this one of the Stormy Weather Group.
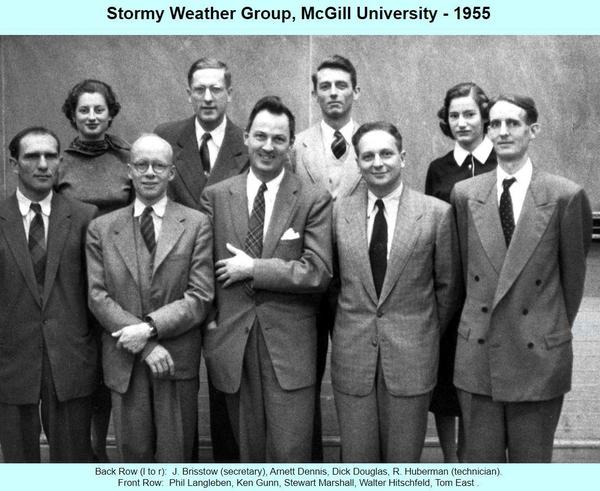
You can find them easily using the search boxes. McGill has been and still is a major force in many aspects of decades of Canadian Meteorology.
Now I would like to present some photos from among the thousands we have placed on the photo archives website. Knowing DRAW folks like the old stuff, the first three are from that era.
So, here we go, as snipped from an actual web site search:
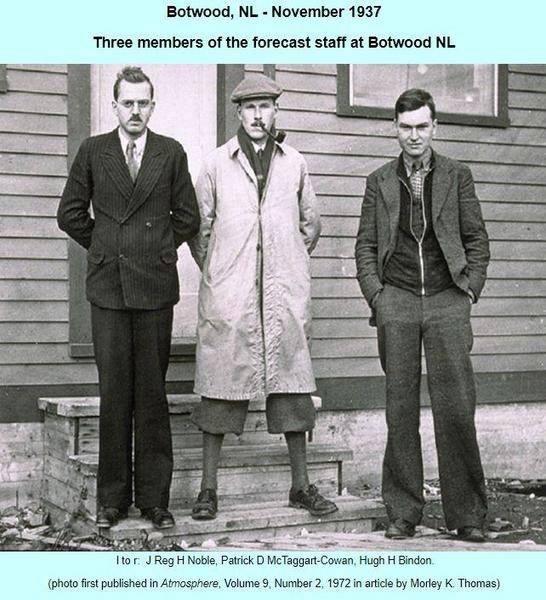
These men are among the pioneers in developing Canadian Meteorological Services which grew rapidly after WWII.
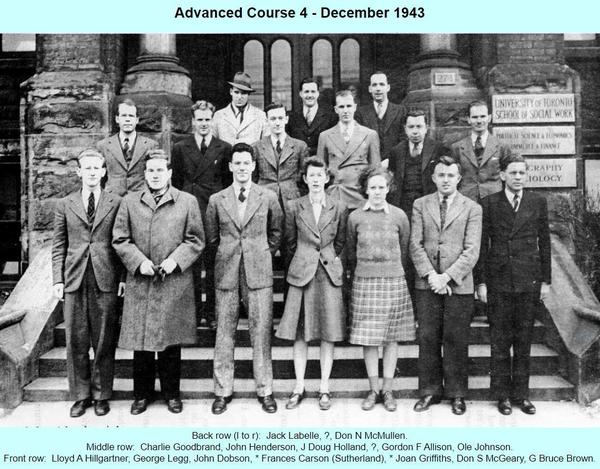
Here is one of many wartime courses in meteorology launched by the Meteorological Service of Canada in Toronto to try to fill the postwar demand for meteorologists. This photo is very special as it shows Frances Carson (Sutherland) and Joan Griffiths, the first two Canadian female meteorologists to ever graduate and work on a forecast desk. As you will know from your DRAW work, meteorology was very much a male domain well into the 1970s.
Finally, I will conclude the photos with a “founders” view - Victoria Slonosky who started Draw and Susan Woodbury who suggested the photo project in 2005.
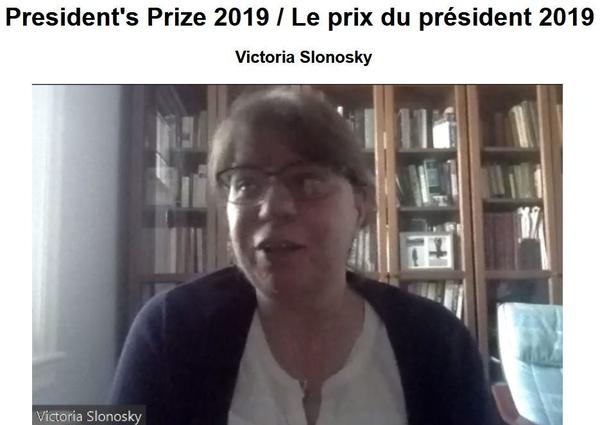
This is a Zoom snip from our first virtual congress in Ottawa during the spring following the emergence of COVID-19 when Victoria was awarded the CMOS President’s Prize.
Susan Woodbury is in many photos as she has played major roles in all aspects of CMOS (also a McGill grad). She suggested we start the photo archive.
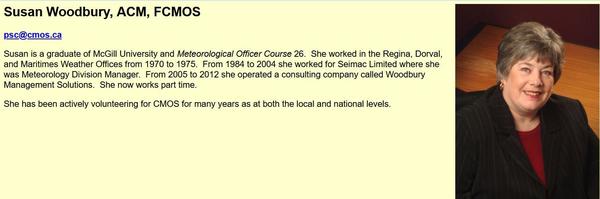
I hope this snippet will further publicize our archives and will result in many new photos being found.
Introducing DRAW Members: Nathan Leuranguer
Introducing…
Who:
Nathan Leuranguer

From:
France
Role at DRAW:
Data Analysis Research Assistant
Favourite part of DRAW?
Getting to be immersed in information and data dating back to 150 years ago. There's something about digging into old books and materials that has always interested me, perhaps because it seems like it was a completely different world back then. Looking at weather data from an old ledger book makes you think about what they might have been thinking or experiencing that day.
Favourite Season?
Summer
Favourite Cloud Type? Why?
Cirrus clouds - I remember reading an encyclopedia-type book on geography when I was very young, and that cloud is the only cloud type I remembered since then (until now); so that stuck with me. I like them because they look like waves on a coastline, but in the sky.
Cirrus clouds over Federal Way, WA
by Ron Clausen, CC BY-SA 4.0, via Wikimedia Commons
Coolest thing you’ve learned while participating in DRAW?
Apart from the technical skills I've picked up and refined (databases, ER models, programming for data science), I've loved learning about details about the history of Montreal and McGill, like how Leacock building used to be where the observatory was built. Reading through the 'Teachable Timeline' webpage on the DRAW website has lots of those interesting stories.
And of Course:
Sweet or Salty?
Salty
Star Wars or Star Trek?
Star Wars
Cats or Dogs?
Dogs
Favourite Animal?
Penguin
Favourite place in Montreal?
Saint Helen's Island
Albert J. Kelly: McGill’s Weatherman and DRAW
The following text was originally written for the McGill University Bicentennial Historical Unsung Heroes Exhibit. You can read about nine other McGillians deemed Historical Unsung Heroes, here: https://200.mcgill.ca/staff-recognition/historical-unsung-heroes/. The text has been slightly modified for this blog post.
Albert J. Kelly nicknamed “McGill’s Weatherman,” was born May 15th, 1888, in Edmonton, Alberta to Georginia and John E. Kelly. He graduated from McGill University with a B.Sc in Civil Engineering in 1911, and went on to join staff the next year as assistant to Professor C.H. McLeod, at the Observatory and in the Department of Surveying and Geodesy. He later became Director of the Observatory, an incredible feature of McGill’s contribution to academic research on weather and climate. A McGill Research project DRAW (Data Rescue: Archives and Weather continues to honour this legacy in the 21st century by making his weather observations available in database form to help enable research into climate change.
When war broke out, he, like many “unsung heroes,” quickly volunteered to join the war effort. He served in 6th University Company reinforcing H.R.H. Princess Patricia’s Canadian Light Infantry. Kelly kept his war diary diligently. As a preface to the pocket-sized, brown suede diary, he wrote “Be it noted, whoever may glance at this, the story of an infantry officer, serving in France, that though the intrinsic value of this book is not large, it is highly prized by its owner, firstly as a Xmas gift from H.R.H Princess Patricia of Connaught.” He quietly noted changes in weather, the dates of his granted leaves, his participation in campaigns, and solemnly inscribed the names of fallen comrades. He was appointed Scout Officer in May 1918. He was awarded the Military Cross for bravery and was demobilized in March 1919, with the rank of Lieutenant.
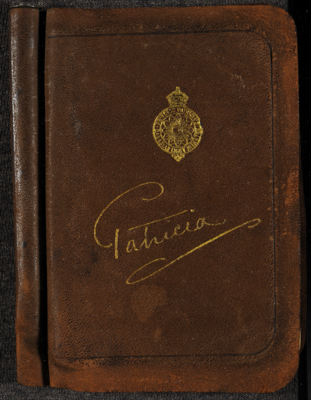
Diary in Albert J. Kelly Fonds. MG3054. McGill Archives. McGill University.
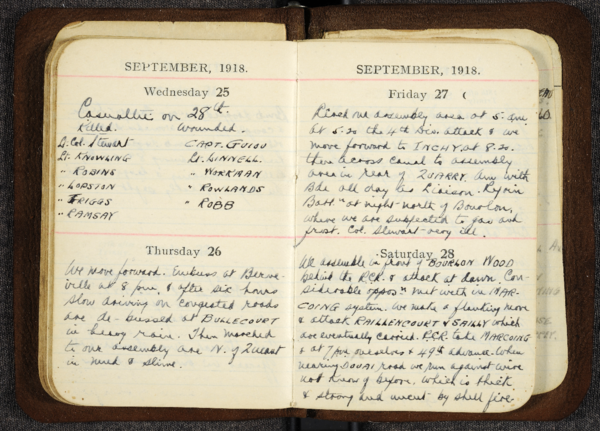
Page for September 25-27, 1918. Diary in Albert J. Kelly fonds. MG3054. McGill University Archives.
After the war, he returned to McGill and served as an Assistant Professor, where he became a meteorology authority. He was portrayed as a wizard, navigating tools like the barograph, the marine chronograph, and time signal relays transmitted all over Canada.
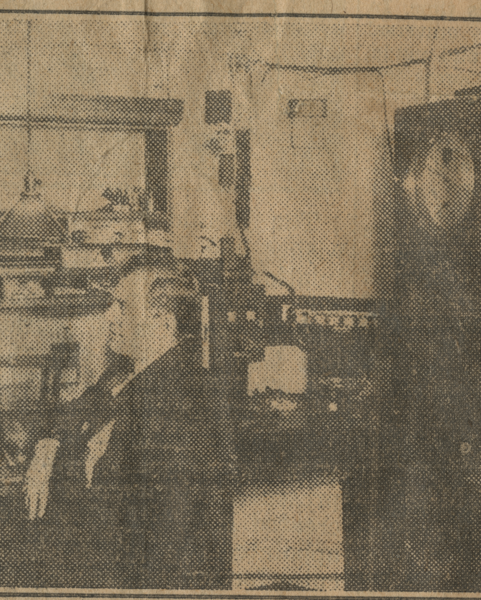
Newspaper Clipping: Weather Wizard at Work, A.J. Kelly seated with his equipment, Albert J. Kelly fonds. MG3054, Acc. 1397 ref 3. McGill University Archives.
Upon his passing in 1945, Kelly was warmly remembered by his McGill community at a memorial service and eulogized as a “well-balanced personality, a sympathetic listener, a valued, sincere and understanding friend of both students and colleagues.”
Convocation 1922
Convocation season is upon us once again! In celebration of the upcoming 2022 graduates, we are happy to resume our series on historic convocation ceremonies. These blog posts were written by students of the McGill University School of Information Studies as one part of an assignment focusing on DRAW, in the GLIS641 Archival Description and Access course (Winter 2022 semester). These students have graciously offered to share their blog posts with our readers. This week, we’ll be delving into the convocation that took place 100 years ago, in 1922.
1922 was a year of building in Montreal. The famous Clock Tower was completed in the city’s Old Port, while on McGill campus the Biology building (now James Administration Building) was built on Sherbrooke Avenue (Old Port of Montreal, n.d.; McGill University, n.d.) That spring, McGill conferred over two hundred degrees to undergraduate and graduate students (“McGill conferred”, 1922).
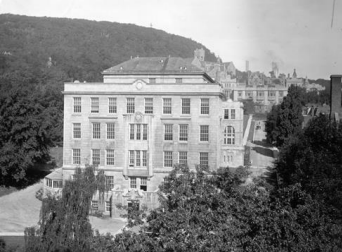
McGill University, Old Biology Building (1922)
As participatory archivists who will receive our own McGill degrees one century later, we are interested not just in the ceremony or the weather on that fair spring day, but also in the context of what 1922 must have felt like.
In the United States, May 1922 marked the dedication of the Lincoln Memorial in Washington, DC (May 30) and the birth of Golden Girls actress Bea Arthur (May 13) (“1922”, 2022). Canadian preacher Aimee Semple McPherson made weather headlines on May 29 when she appeared to generate her own meteorological feat, allegedly stopping a rainstorm during a visit to Kansas (“Faith healing ministry”, 2022).
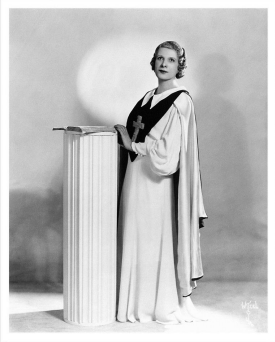
Aimee Semple McPherson (1922), courtesy of the Toronto Public Library
At McGill, the temperature peaked at 63 degrees (17.2°C) during the afternoon after reaching a low during the early hours of 42 degrees (5.5°C). The day was partly cloudy, with cirrocumulus clouds foretelling an impending change in the weather. This pattern is sometimes called a mackerel sky, a buttermilk sky, or un ciel moutonné (Met Office, n.d.) By evening the sky was completely overcast, while over the course of the day the wind shifted from a light northeast breeze to a gentle wind originating in the west. Overall there were 9.2 hours of bright sunshine and the weather was dry, with humidity ranging comfortably from 55 to 63 percent. The weather was, in the words of the Montreal Gazette the following morning, “most propitious” (“McGill conferred”, 1922).
The conferring of degrees took place in the Capitol Theatre at 11am and was open to the general public. This marked the first time that the convocation ceremony did not take place on campus. The Capitol Theatre had opened a year earlier on Ste. Catherine Street, billing itself as “Canada’s finest playhouse” (Capitol Theatre, 1921.) The playhouse screened films continuously until the early 1970s, at which point it was demolished for the construction of an office building.
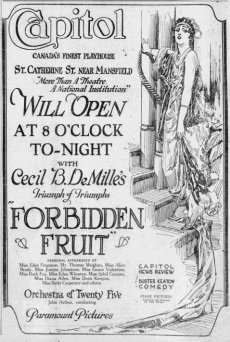
Montreal Gazette, April 2, 1921, p. 10
One hiccup did make the ceremony perhaps unusually memorable. While Dr. Gordon Laing, Dean of the Faculty of Arts, read his address, the theatre filled with an odour of smoke. According to the Montreal Gazette:
“At first disregarded, the smoke grew heavier and thicker. More nervous members of the audience fidgeted and many began to leave. In some sections of the hall groups deserted their seats, about 150 in all moving out or to the entrances. One of the marshals called out ‘Keep your seats. There's no fire,’ from the back, while others, as well as the theatre attendant, reassured those who were still disposed to leave. The cause of the supposed fire was searched for and was at last discovered to be the fact that the ventilating fans which furnish free air to the theatre were drawing in smoke from a nearby chimney… The dignitaries on the stage, and the graduates who occupied the body of the lower floor, did not show a sign of nervousness, and it was probably due to their sangfroid that no panic occurred” (“McGill conferred,” 1922).
An honourary degree was conferred to General John Pershing, G.C.B., General of the Armies of the United States, and leader of the American Expeditionary Forces during World War I. The Gazette reported that when Pershing took the stage, “the khaki and scarlet-clad figure stood rigidly at attention [while] the audience broke into cheers that were sustained for some time.”
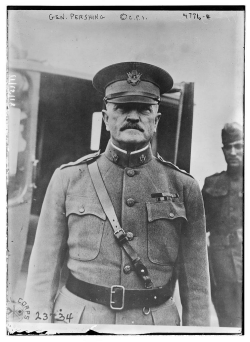
General Pershing (1918), courtesy of the Library of Congress
The McGill yearbook for 1922 is notable for the range and quality of illustrations noting each of the school’s departments. Additionally it contains some amusing comics, such as this rendering of a sloth skeleton with the caption: “Picture of prominent Prof. at dance, on being told that all the sandwiches had been eaten.” Notable alumnae that year include five women graduates from McGill’s Faculty of Medicine. One of them, Dr. Jessie Boyd Scriver, later became Montreal’s first female pediatrician (McGill University, n.d.).
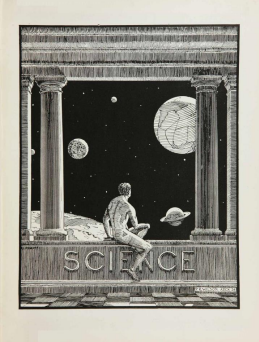
The McGill Year Book (1922), p.21
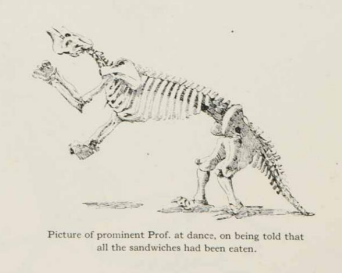
The McGill Year Book (1922), p.148
References
“1922”. (2022, February 6). In Wikipedia. https://en.wikipedia.org/w/index.php?title=1922&oldid=1070197106.
Bain News Service, P. (1918) Gen. Pershing, 1918. [Sept. 7] [Photograph] Retrieved from the Library of Congress, https://www.loc.gov/item/2014708132/.
Capitol Theatre (1921, April 2). Capitol will open at 8 o’clock tonight with Cecil B. DeMille’s triumph of triumphs Forbidden Fruit [Advertisement]. The Gazette, Montreal, 150(80), 10.
“Faith healing ministry of Aimee Semple McPherson”. (2022, February 7). In Wikipedia. https://en.wikipedia.org/w/index.php?title=Faith_healing_ministry_of_Aimee_Semple_McPherson&oldid=1070457178.
“McGill conferred over 2014 degrees: First regular convocation outside academic walls notable affair”. (1922, May 13). The Gazette, p. 10.
McGill University. (n.d.) Blazing trails: McGill’s women. Retrieved February 20, 2022 from https://www.mcgill.ca/about/history/features/mcgill-women.
McGill University Department of Biology. (n.d.) History of the biology department. Retrieved February 20, 2022, from https://www.mcgill.ca/biology/about-us/history.
McGill University. (1922). The McGill Year Book [Yearbook]. https://yearbooks.mcgill.ca/viewbook.php?campus=downtown&book_id=1922.
Met Office. (n.d.) Cirrocumulus clouds. Retrieved February 20, 2022 from https://www.metoffice.gov.uk/weather/learn-about/weather/types-of-weather/clouds/high-clouds/cirrocumulus.
[Old Biology Building (1922)]. [Photograph] (1922). McGill University Canadian Architecture Collection. https://cac.mcgill.ca/campus/buildings/James_Administration.html.
Old Port of Montreal. (n.d.). Clock tower. Retrieved February 20, 2022, from https://www.oldportofmontreal.com/activity/clock-tower.
Witzel, I. (1922). The gift: Aimee Semple McPherson, known as Sister Aimee, had some personality, some depth and some complexity, says playwright Bill Butt. [Photograph]. Toronto Public Library. https://digitalarchive.tpl.ca/objects/291114/the-gift-aimee-semple-mcpherson-known-as-sister-aimee-had.
On the Home Front: Convocation Day 1916
Convocation season is upon us once again! In celebration of the upcoming 2022 graduates, we are happy to resume our series on historic convocation ceremonies. These blog posts were written by students of the McGill University School of Information Studies as one part of an assignment focusing on DRAW, in the GLIS641 Archival Description and Access course (Winter 2022 semester). These students have graciously offered to share their blog posts with our readers. This week, we’ll be delving into the convocation that took place on May 12, 1916.
The sun rose early over Montreal on Friday, May 12, 1916: Convocation Day. The Gazette, Montreal’s newspaper and precursor of today’s Montreal Gazette, forecasted the day’s weather as “Fair and Cool.” As McGill’s newest graduates rose to greet their momentous day, they likely pulled on an extra layer before donning their traditional regalia as the temperature was a brisk 8.8C (48F) at 7:50 am.
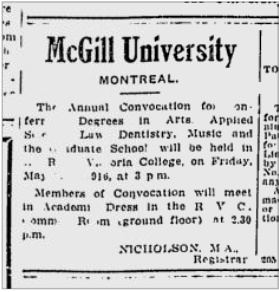
The Gazette, May 12, 1916, p. 8
The graduates met at the Royal Victoria College at 2:30 pm. According to weather observations made at the McGill Observatory that afternoon, the temperature was 10.67C (51.2F), on the cooler side for this time in May. Fluffy cirrocumulus clouds – usually associated with fair weather, as predicted by the Gazette – covered the entire sky. A strong breeze came from the northwest, likely ruffling the gowns of the graduates.
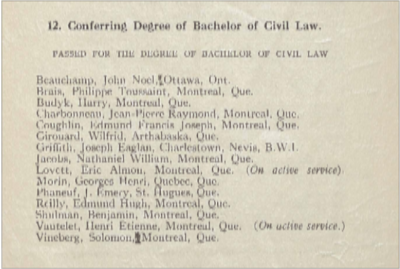
Annual Convocation Programme, 1916, p. 10
But the cool weather and overcast sky weren’t the only things casting a shadow over the McGill campus. It had been nearly two years since the outbreak of what was then known as the Great War, and although the battles were fought an ocean away, WWI deeply impacted the McGill community. This influence is demonstrated in the 1916 Convocation Programme, in which several graduates are identified as “on active service.” For example, two of the fifteen graduates awarded bachelor’s degrees in Civil Law, Eric Almon Lovett and Henri Etienne Vautelet were on active service.
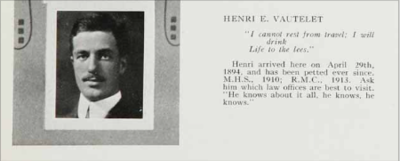
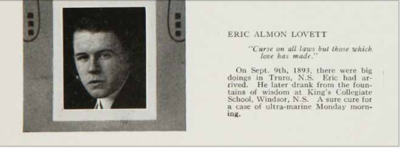
Yearbook profiles of Lovett and Vautelet, Old McGill 1916 Yearbook, pages 99 and 100
Men who had not yet enlisted were encouraged to join the No. 6 McGill Overseas Battery Siege Artillery, a unit organized in April 1916. (Voluntary recruitment would soon be replaced by conscription the following year, in 1917.) The academic year’s final issue of the McGill Daily, the student newspaper, devoted the entire back page to recruiting male students to the artillery unit. As this 1916 photo shows, over 150 men associated with McGill, whether students, graduates, or otherwise friends of the university, joined the unit before it deployed to England and then France.
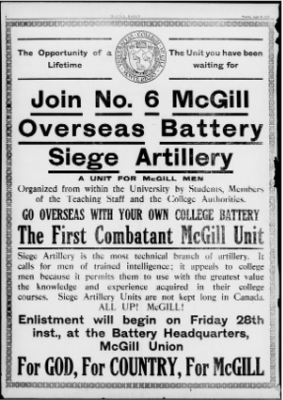
The McGill Daily, Special Battery Issue: April 25, 1916
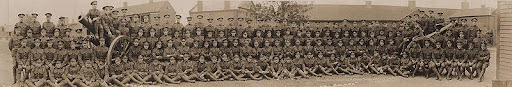
W. G. MacLaughlan, “No. 6 (McGill) Overseas Battery, Siege Artillery,” 1916. British Library.
During WWI, only men were allowed to enlist as soldiers to serve on the front lines; however, women also contributed to the war effort either on the frontlines as Nursing Sisters or from the home front, which would eventually lead to changing the roles of women in society. The 1916 yearbook reveals that McGill women engaged in one of the main home front efforts of WWI: relief knitting. McGill students established a chapter of the Red Cross Society at Royal Victoria College where they first knit “mufflers, mittens and socks” to send overseas and keep male soldiers warm, and later switched to creating “hospital supplies” such as bandages. The yearbook stated the upshot of the McGill Red Cross chapter, appealing to imperialist ambitions and Canada’s Dominion status: “It is very satisfactory to know that in the midst of their busy lives our girls are able to do some small thing for the comfort of the men who are risking their lives for the Empire.”
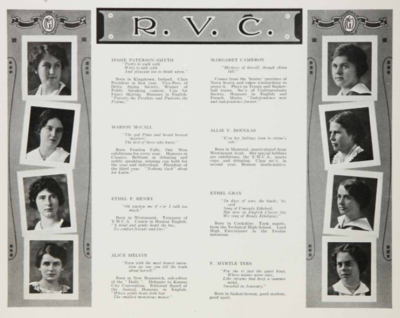
Women of Royal Victoria College, Old McGill, 1916, p. 38
The Great War marked daily life for McGill students graduating in 1916, as evidenced by the enlisted graduates fighting on foreign soil, the newly-established McGill Red Cross Chapter, and the dedication of the 1916 yearbook “to our heroes at the front.” Despite the excitement of Convocation, the graduates of 1916 were surely still worried about their fellows on the frontlines as they faced the cloudy day and an uncertain future.
References
The Gazette. (1916, May 12). https://news.google.ca/newspapers?nid=Fr8DH2VBP9sC&dat=19160512&printsec=frontpage&hl=en.
Government of Canada. (2017, March 29). “Women Veterans: Timeline.” https://www.veterans.gc.ca/eng/remembrance/those-who-served/women-veterans/timeline.
Library and Archives Canada/Bibliothèque et Archives Canada. (No date) “Artillery.” https://www.bac-lac.gc.ca/eng/discover/military-heritage/first-world-war/Documents/artillery.pdf.
MacLaughlan, W.G. (1916). “No. 6 (McGill) Overseas Battery, Siege Artillery.” Made available via the British Library. http://www.bl.uk/manuscripts/FullDisplay.aspx?ref=HS85/10/31991.
McGill University. (1916, April 25). The McGill Daily, Special Battery Issue. https://archive.org/details/McGillLibrary-mcgill-daily-special-battery-issue-april-25-1916-5943/.
McGill University. (1916). Old McGill 1916. https://yearbooks.mcgill.ca/viewbook.php?campus=downtown&book_id=1916.
A Snowy Convocation: April 30, 1909
Convocation season is upon us once again! In celebration of the upcoming 2022 graduates, we are happy to resume our series on historic convocation ceremonies. These blog posts were written by students of the McGill University School of Information Studies as one part of an assignment focusing on DRAW, in the GLIS641 Archival Description and Access course (Winter 2022 semester). These students have graciously offered to share their blog posts with our readers. This week, we’ll be delving into the convocation that took place on 30 April 1909 for the faculties of Arts, Science, and Law.
In the days leading up to the convocation, Montreal experienced gloomy and cool spring weather. Clouds and overcast skies graced the city between the 26th and 29th, with only brief periods of clear skies. On the 29th of April, as McGill graduates eagerly awaited the next day’s ceremony, where they would be celebrated for their accomplishments, they were met with temperatures of a high of 38.1ºF (3.4ºC) and a low of 29ºF (-1.7ºC). This coolness would persist to the day of the ceremony, with an additional surprise. By 7:40 am, as the graduating class of 1909, otherwise known as the “Naughty Nines”, woke and began to prepare their caps and gowns, snow had begun to steadily fall upon the city. It would not be long before Montreal was almost completely covered in white.
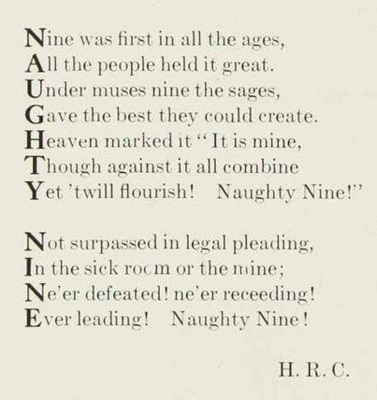
Poem in the McGill yearbook in honor of the 1909 (“Naughty Nine”) graduates.
Those familiar with McGill’s current convocation traditions, where ceremonies take place in a tent on campus’ Lower Field, will be relieved to know that the 1909 convocation was an indoor affair and took place in Royal Victoria College (RVC) on Sherbrooke St. West (now known as the Strathcona Music Building). While attendees would be spared the elements during the ceremony, graduates nevertheless needed to bear the peak of the storm. Indeed, they were instructed to meet in the RVC Library in their academic dress at 2:35 pm in preparation for the ceremony. By the afternoon, however, 2.9 inches (7.4 cm) of snow had accumulated and strong south-easterly winds would have made the trek to RVC particularly challenging.
Announcement in the Montreal Gazette for McGill 1909 graduates attending the convocation ceremony.
In spite of the less-than-ideal and blusterous weather, the convocation ceremony proceeded promptly at 3:00 pm and degrees were conferred to the Naughty Nine graduates with much merit. The 1909 convocation is also a significant moment in history as a law degree was granted to Peter Hing, the first Asian-Canadian to attend McGill University. As the proceedings came to a close, students exited the shelter of RVC to once again brave the elements. Over the course of the ceremony, the snow had turned to rain, making their first moments as university graduates particularly slushy. At least they could take solace in knowing that they had, after years of hard work, graduated. Finally.
Do you have a weather-related topic that you would like to share with your fellow citizen scientists? Send us an email with your idea to draw.mcgill@gmail.com for a chance to be featured on the DRAW blog!
References
Montreal Gazette. (1909, 30 April). https://www.proquest.com/historical-newspapers/april-30-1909-page-9-16/docview/2149589268/se-2?accountid=12339.
Montreal Gazette. (1909, 1 May). https://www.proquest.com/historical-newspapers/may-1-1909-page-11-20/docview/2149500969/se-2?accountid=12339.
Old McGill. (1909). McGill Yearbooks. https://yearbooks.mcgill.ca/viewbook.php?campus=downtown&book_id=1909#page/18/mode/1up.
Lady Dawson and the Waterspout
This week on the DRAW blog, we’re returning to the Dawson-Harrington fonds and exploring an especially remarkable weather observation made by Lady Dawson!
Margaret Dawson (née Mercer), otherwise known as Lady Dawson, was the wife of geologist (and McGill Principal!) Sir John William Dawson. In the late-nineteenth century, Lady Dawson would summer at the family cottage (Birkenshaw) in Métis-sur-Mer, a popular destination on the St. Lawrence River for McGill professors and their families. Summers in Métis, although idyllic, were also laden with storms and, sometimes, extreme weather phenomena. In fact, in a letter to son George, who was then in British Columbia with the Geological Survey of Canada, Lady Dawson recounts a particularly frightening weather observation.
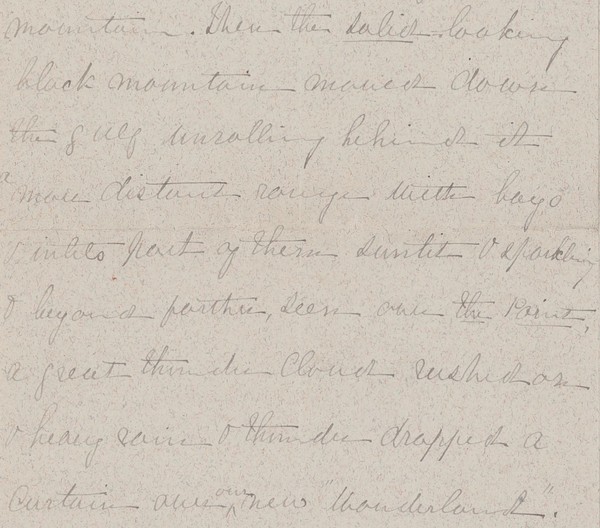
Lady Dawson describing the waterspout occurring over the St. Lawrence River in Métis-sur-Mer.
The observation begins with Lady Dawson describing how the summer residents of Métis experienced “miserably cold, stormy weather.” “It began to rain on the evening of Sunday the 28th June,” she laments, “and four days & nights, it poured without an hour’s cessation.” The rain cleared by July 5th, only for Lady Dawson to witness quite a sight. She writes:
“A few miles from shore a most wonderfully dense dark, almost black, slate-coloured fog bank in the form of a high mountain sloping off towards the south shore. Shortly after a tall symmetrical pillar of light fog, like smoke, steamed away from a little below the summit, giving an exact representation of a volcanic mountain. Then the solid-looking black mountain moved down the gulf, unrolling behind it a more distant range with bays & inlets, part of them sunlit & sparkling & beyond farther […] a great thunder cloud rushed on & heavy rain & thunder dropped a curtain over our new ‘wonderland’.”
While she confesses that both she and daughter Anna were initially startled by (what seems to have been) the waterspout, Lady Dawson also mentions that it was “very remarkable.” Waterspouts, columns of wind rotating as a funnel-shaped cloud over a body of water, occur only rarely on the St. Lawrence, making the Métis waterspout a remarkable sighting indeed!
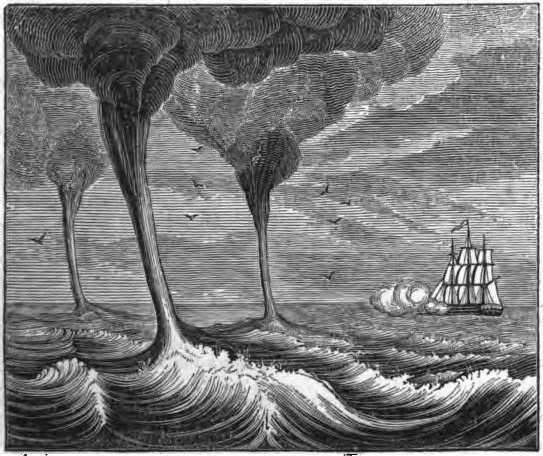
Engraving of a waterspout from James Pollard Espy’s The Philosophy of Storms.
Introducing DRAW Members: Lori Podolsky
Introducing…
Who:
Lori Podolsky
From:
The Prairies (Manitoba and Saskatchewan)
Role at DRAW:
My role is a few different things. I am the archival liaison and provide support on the archival aspect of DRAW. I also help with metadata and other general areas.
Favourite part of DRAW?
I like all aspects of DRAW and think it is a great initiative. I wish I understood and knew more about the IT and coding part of DRAW.
Favourite Season?
Summer
Favourite Weather Symbol?
The aurora. Growing up on the Prairies I would see the Northern Lights dancing across the night sky. These were magical moments in my childhood and deeply cherished memories.

Favourite Cloud Type? Why?
I like the white fluffy cumulus and the dark, stormy nimbostratus clouds. The cumulus clouds are a symbol of the perfect idyllic summer day. Lazing in the sun and enjoying the warmth of the day. The nimbostratus clouds represent Prairie storms with vibrant lightning and deafening thunder. Both are perfect times to curl up with a good book.
Nimbostratus clouds by PiccoloNamek~commonswiki
(Wikimedia Commons, CC BY-SA 3.0)
Coolest thing you’ve learned while participating in DRAW?
It's difficult to pick the coolest thing I learned while participating in DRAW. The more I participate, the more cool things I learn. I have learned about our meteorological history and the importance of studying weather (that's cool!) and what people thought of weather in the comments and remarks in the weather ledgers (they also had to change from summer to winter treads every year just as we do now). It was cool to learn how the app and website got developed and to participate in that. I also enjoyed training students on how to transcribe and in transcribing myself. I guess the coolest thing I have learnt is that with DRAW I am always learning something!
And of Course:
Sweet or Salty?
Salty
Star Wars or Star Trek?
Star Wars
Cats or Dogs?
Dogs
Favourite Animal?
My dogs <3
Favourite place in Montreal?
Hanging out on my balcony with my dogs
Lori's fur children - her dogs!
Anna Lois Dawson Harrington’s Stormy Weather Observation
Surprise! In honour of International Women's Day, we are bringing you an extra blog with a woman's weather observations. This week on the DRAW blog, we are once again delving into the Dawson-Harrington fonds and examining a weather observation from another Dawson child; Anna Lois Dawson Harrington.
Anna Lois Dawson Harrington was the daughter of geologist (and McGill Principal!) Sir William Dawson, wife of mineralogist Bernard Harrington, and a naturalist in her own right. Between the late-nineteenth and early-twentieth centuries, Anna would summer in Métis-sur-Mer, where she collected botanical specimens (sometimes with the assistance of her children) and painted natural landscapes. She would also vividly describe the weather in letters to her husband (whose work in Montreal often kept him from joining the family until later in the summer). In July of 1878, for instance, she recounted the progress (and ensuing damage) of a particularly violent storm.
“The morning opened wet, cold & stormy,” she begins, “the wind continued to rise till the waves were tremendous.” As the storm worsened, Métis’ summer residents, consisting mainly of McGill professors and their families, hastened to the beach in the hopes of salvaging their sailboats. “Oh how cold it was,” Anna continues, “rain drawing into our faces like sharp bits of glass, wind howling.”
In addition to describing the damage sustained by various families’ schooners, she regales Bernard with an especially perilous rescue attempt: “We came back just in time to see another nondescript large-looking vessel break loose & the crew after a faint attempt to head to the open, determined to see her ashore & in she rushed just opposite the Majors’, they threw out a rope wh[ich] Percy Selwyn dashed in through the foam & boulders to catch […] When the men got safely in, a poor little dog was descried on the stern […] and though we shouted at him not to, Percy w[oul]d go & get the poor little beast – it really was dangerous among the waves….”
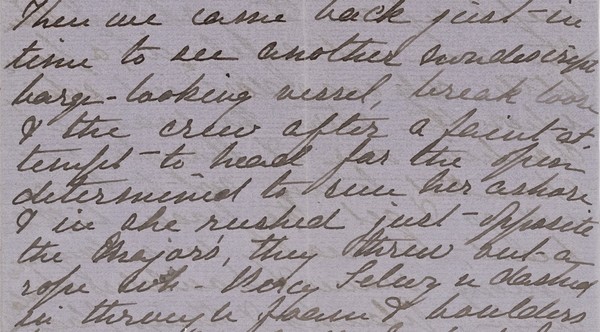
Anna Lois Dawson Harrington describing the ensuing damage of the storm to husband Bernard.
The account concludes with Anna dryly remarking, “As you may suppose the wet-day was not of the monotonous order.” While it is unclear when Bernard received his wife’s letter, Montreal experienced consistent periods of rain, cloud, and lightning, within a week of its composition. You might say that Anna sent the storm (or some of it, at least) along with her letter!
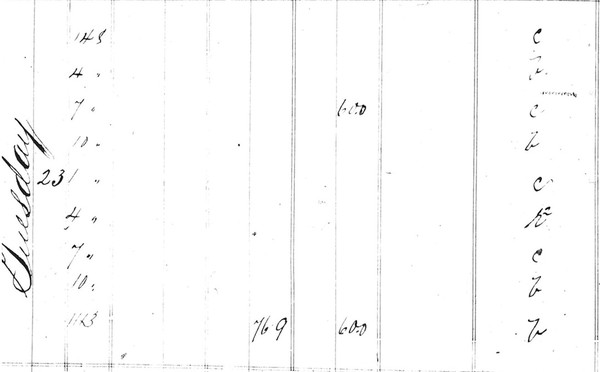
Weather observation taken at the McGill Observatory on 23 July 1878, featuring periods of clouds and heavy rain.
Do you have a weather-related topic that you would like to write about for the DRAW Blog? Send us an email with your idea to draw.archives@mcgill.ca for a chance to be featured.
References
Harrington, Anna Lois Dawson. MG 1022-5-014-0013. 22-23 July 1878. McGill University Archives. https://archivalcollections.library.mcgill.ca/index.php/letter-23-july-1878.
McGill Observatory. 22-24 July 1878. DRAW: Data Rescue: Archives & Weather.
Introducing DRAW Members: Yumeng Zhang
Introducing…
Who:
Yumeng Zhang
From:
Beijing, China
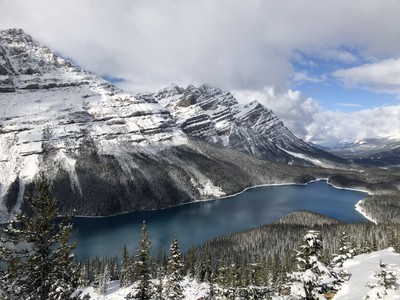
Last year, Yumeng captured this breathaking view of
Peyto Lake in Banff National Park, AB
Role at DRAW:
Secondary developer of the DRAW website
Favourite part of DRAW?
The interdisciplinarity! It's so exciting that I can learn so many things from different fields in this single project.
Favourite Season?
Summer
Favourite Weather Symbol?
Aurora
Favourite Cloud Type? Why?
Cumulus. This is the kind of fluffy cloud that makes me think of cotton candy.
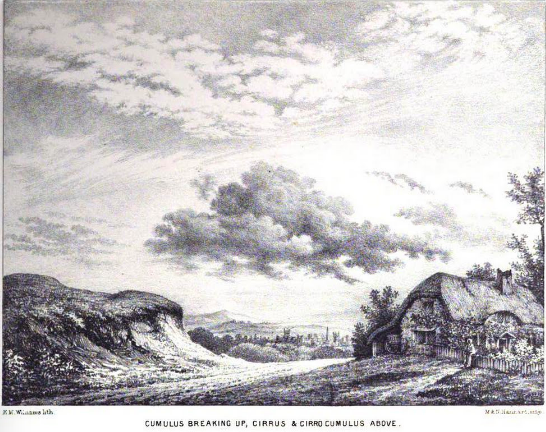
Coolest thing you’ve learned while participating in DRAW?
The coolest thing I've learned is to develop a web-application using Ruby on Rails. I've learned so many things such as how to add features and how to troubleshoot.
And of Course:
Sweet or Salty?
Sweet
Star Wars or Star Trek?
Star Trek
Cats or Dogs?
Cats
Favourite Animal?
Bear
Favourite place in Montreal?
Old Port
Keep checking out the blog to see more DRAW Member Introductions in the coming weeks alongside our usual content!
Lawrence Mysak’s Memoirs - Part Three
As you will have read in our last two blog posts, we have the privilege of publishing three extracts from the memoirs of McGill Emeritus Professor Lawrence Mysak, who made enormous contributions to 20th and 21st century climatology, especially in oceanography, climate variability, climate modelling, and other fields we’ve read about in this series. Professor Mysak supervised Professor Andrew Weaver, former leader of the BC Green Party and now once again a Professor at the University of Victoria, and DRAW member Victoria Slonosky as graduate students, among the many students he supervised over the course of his career. We both agree that he was an inspiring teacher and mentor!
The McGill University Archives has recently received Professor Mysak’s papers, which will be available for future researchers and historians of science.
Caught in a Rip Current, Waikiki Beach, Honolulu (written May 2018)
The New Otani Kaimana Beach Hotel is at the eastern end of Waikiki Beach. The landmark Diamond Head volcano rises steeply just behind the hotel. The setting of the crimson sun is a marvel to watch from the hotel’s Hau Tree Lanai Restaurant. Janet and I had a romantic dinner there in February 2014 after I proposed to her. But I didn’t tell her that I nearly drowned in front of the hotel in the early 1990s.
In February 1991, an international climate committee invited a group of us to Honolulu to write a scientific report on our understanding of the mechanisms that produced mid-latitude climate variability on the decadal timescale. The committee asked us to answer the following questions: What is the source of this variability? Is it due to strong El Nino-type oscillations in the tropical Pacific which propagate to the mid-latitudes? Or are strong air-ice-ocean interactions that occur in the Arctic able to force decadal climate changes at lower latitudes?
I and a few others believed in the second mechanism, but a distinguished climate scientist from Boulder, Colorado said, “Mysak, you are full of beans. There is no way those Arctic interactions in such a small area can significantly affect lower latitude climate.
Most of the workshop attendees sided with the Boulder scientist and hence supported the first mechanism. Consequently, I left that afternoon with disappointment written all over my face. I lost the debate. I then retreated to the Kaimana Beach hotel for a relaxing swim.
In the 1980s I collaborated with Hawaiian Professor Lorenz Magaard on subsurface Rossby waves in the North Pacific. These waves impact on submarine detection, a topic of obvious interest to the US Navy. Thanks to the Navy’s support, my late wife Mary and I were frequent visitors to Honolulu and guests at the hotel. Lorenz often joined us for dinner at the Hau Tree Lanai Restaurant.
One day, Lorenz said, “Why don’t we swim out to the coral reef? It’s just 200 m offshore from the hotel.”
We did this with ease and rested our bums gently on the edge of the sharp reef. There the waves splashed warm, salty water over our faces. The trade winds cooled our faces. The murmur of the breaking waves was soothing. “What bliss!” I shouted.
In February 1991, my swim to the reef from the hotel beach turned into a nightmare. As in the 1980s, I swam out to the reef and rested there. Then I decided it would be fun to go around the corner of the reef and head out to the open ocean. I could see wind surfers having a ball out there, and I wanted to join them. This was an easy swim as there was a rip current that flowed past the side of the reef. I simply swam with the flow, happily washing away my disappointment of the day. It did not occur to me that I might have trouble getting back to shore.
A good swimmer can normally do one body length per second – for a tall person that means 2 m/s. I can keep up this speed for maybe 50 to 100 meters. However, rip currents are much stronger, generally being around 4 to 5 m/s. This was certainly the case here. I quickly decided I had better start swimming back to shore. But I could not make any progress. Despite my strongest efforts, I was slowly drifting farther out to sea. I started to panic.
“Is this it for me?” I asked myself. There were no life guards or other swimmers near the shore, and so a cry for help would be futile. I was scared as hell.
I thought of three possibilities. I might drown right there – I could only tread water for so long. Then I thought I could try swimming along the offshore side of the reef, going parallel to the shore, which would take me towards downtown Honolulu. But once past the reef I would still need to swim back to shore a great distance – about one kilometer. I did not have the strength to do such a long swim. Finally, in desperation, I decided to work my way along the side of the reef toward shore, using my hands to claw myself forward. While doing this, however, I drew blood on my hands, which reddened the water. I looked a mess. I looked over my shoulder to see if a shark was sneaking up behind me.
Thankfully, after about 15 minutes of this hard and painful work, I did get back to the inshore side of the reef. There I rested my weary body and washed my wounds. My hands stung. The minutes of rest seemed like hours. But I finally swam back to shore from the reef.
To this day, I have never told anyone of this near-death experience. I was foolish to do what I did, especially having studied ocean and wave dynamics. But I learned my lesson well.
Lawrence Mysak’s Memoirs - Part Two
As you will have read in our last blog post, we have the privilege of publishing extracts from the memoirs of McGill Emeritus Professor Lawrence Mysak, who made enormous contributions to 20th and 21st century climatology, especially in oceanography, climate variability, climate modelling, and other fields we’ll read about in this series. Professor Mysak supervised Professor Andrew Weaver, former leader of the BC Green Party and now once again a Professor at the University of Victoria, and DRAW member Victoria Slonosky as graduate students, among the many students he supervised over the course of his career. We both agree that he was an inspiring teacher and mentor!
The McGill University Archives has recently received Professor Mysak’s papers, which will be available for future researchers and historians of science.
El Niño and Me (written July 2018)
A sweet but mysterious fragrance hits our nostrils as we drive away from Tel Aviv airport in April 1983. “Its from the orange trees, now bursting with ripe fruit,” my wife’s friend Mikael says. “We’ll see many of these trees around Rehovot, where I live. We’ve not had fruit crops like these for many years. It’s probably because we’ve had a huge amount of rain this spring. And the deserts are blooming with bright red and yellow flowers.”
We didn’t think much further about these unusual conditions during our family visit to Israel. Instead, we focused on touring the historic sights of Jerusalem, Masada and the Dead Sea. Also, I was preparing presentations on theoretical oceanography to be given in Rehovot and Haifa.
After returning to Zürich, where I had been on sabbatical since September 1982, I continued developing mathematical models of varying current patterns in the Swiss lakes. In May 1983, I gave a seminar on this topic at the marine institute in Kiel, Germany. There Professor John Woods, a distinguished oceanographer from England, showed me recent maps of the sea surface temperature of the tropical Pacific. In a wide swath along the equator, the ocean temperatures were a remarkable 2 to 3 ͦC above the long-term average.
“This is the El Niño of the century,” said John. “This huge pool of warm water generates long atmospheric waves which propagate around the globe at mid-latitudes. These dramatically alter the precipitation patterns in North America, Europe and the Middle East.”
So, this is probably what produced the unusual crops and flowers in Israel. Clearly, I had to learn about El Niño, and I looked forward to doing so after returning in September 1983 to my academic home in the Mathematics Department at UBC, where teaching maths was my livelihood.
El Niño is a warming event in the tropical Pacific Ocean that occurs every three to seven years and lasts about twelve months. El Niño means “the Christ child” in Spanish and is used to describe these warming events since they start around Christmas. Alternating with El Niño is La Niña, a cooling event of the tropical Pacific Ocean.
In late 1983, I became even more intrigued about the 1982-83 El Niño when Cornelis Groot, a fisheries scientist from Nanaimo, showed me the latest statistics on the salmon migration routes in the northeast Pacific. In fall 1983, 85% of the Fraser River Sockeye salmon came home to spawn via the northeast end of Vancouver Island. The remainder returned to the Fraser River via Juan de Fuca Strait, to the south of Vancouver Island. In the past, returning Sockeye mostly took the southern route. The 1982-83 El Niño event caused unusually warm water west of Vancouver Island. Since salmon prefer cold water, the returning Sockeye were farther north than usual, close to Alaska, and hence came home via the northern route. This was good news for Canadian fishers since treaty agreements do not allow American fishers to catch Sockeye in Canadian waters east of Vancouver Island.
I was hooked. El Niño (EN) became my focus from that point on. While boning up on El Niño, I learned about an atmospheric circulation pattern in the tropical Pacific called the Southern Oscillation (SO) which is coupled to it to create a complex climate phenomenon known as ENSO. I wrote a review entitled “El Niño, interannual variability and fisheries in the northeast Pacific Ocean” about ENSO and El Niño which was published in 1986. It is now one of my most highly cited papers, which may sound strange since I knew nothing about ENSO before my 1982-83 sabbatical. In retrospect, an observation made during a family visit to Israel sparked a change in my own career.
In the early 1980s, natural climate variability (like ENSO) and global warming due to our massive burning of fossil fuels caught the attention of the press and the public eye. My Harvard classmate, George Philander, wrote a colorful article about ENSO for National Geographic. I pinched his pictures for my public lectures about ENSO and fisheries. I also started thinking that I would like to work in a place where climate research was strongly supported. UBC was not likely to become active in this field. When approached by Environment Canada about sponsoring a professorship in climate research, the university administration declined to participate because of financial constraints at UBC. This reinforced my thoughts of a mid-career move. I was 44.
Early in 1985 I sent my CV to colleagues in six attractive places where I might do oceans and climate research, namely, Honolulu, Seattle, Corvallis (Oregon), Zürich, Hobart (Tasmania), and Montreal. This led to two interviews, the first in March at McGill, and the second in May at the National Oceanography Lab in Hobart. In June McGill offered me a newly created Chair in Climate Research in the Department of Meteorology, where I was expected to initiate an internationally recognized climate research program. Shortly afterward, the Hobart Lab offered me the position of Chief Scientist to head up research on oceanography, climate and fisheries. With these two offers, it became clear that my career was going in a new direction and that I could soon be facing interesting challenges.
But I was in a quandary. I loved the interdisciplinary aspect of the job in Hobart. But this would be in a non-academic setting. On the other hand, at McGill I would be in a department for which I had no formal training. However, McGill was known to attract excellent graduate students. But, would I miss teaching mathematics? When word got out that I might leave Canada for Australia, colleagues pressed me to accept the McGill position. This I did in July 1985.
The move to McGill provided me many new opportunities. With funding from McGill and the Quebec government, I founded the multi-faceted Centre for Climate and Global Change Research in 1990. This attracted highly motivated graduate students, as well as a steady stream of visitors from abroad. I expanded my research interests to include the Arctic climate system, paleoclimates and modelling future global warming scenarios. I also developed interdisciplinary courses in climate and paleoclimate dynamics, which were popular with the students.
Having now been retired for eight years, I look back with fondness on the 80 graduate and postdoctoral students that I have supervised or co-supervised. They are my “academic children”. Twenty-one are now professors in about a dozen countries. It is gratifying to know that they are furthering our understanding of the oceans and their role in climate change. In addition, many of them are informing the public about the environmental dangers due to global warming such as rising sea levels, ocean acidification, extreme storm events and intense heat waves. These students are also helping us learn about the mitigating actions that we can take to sustain life on this planet.
Lawrence Mysak’s Memoirs - Part One
In the next few posts we have the privilege of publishing extracts from the memoirs of McGill Emeritus Professor Lawrence Mysak, who made enormous contributions to 20th and 21st century climatology, especially in oceanography, climate variability, climate modelling, and other fields we’ll read about in upcoming posts. Professor Mysak supervised Professor Andrew Weaver, former leader of the BC Green Party and now once again a Professor at the University of Victoria, and DRAW member Victoria Slonosky as graduate students, among the many students he supervised over the course of his career. We both agree that he was an inspiring teacher and mentor!
The McGill University Archives has recently received Professor Mysak’s papers, which will be available for future researchers and historians of science.
Summer 1961: Dr. John Weaver, Supervisor (written April 2018)
“John, this is Lawrence from Montreal. How are you getting along on the balmy west coast?” I ask over the phone.
“Just fine, thanks,” John replies. “I’m still enjoying morning walks with my fellow seniors. Keeps me in shape.”
“That’s great. Janet and I are visiting Victoria and wondered – are you free for coffee tomorrow afternoon?
“Certainly,” he says. “How about at 3 p.m.? I’ll pick you up where you’re staying.”
In December 2017, my wife Janet and I were in Victoria for Christmas with her son and family. Whenever I visit Victoria, I always like to see John and his charming Ukrainian wife, Ludmilla. John is the consummate Englishman – polite, cultured and an accomplished scientist; he’s also keen on soccer. More than half a century ago, he was a game-changer for me when in summer 1961, I worked in Victoria at the Pacific Naval Lab (PNL), a federal research institution.
I had just graduated from the University of Alberta, and the PNL job gave me insight into a possible future career as a scientist. John Weaver, on the other hand, just finished a PhD in geophysics from the University of Saskatchewan and was starting his career at PNL in 1961.
When I arrived at PNL, I started working for oceanographer Dr. Harold Grant. I computed energy spectra of ocean temperature and velocity measurements using a slide rule. This sounds complex, but in fact I just multiplied numbers in one column with the numbers in another column, and then added. I was bored, but I had to make a presentation about my project to the staff. I said diplomatically, “Surely, there must be another task in which I can use my advanced maths and physics.”
Dr. Grant looked stunned. But to his credit, he asked his junior associate Blyth Hughes and the young Dr. Weaver, “Do you think you could find a fluid mechanics problem that Mr. Mysak might tackle for the rest of the summer?” I was grateful to Dr. Grant for understanding my dilemma and allowing me to take on a project of more mathematical interest.
Next day, they suggested I try to solve the equations that describe the flow past a probe used in ocean turbulence measurements. Since I had never taken a course in fluid mechanics, I pored over the treatise Boundary Layer Theory for help to solve this problem. While Hughes was my immediate supervisor, it was Dr. Weaver who tutored me in fluid mechanics, one of his passions. Step by step, he led me through the maths that resulted in an approximate solution to the assigned problem. I was thrilled with the project and wrote a lengthy report at the end of the summer. Dr. Weaver also gave me many tips on how to do research. “You have to always look for another approach if one fails,” he said. At the end of the summer, I thought that a problem in fluid mechanics would be a fascinating topic for a PhD thesis.
Dr. Weaver also added an extra dimension to the lives of us summer students working at PNL. During evenings Weaver taught us the finer skills of soccer, and on weekends we played friendly games with other regional teams. That fall Ludmilla gave birth to a son, Andrew.
After my summer in Victoria and a year of graduate study in Australia, I entered Harvard in fall 1963 for my PhD in applied mathematics and engineering science. Dr. Weaver was delighted that I asked him for a letter of reference for Harvard – it must have been a good one, because in addition to acceptance I received a scholarship which covered my tuition. At Harvard I returned to the topic of my PNL research. In addition to fluid mechanics, I loved studying aerodynamics and, new to me, geophysical fluid dynamics (GFD). My PhD research focused on the GFD topic of continental shelf waves.
Beginning in 1984, I tried to inspire another young student, in the manner that John had inspired me two decades ago. During 1984-87, I supervised at UBC the PhD research of John’s brilliant son Andrew Weaver. It was a pleasure for me to watch Andrew, with his intriguing British/Ukrainian temperament, go on to an outstanding career as a professor of oceanography and climatology at the University of Victoria. Today he’s the very busy leader of the BC Green Party. Consequently, when I visit Victoria, I don’t see my former student, but instead see his father, my friend John, who was my inspiration in 1961.
John moved to the University of Victoria in 1963, and retired in 1998, but our friendship continued to develop. We had fun serving on research grant selection committees together, and colleagues told me that he was a widely respected Dean of Science before retirement. As we are now both retired, we love to chat about former students and colleagues and discuss the challenges and frustrations of university politics. I hope we continue to meet for coffee for a long time to come.
William Bell Dawson's Weather Observation
This week on the DRAW Blog, we welcome a guest author: Giuliana Garofalo is a second-year student in the Master of Information Studies program at McGill University, and a dedicated DRAW volunteer.
As we celebrate (or come to terms with) the first snow to announce the arrival of winter, we’ll travel to November of 1869, where a letter from William Bell Dawson reveals an early start to the season.
Between 1868 and 1872, a series of correspondence was exchanged between William and his older brother George, who was studying at the Royal School of Mines in London. While he often claimed to have little time to write and even less to say, William (who was then fifteen years old) always managed to fill his letters with vivid descriptions of natural phenomena, including the Montreal weather. In one letter dated 17 November 1869, he describes particularly harsh weather conditions. "On the Sunday before last," he relates, "we had a snow storm in which perhaps 10 in of snow fell and last week it froze."
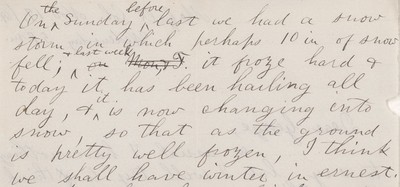
As the letter continues, it is revealed that the weather only worsened. "Today it has been hailing all day," he writes, "and it is now changing into snow, so that […] the ground is pretty well frozen." According to data taken that day from the McGill Observatory, which would have been walking distance from the Dawson’s residence in the east wing of what is now the Arts Building, it would ultimately snow a total of 3.10 inches [7.9 cm], a considerable amount when added to the previous 10 inches [25.4 cm]. It is perhaps for this reason that William concludes his weather observation with, "I think we shall have winter in ernest [sic]."
Do you have a weather-related topic that you would like to write about for the DRAW Blog? Send us an email with your idea to draw.archives@mcgill.ca for a chance to be featured.
Weather Sayings: China
This week on the blog let's take a look at weather sayings, commonly found in old farmer's almanacs. These phrases convey weather phenomena and help to explain to the masses what is going on and why. We discussed this sort of thing when we looked at Vennor's Weather Bulletin! Did you know that these weather forecasts are a world wide thing? Today we are looking at those found in Chinese tradition.
“蜻蜓低飞要下雨。”
--If you see a dragonfly flies low, it means it’s going to rain soon.
“朝霞不出门,晚霞行千里。”
--Red sky at night, sailor’s delight. Red sky in the morning, sailor take waring.
“日晕三更雨,月晕午时风。”
--Halo around the sun or moon, rain or snow soon.
“蚂蚁搬家,天将雨。”
--When ants swarm, expect a rainy day.
Similar to ‘When ladybugs swarm, expect a warm day.’
“蜜蜂迟归,风雨来吹。”
--If bees stay at home, rain will soon come. If they fly away, fine will be the day.
Do you know of any weather sayings local to your area? Let us know on Facebook or Twitter!
Meet the Meteorologists: United Kingdom
Welcome back to Meet the Meteorologists where we look at the individuals around the world who helped to contribute to the creation of meteorology as a field of study and who helped inform the practice here in Montreal.
These individuals were often interested in weather as how it connected to their day jobs. They were often intellectuals, religious figures, engineers, doctors or businessmen in communities and helped contribute to our understanding of weather in the St. Lawrence basin where Montreal resides. All individuals mentioned in this series were taken from Climate in the Age of Empire by Dr. Victoria Slonosky.
This week let’s take a look at those influential individuals from the United Kingdom!
William Derham (1657-1735)

By Unknown author - Scan from an 18th century text, taken from https://www.flickr.com/photos/63794459@N07/6466254413/sizes/o/in/photostream/, Public Domain, Link
Derham was a clergyman as well as a natural historian and member of the Royal Society. As rector of Upminster in Essex, he kept detailed meteorological records, which he published in the Philosophical Transactions of the Royal Society starting in 1697. He was in correspondence with others across Europe who also kept daily observations and used the records they sent or published, including those published by the scientists of the Royal Observatory in Paris, to compare weather conditions across Europe. He was especially interested in atmospheric pressure and its variations. The most notable of his weather analyses was his work describing and identifying the successive waves of cold during the “Great Frost” winter of 1708, which devastated much of western Europe. He also used measurements of air pressure with a barometer to infer elevation. He delivered the Boyle lectures of 1711 and 1712, which were later published as his popular work on natural theology Physio-Theology. He was a close friend of John Ray and knew many of the other scientists of this time, including Isaac Newton and Edmond HAlley. He was appointed chaplain to the Prince of Wales in 1716, after which he spent part of his time in Windsor, moving his instruments there. He also became interested in astronomy during his later years.
Learn more:
Daines Barrington (c.1728-1800)

By 1795 engraving - http://www.superstock.co.uk/stock-photos-images/4069-1437, Public Domain, Link
Daines Barrington was the fourth son of Viscount Barrington and trained as a lawyer and legal scholar. However, his main occupation was an antiquarian and natural historian. He was elected a fellow of the Royal Society. One of his notable contributions to science was the publication of The Naturalist’s Journal, a set of printed forms consisting of one week per page, with vertical columns for the methodical recording of weather, wind, plants in flower, and other natural phenomena. Barrington sent a copy of the Journal to Gilbert White and encouraged White’s observations and the eventual publication of White’s The Natural History of Selborne, which was proven to be one of Charles Darwin’s early inspirations. Barrington was also an enthusiastic supporter of Arctic voyages and of the search for the Northwest Passage to the Orient by way of the Arctic Ocean north of Canada. He mobilized the Royal Society’s support of voyages of discovery, including Captain James Cook’s third voyage to the Pacific. His varied interests and enthusiasms did not always lead to meticulous research, and there were some doubts to his accuracy and credibility in his antiquarian work. His combination of classical scholarship and natural history, however, led him to combine the two in his examination of ancient literature for evidence of climatic change.
Learn more:
John Dalton (1766-1844)

By Charles Turner - This image is available from the United States Library of Congress's
under the digital ID cph.3b12511.
This tag does not indicate the copyright status of the attached work. A normal copyright tag is still required. See Commons:Licensing for more information., Public Domain, Link
Dalton’s most significant contribution to science is his theory of the atom. A Quaker, Dalton’s family was not well off and he entered into domestic service at the age of ten. Given his aptitude for scholarship, he was encouraged to become a schoolmaster; when this failed, he worked as an agricultural labourer. He eventually returned to teaching and was encouraged to keep a meteorological diary, which he did until the day of his death: a neighbour claimed that he could set his watch by the moment when Dalton opened his window to read his thermometer. Dalton’s 1793 publication of Meteorological Reflections and Essays concerned not only his observations but also his theories on air, water, vapour, and rain, which led to his theory of the atom. His meteorological interests also led to a quantitative investigation into the hydrological cycle, and it is from this interest in rain and water vapour that he developed his theories on the dynamics of fluids and gases, today known as “Dalton’s Law”.
His major breakthrough in the theory of the atom was to recognize that gases combined in fixed ratios, which led to the idea that each element has a characteristic atomic weight. It was through these quantitative methods of measuring the weights of gases that individual elements could be identified. Compounds, including compound gases such as carbon dioxide, were a combination of different elements in strict proportions. Dalton’s ideas lead to a revolution in atomic chemistry. Although he completed an “astonishing amount of scientific work” in his lifetime, “the subject he had always cared about more than any other” remained meteorology.
Learn more:
- Wikipedia
- Britannica
- Science History Institute
- Biography.com
Luke Howard (1772-1864)

Public Domain, Link
A Quaker chemist, Howard is remembered today as one of the founders of the science of meteorology and climatology. His two great contributions were the naming and classification of clouds and his long-standing observations on urban climatology published in The Climate of London. His work on a single classification schema for clouds led to a better understanding of their formation and role in precipitation. Howard was elected a member of the Royal Society in 1821 and was a founding member of the first Royal Meteorological Society. His personal meteorological observations and work on The Climate of London are the first known publications in English of the urban heat island effect, demonstrating that cities have a noticeably warmer climate than the surrounding countryside. He dedicated a later edition of The Climate of London to John Dalton.
Learn more:
John Lambert (1775-c.1811)
Lambert travelled to Lower Canada in 1806 with his uncle James Campbell to investigate the potential for growing and producing hemp in the colony, a vital wartime resource for shipping. He produced a memoir with observations and statistics on the colony, accompanied by illustrations based on his watercolor sketches.
Learn more:
John Frederic Daniell (1790-1845)

By Unknown author - , London, Public Domain, Link
Born in London and educated at King’s College London, Daniell was perhaps one of the best-known meteorologists of his day. He was appointed a fellow of the Royal Society at twenty-three and developed meteorological instruments, including his eponymous hygrometer, which was in use around the world for much of the nineteenth century. His hygrometer enabled better understanding of the role of humidity and water vapour in atmospheric processes. He published an influential collection of meteorological essays in 1823.
Learn more:
John Herschel (1792-1871)
.png#/media/File:John_Herschel_1846_(cropped).png)
By Unknown author - The Year-book of Facts in Science and Art By John Timbs, London: Simpkin, Marshall, and Co. [1], Public Domain, Link
Herschel was widely acclaimed as one of the most eminent British scientists of the nineteenth century. Son of Court Astronomer William Herschel (the discoverer of Uranus), John Herschel was an accomplished mathematician who worked to bring continental mathematical ideas to Britain. He and his father, along with his aunt Caroline Herschel, made significant discoveries in stellar astronomy as well as planetary astronomy, cataloguing nebulae and developing theories of stellar evolution. John Herschel completed his father’s work of cataloguing nebulae in the Northern Hemisphere and spent from 1833 to 1838 in South Africa cataloguing the stars as seen from the Southern Hemisphere.
While he was in South Africa, he wrote a guide to making meteorological observations. He also issued a call for hourly observations to be recorded around the globe on four specific days a year: the equinoxes and solstices. Both his guide to observations and his call for worldwide hourly observations were widely circulated among meteorologists. His observations of double stars and the calculations of their orbits provided an important confirmation of the universality of Newton’s laws of gravity. He emerged in the 1820s as “Britain’s first modern physical scientist,” and his writings on the scientific method influenced a generation of Victorian scientists, including Charles Darwin, Michael Faraday, and John Samuel McCord. Herschel played a founding role in the establishment of the Royal Astronomical Society, serving three times as its president and was twice awarded the society’s gold medal. He was also a member of the Royal Society and of the British Association for the Advancement of Sciences.
Learn more:
Charles Daubeny (1795-1867)

By Hills (studio), unknown - [1], Public Domain, Link
An Oxford professor with an interest in chemistry, geology, and botany, Daubeny was a founding member of the British Association for the Advancement of Science. Although his main interest was in chemistry, he also published on climate and reported on the progress of meteorology in North America after his visit in 1838.
Learn more:
Robert Henry Scott (1833-1916)
Scott studied experimental physics and engineering in Dublin, moving to Berlin after completing his studies. There he worked under Heinrich Wilhelm Dove, one of the most eminent meteorologists and climatologists of the nineteenth century. He translated Dove’s Laws of Storms, dedicating it to Robert FitzRoy. After FitzRoy’s death in 1865, Scott was appointed director of the Met Office by a committee appointed by the Royal Society. It is likely that his close friendship with Edward Sabine, then president of the Royal Society, helped secure Scott’s position. Scott was also secretary of the International Meteorological Committee from 1873 to 1900 and worked tirelessly to establish the international cooperation so vital in meteorology. It was through Scott that George Kingston received many of the meteorological instruments that furnished the observing posts throughout Canada.
Learn more:
The Importance of Being a Citizen Archivist: Getting Public Involvement
We talk alot about Citizen Scientists on this blog, but what about another key part of DRAW, Citizen Archivists? This week, let's reflect on the importance of archives in the DRAW Project with Archivist Lori Podolsky.
Citizen archivists, a term coined in 2010, describes how volunteers can contribute to the understanding of historical and archival records through online projects. Their work helps to make these records more descriptive and searchable as well as having the potential to aid in new research and innovation. More importantly, citizen archivists are instrumental to help increase the accessibility of archival records around the world by tagging photographs, transcribing documents, editing wiki articles and contributing to various online crowdsourcing activities.
Archives, such as Library and Archives Canada and McGill University Archives, work with citizen archivists to tag photographs, add descriptive content and transcribe documents. These types of collaboration impact the discoverability of archival records. With DRAW, the transcription of millions of weather observations has meant that historical weather recordings are now available to climatologists and researchers around the world. Without these citizen archivists, the records and information would only be accessible in paper form and could only be viewed by visiting the archives.
While transcribing documents, citizen archivists also discover hidden gems of marginalia and other pieces of information in the records. One of the DRAW transcribers found sketches in the margins of some of the observational ledgers. These sketches, described in an earlier blog, are one such treasure that date between 1902 and 1906. As there is little information about the sketches, they create an interesting mystery for future citizen archivists.
Archives digitize their records for many reasons. These include providing content for digital exhibits and websites, delivering online access for researchers, providing copies and for preservation purposes. Digitization has been benefits; yet it also has its limitations. One such limitation arises with handwritten documents. Cursive writing, especially writing from the 19th century, can be challenging to read! Computers are not able to decipher the handwriting and citizen archivists become vital in converting the handwritten data into machine-readable data. Without citizen archivists, DRAW and other transcribing projects will not have the same impact and success.
DRAW is a successful crowdsourcing initiative that has increased engagement between archives, archivists and the public. Tapping into the expertise and knowledge of citizen archivists, connections are built and sustained over time. Through crowdsourcing, the work of transcribing old weather data is distributed among many people, so each person’s contribution adds to the whole project. These contributions are seen in data coding, metadata enhancement, and of course, transcription. With DRAW, crowdsourcing offers many ways for community engagement and for citizen archivists to contribute to the overall knowledge in Montreal, Quebec and Canadian history as well as in climate trends dating back almost 200 years ago.
Citizen archivists have a significant impact in the discoverability of richness of the archives, unearth treasures and gems in the collections and highlight new ways in which the records can be used in future research. Citizen archivists are integral to transcribing DRAW data for better climatic accuracy, give feedback and comments on the usability of web applications and exhibit designs, support archival programs through public collaboration, and ultimately, transcribe weather data to improve the testing of hypothesis and models.
Become a citizen archivist if you are passionate about history, interested in contributing to a greater understanding of our climate and weather and enjoy being involved in community engagement. Your contributions will lead to success in data rescue and archives.
Solar and Lunar Haloes or Coronas
Hello everyone! This week we are going to look at weather symbols once more, and more specifically, an issue that we were informed about by a dedicated transcriber!
Some time back, an alert transcriber noticed that the symbols for solar corona and solar halo seemed to be inverted - what we had posted in the drop down menu didn’t match up to the symbols used by the observers. Most of the symbols we used in the drop down menus came from “Hints to Meteorological Observers'' by William Marriott. The copies we consulted are at the McGill library and were published in 1902 and 1906. The weather symbols are listed as follows:
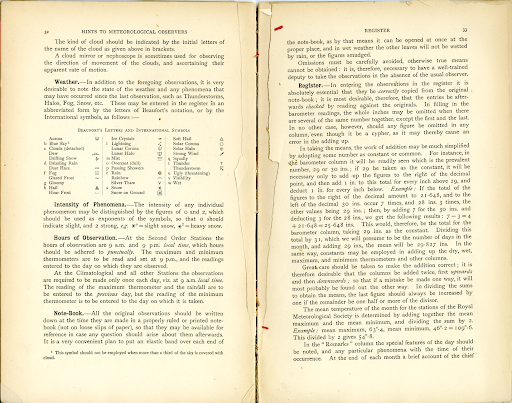
There were a few symbols that we couldn’t track down in more widely known printed international handbooks, which we eventually found in an earlier document produced some 20 years for Canadian observers by George Kingston, professor at the University of Toronto and Director of the Meteorological Service of Canada. These were symbols produced for Canadian observers, at a time when international norms were still coalescing:
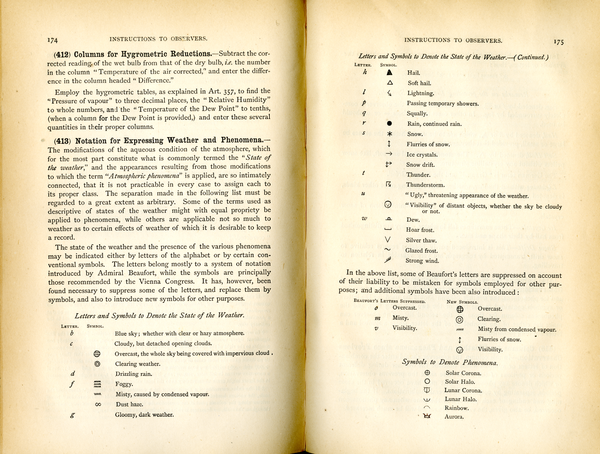
Notice that the symbols for both solar and lunar corona and halos are switched compared with what came to be accepted as the symbols 20 years later! We can see that this was a time when countries were still struggling to agree on international standards in weather observations. Even measurement units such as degrees Celsius or Fahrenheit would not be agreed upon for another century (and some countries still use imperial units colloquially, if not in their scientific communications).
We switched the symbols over to match with the Canadian Kingston standard, but the question remains, did they start using the international versions of the halo and corona symbols sometime after the 1890s? Let us know if you start noticing another mis-match between symbols on the page and the drop-down menu, especially after the 1890s!
What do solar or lunar haloes actually look like? They’re formed when very thin, cirrus clouds formed from ice-crystals drift in front of the sun or moon, and the light refracts around the sun or moon forming a halo if the clouds are such that it makes a complete circle. The ice crystals are shaped such that the angles are often at 22 degrees, and sometimes 46 degrees. Depending on the refraction (22 degrees), the white light can sometimes split into a rainbow. Corona (a word I’m sure we’re all very tired of hearing this past year in another context) are formed when the light diffracts, forming rings or waves around the sun or moon. They used to be used as a form of weather forecasting, as haloes formed in the presence of high level cirrus clouds, which can be the forerunner of synoptic weather systems.

By Mikhail Kapychka - Own work, CC BY-SA 4.0, Link

By Anton Yankovyi - Own work, CC BY-SA 4.0, Link
Film Review: Twister (1996)
In today’s edition of the DRAW Blog, we’ll be taking a trip back in time to just over twenty-five years ago, when the blockbuster movie Twister hit theatres in May of 1996. What can we Weather Enthusiasts learn from this action-packed megahit?
Quick Synopsis
Soon-to-be-divorced, storm-chasing couple Jo (Helen Hunt) and Bill Harding (Bill Paxton) reunite to chase a massive series of tornadoes, in the hopes of deploying their revolutionary tornado measuring instrument pack and contributing to an early tornado warning system. (Check out the film poster here)
“Dorothy,” “D.O.T. 3,” and “TOTO”
Central to the movie’s plot is the Hardings’ mission to deploy their tornado tracking device “Dorothy” to gather data on the nature of a tornado; doing so will allow them to better understand the functioning of these extreme weather phenomena, create models, and develop an early warning system which could save lives. Their rival, Jonas Miller, is simultaneously attempting to deploy his own digital orthographic telemeter, “D.O.T. 3.” “Dorothy” and “D.O.T. 3” measure important weather data such as wind speed, pressure, and dew point temperature within the eye of the storm.
“Dorothy” and “D.O.T. 3” were not, however, the unique creations of the movie’s writers: these two devices were modelled after their real-world predecessor device “TOTO”—the 250-350 lb TOtable Tornado Observatory, invented in 1979 by engineers Dr. Al Bedard and Carl Ramzy of the National Oceanic and Atmospheric Administration (NOAA) Environmental Technology Laboratory (ETL), and Dr. Howard Bluestein, meteorologist at the University of Oklahoma.1

By NOAA Photo Library, NOAA Central Library; OAR/ERL/National Severe Storms Laboratory (NSSL) - Image ID: nssl0030,NOAA's National Severe Storms Laboratory (NSSL) Collection., Public Domain, Link
TOTO was deployed April 29, 1984 in a tornado near Ardmore, Oklahoma. Ultimately, TOTO’s center of gravity was too high for extreme wind and it fell back down. It was also used as a portable weather station for measuring other kinds of storms, with greater success. The device was retired in 1987 due to safety issues and logistical impracticality, but it remains on display in the National Weather Center in Norman, Oklahoma.2
Mammatus Clouds
While deep into the storm chase, Bill and Jo mention the mammatus clouds forming above them, which begs the question: what is the significance of mammatus clouds?

A mammatus is “a cloud whose lower surface is in the form of pouches.”3 The National Oceanic and Atmospheric Administration (NOAA)’s National Weather Service describes them as “rounded, smooth, sack-like protrusions hanging from the underside of a cloud (usually a thunderstorm anvil). Mammatus clouds often accompany severe thunderstorms, but do not produce severe weather; they may accompany non-severe storms as well.” 4
Mammatus cloud formation is unique because, while most cloud formations are the result of upward growth, mammatus pouches are formed when the underside of a cloud—usually a cumulonimbus—descends. These cloud formations are often associated with thunderstorms, heavy rain, lightning, hail, or snow in cold temperatures.5
Fujita Scale
While eating at Jo’s Aunt Meg’s house, Bill explains to Melissa what the “Fujita scale” is.
Bill: [...] It measures the intensity of a tornado by how much it "eats".
Melissa: Eats?
Bill: Destroys.
The Fujita Tornado Damage Scale, or F-Scale, was developed in 1971 by T. Theodore Fujita of the University of Chicago. The F-Scale ranged from an F0 which exhibited “light damage” to an F5 which exhibited “incredible damage.” An F0 tornado may cause broken branches, for example, while an F5 tornado may level houses and send vehicles flying hundreds of meters through the air. The F-Scale also includes wind speed estimates, though these estimates were critiqued for not being accurate.6

Throughout the film, the storm-chasing team often references the F-Scale when discussing tornadoes, thereby revealing the film’s age, since the F-Scale was replaced by the Enhanced Fujita Scale rating system in the United States in 2007 and in Canada in 2013.7 The EF-Scale offers a wider range of damage indicators, further subdivision based on degree of damage (DOD), and more accurate wind speed estimates based on empirical studies. The EF rating is directly compatible with the F rating of the original Fujita Scale (e.g. EF3 = F3), but the associated wind speed ranges have changed significantly.8
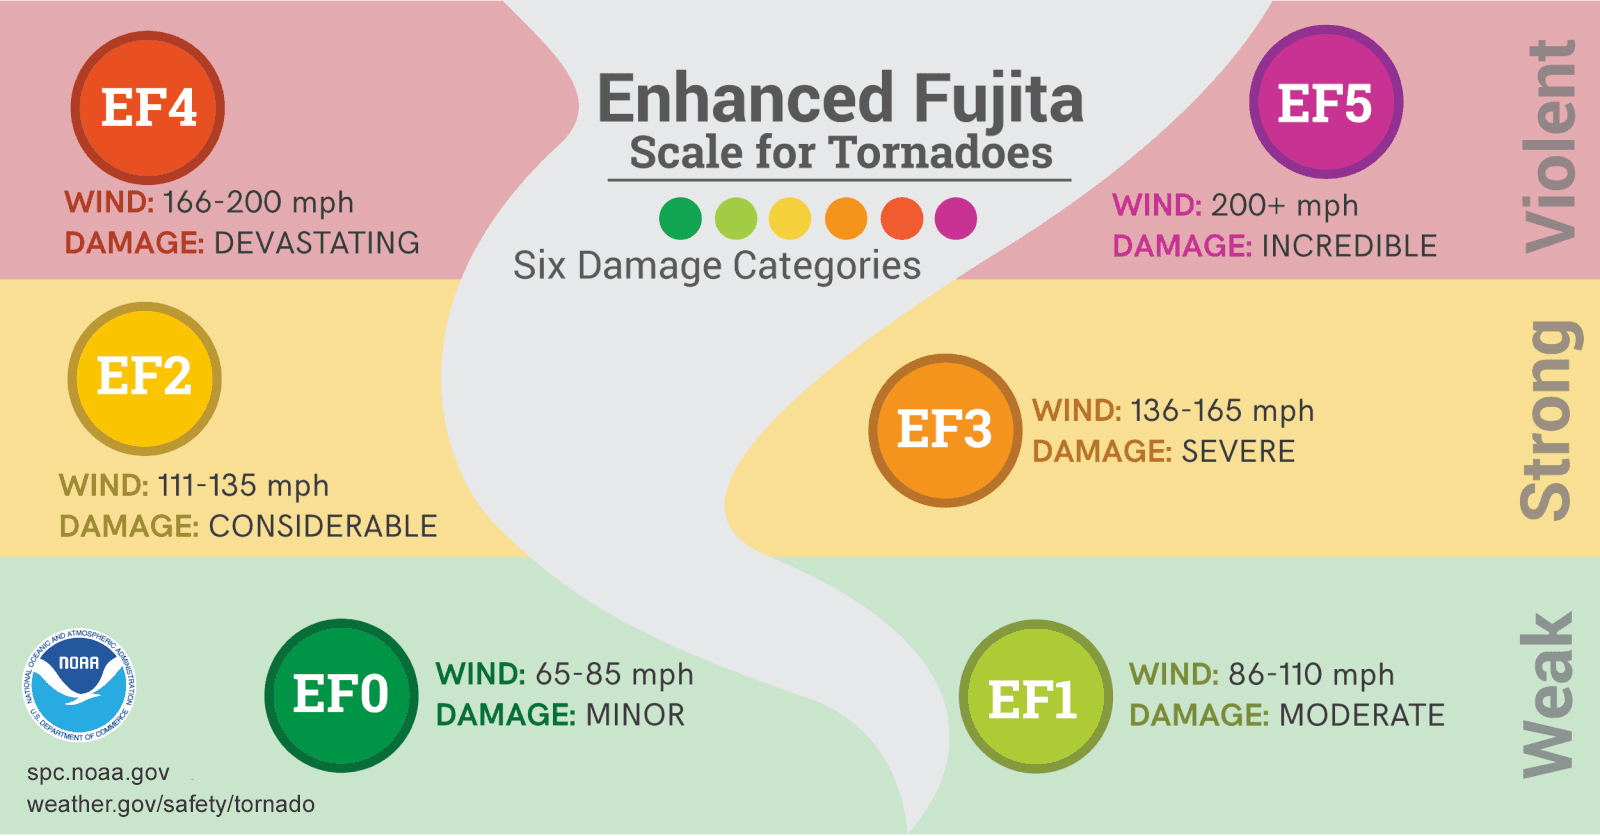
This infographic is found on the Texas Storm Chasers website (click image for more information).
*SPOILER ALERT*: Why we care about Twister
At the end of the film, Jo and Bill are arguing over who has to analyze the data from the successfully deployed “Dorothy IV” and who gets to run the laboratory they intend to establish with the grant money they expect to receive.
“We've got to generate models out of all this data,” proclaims Jo!
… and that is where Twister and DRAW intersect. We hope that as you are typing away—transcribing our handwritten ledger sheets into digitized data—that you remember just how important this work really is. With every keystroke, you are contributing data to inform climate models and helping climatologists to study our past climate and predict future trends. Indeed, as the Canadian Meteorological and Oceanographic Congress proceeded virtually last week and continues this week, a number of presenters across Canada looking into severe weather, including recent tornadoes, halistorms, and thunderstorms emphasized the need for historical observations to inform their work.
As always, we thank you for your wonderful contributions and welcome any movie recommendations for a future film review. Happy transcribing!
References
1“TOtable Tornado Observatory.” Wikipedia. Accessed June 6, 2021. Link
2“TOTO: TOtable Tornado Observatory (Online Tornado FAQ).” NOAA/National Weather Service Storm Prediction Center. Accessed June 6, 2021. Link3“Mammatus.” Merriam-Webster.com Dictionary, Merriam-Webster. Accessed June 6, 2021. Link
4“Mammatus clouds.” NOAA National Weather Service. Accessed June 6, 2021. Link
5“Mammatus clouds.” Met Office. Accessed June 6, 2021. Link
6“Fujita Tornado Damage Scale.” NOAA/National Weather Service Storm Prediction Center. Accessed June 6, 2021.Link
7“Tornadoes in the Oklahoma City, Oklahoma Area Since 1890.” NOAA National Weather Service. Accessed June 6, 2021. Link
8“Enhanced Fujita scale for wind damage.” Environment and Climate Change Canada. Last modified September 19, 2018. Link
Convocations, traditions, and our medical professionals
Convocation season is upon us! In the past, convocation at McGill could occur at any point between March and June, depending on the faculty in question. These days, convocation ceremonies at McGill usually occur over several days at the beginning of June on the lower downtown campus. Due to the pandemic, these ceremonies are currently being held virtually.
In celebration of both McGill’s bicentennial and our upcoming 2021 graduates, we are happy to introduce a series of posts developed by students from the McGill School of Information Studies (SIS) course, GLIS 641: Archival Description and Access, which will examine 5 convocation dates from the past.
For our final week, let’s travel to March 26, 1897!
One of the things that is always on the minds of students during their time at university is graduation. We study for the goal of improving our knowledge to go on to apply it in the real world and make a difference, and part of that rite of passage is convocation. The graduating class of 2020 already experienced an unusual, remote convocation and it seems that will be the case for the class of 2021. Nevertheless, the tradition remains an important one.
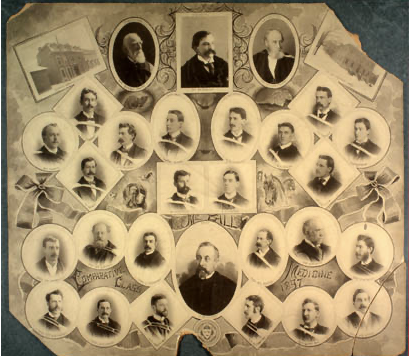
Class composite, Comparative Medicine class of 1897, McGill University Archives Photo Collection PL006112
The convocation represents a recognition of the accomplishments of graduates, normally taking place in the spring as we emerge from what can be a cold, dark, snowy, and sometimes particularly nasty Montreal winter. The promise of spring and sunnier, warmer days matches the sense of optimism coming with the challenges of embarking on a new career. That same spring optimism was no doubt in the air for the new medical graduates from McGill more than 120 years ago.
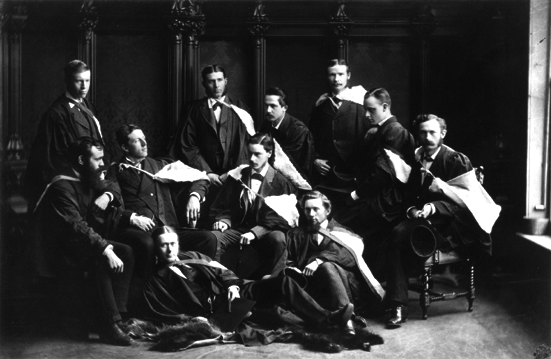
Comparative Medicine and Veterinary Science, class of 1897, Keystone, McGill University Archives Photo Collection PR008116
The weather in the week leading up to the McGill Medical Convocation in 1897 was as nice as one can expect for late March in Montreal, even compared to now more than a century later. The temperature from March 26-28th hovered around freezing with a high temperature of about 2 degrees and around 80% humidity. Very brief snowfall occurred during several of the nights, but with such warm temperatures, it would not have stayed for long. The new graduates likely would have been greeted with a mix of blue skies and partially overcast clouds, with reports of a few wisps of cirrus and some larger stratus clouds.
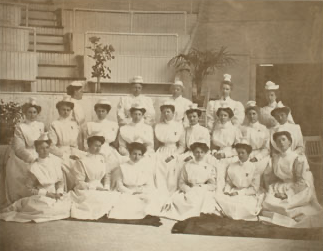
School of Nursing of the Montreal General Hospital, Class of 1897 In an Operating Theatre. William Notman. McGill University Archives Photo Collection PL006545
While those new medical professionals would have enjoyed the coming of spring alongside the pomp and circumstance, the portraits and group photos, and the valedictorian speeches which feature in the archival materials alongside this text, the reality of our 2021 convocation will no doubt feel quite the opposite. We find ourselves in the second wave of a global pandemic that has changed the way we study, work, and go about our daily lives; however, the efforts we take and the sacrifices we make do have a real impact on defeating this pandemic and ensuring the health and safety of the most vulnerable among us. The medical class of 1897 had a large portion of their careers behind them before confronting the trials that were the last major pandemic in 1918, but our new generations of doctors, nurses, and scientists will be entering a public health system in the midst of crisis and strain.
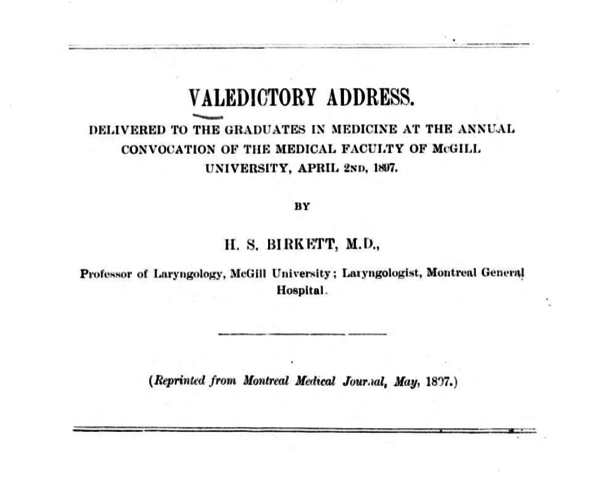
Valedictory address: delivered to the graduates in medicine at the annual convocation of the Medical Faculty of McGill University, April 2nd 1897. H.S. Birkett, Filmed from a copy of the original publication held by the Medical Library, McGill University, Montreal. FC 02 0203 no. 01939 Link
As we think back on the medical graduates of years past, we must continue to acknowledge and thank our current and soon-to-be new generation of healthcare workers for their work towards defeating the pandemic. Those thanks can be expressed in part by doing our duty and respecting public health guidelines, staying home, and perhaps sacrificing what would be our own picture-perfect convocations. Still, if we all work to do our part and support the efforts of our health care workers, we can emerge from this second wave to a warm, sunny, optimistic spring and a new crop of McGill graduates ready to make positive change in the world. Here is to the sunny blue skies in our future, and as it will likely be remembered as the catchphrase of our generation, ça va bien aller!
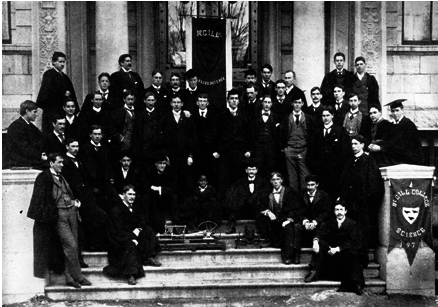
Applied Science Class of 1897. Old McGill. McGill University Archives Photo Collection PN000367
A Mysterious Disappearance
Convocation season is upon us! In the past, convocation at McGill could occur at any point between March and June, depending on the faculty in question. These days, convocation ceremonies at McGill usually occur over several days at the beginning of June on the lower downtown campus. Due to the pandemic, these ceremonies are currently being held virtually.
In celebration of both McGill’s bicentennial and our upcoming 2021 graduates, we are happy to introduce a series of posts developed by students from the McGill School of Information Studies (SIS) course, GLIS 641: Archival Description and Access, which will examine 5 convocation dates from the past.
Let’s travel to Spring 1887 and explore a case of disappearance that coincided with graduation that year.
The weekend of April 9th, 1887, was warm. The temperature was finally hovering just above freezing, and though it was cloudy, they were the kind of cozy, spring clouds that insulate the ground, not bringing rain. The snow was melting, and the truth behind a mysterious disappearance was about to be uncovered.
From the Montreal Gazette, Tuesday, March 29 1887. Page 5. Available through ProQuest’s Historical Newspapers database.
McGill medical student Albert Hamer disappeared on March 24th, 1887. At the age of 22, he was days away from graduating with a doctorate. The night of his disappearance, he and some friends – also McGill students days away from graduating – went for a drive to the Rivière des Prairies. This seemed like an innocent enough outing: it’s springtime, the river ice had begun to crack, and they were ready for a little adventure after a long winter in Montreal. Near the shore of the river, which is the island of Montreal’s northern boundary, was the Frigon’s Hotel, where later that afternoon Albert Hamer and his friends would stop for drinks. Albert was riding high. He was celebrating, and had recently cashed a check for $100.00 – money that his friends say he was flashing in the bar that fateful night. At some point in in their gaiety, Albert Hamer stepped outside for moment. He never returned to the bar.
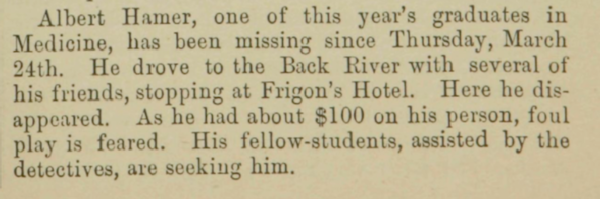
From the University Gazette, Vol. 10, N. 11. Published April 13th, 1887. Freely available from the Internet Archive at Archive.org.
Though it was spring and beginning to warm, sunset in Montreal still falls early at this time of year; depending on one’s position on the island darkness can fall as early as 7:00pm, and with the darkness comes cold. Albert’s friends thought that in his intoxication he had perhaps begun to walk back to campus – not an impossible walk, but a long one for a cold night. After a look around the hotel, they got into their automobile and drove back the way they came, thinking Albert would be along the road soon enough. Arriving at their destination with no Albert in sight, they drove back to the hotel. Mr. Frigon, the hotel proprietor, let them know Albert had not re-entered his establishment that night. They made this round trip journey two more times that night, finally bringing with them a police car and Detective Lapointe. After questioning the houses in the surrounding farmland, the detective and Albert’s friends set up a search party and combed the countryside. They did not find Albert.
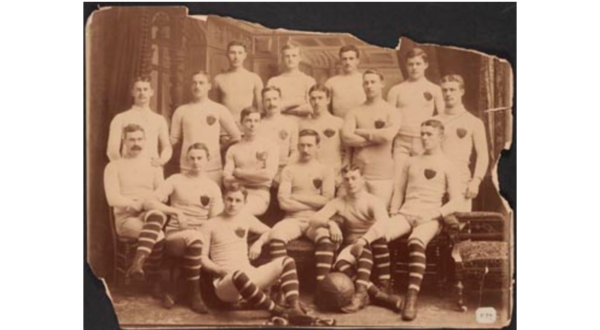
McGill Senior Football Team, 1887. No known photos of Albert Hamer exist, but he might of looked like one of these guys. From McGill’s online Photo Archive, photo #0000-0090.04.27, taken by A.G. Walford.
For weeks the disappearance caused a dreadful stir in the McGill community, and in Montreal society at large. Was Albert a victim of foul play? Could he still be alive? Perhaps he had taken a train back to his home in southern Ontario?
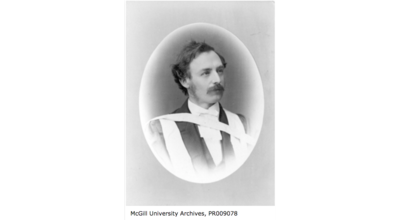
As no photos exist of Albert Hamer, here is another of his classmates from the class of 1887, Alexander Johnson. From McGill’s Photo Archives, photo #PR009078, photographer William Notman.
Albert’s body was found outside, near Frigon’s Hotel, the weekend of April 9th, 1887. He had been covered in a thick layer of snow – whether this was on the night of his disappearance or a later date is unsure – and only the sun’s warming rays finally revealed Albert’s final resting place. He still had $90.00 in his wallet. Was Albert simply an unfortunate soul, who stumbled into the grave, or was there a motive deeper than his wallet? We will never know the absolute truth of what happened that fateful night.
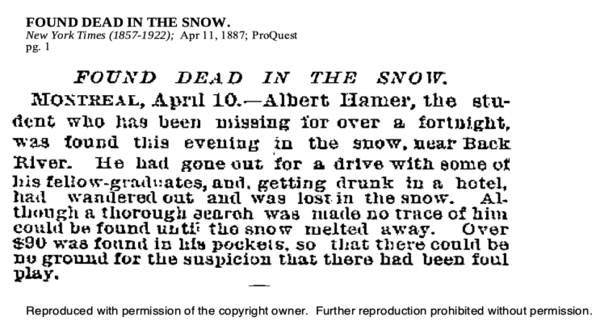
Convocation: April 30 1891
Convocation season is upon us! In the past, convocation at McGill could occur at any point between March and June, depending on the faculty in question. These days, convocation ceremonies at McGill usually occur over several days at the beginning of June on the lower downtown campus. Due to the pandemic, these ceremonies are currently being held virtually.
In celebration of both McGill’s bicentennial and our upcoming 2021 graduates, we are happy to introduce a series of posts developed by students from the McGill School of Information Studies (SIS) course, GLIS 641: Archival Description and Access, which will examine 5 convocation dates from the past.
Today’s post transports us back to April 1891.
The day was full of promise. The morning arrived with temperatures milder than they had been, where thermometers had dropped overnight to lows of 32 degrees fahrenheit. Likewise, the strong south-westerly winds of the past few days had weakened to a gentle breeze, stirring the leaves of the trees on Mont Royal. A light haze hung in the otherwise crisp, blue afternoon sky. That was the day that greeted the Faculty of Arts class of 1891 when they walked through the doors of Windsor Hall on their convocation.
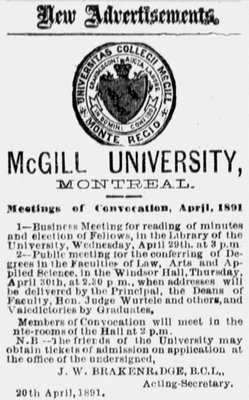
“Meetings of Convocation, April, 1891” J.W. Brackenridge. The Gazette. 30 April 1891. Link
This would have been a welcome respite from those chilly, windy days that persisted into late April, heralding the true arrival of spring in Montreal. Up until then, on cold mornings the inhabitants of the city would have been using coal to heat their homes. Coal was an important resource of the late 19th century, as evidenced by its ubiquity in daily life, such as its presence in newspapers of the time through advertising, event promotions, and the like. For example, in an issue of The Gazette from April 30, 1891, advertised “Coal! Coal! Newcastle Smith coal, best quality and double screened.” This ad is accompanied by a similar advertisement for the Caledonia Coal and Railway Company. The presence of coal is ubiquitous throughout the newspaper’s stories — in mentions of railways and factories.
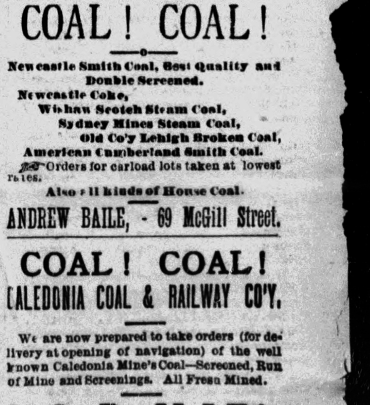
“Coal! Coal!” The Gazette. 30 April 1891. Link
The effects of extractive industries on the physical landscape of Montreal are easy to find in the archives. In the late 19th century, coal mining and the places needed to store and dispense it from shaped the city and its inhabitants. Coal yards such as the one pictured below dotted street corners as smoke curled up into the sky from stoves and out of chimney stacks.

“J.B. Mailloux, Wood & Coal, Barré St., Montreal, QC, 1903.” Wm. Notman & Son. 1903. (Musée McCord)
On April 29, Montreal played host to the first quarterly meeting of the General Mining association of Quebec, which included mine owners, managers, and other stakeholders. The Gazette ran a column on the day of the meeting, describing the events that would occur, listing notable attendees, and inviting McGill students and graduates to attend. One notable presentation took place on McGill’s campus and featured representatives from the Edison Electric Light company demonstrating electricity’s uses in mining operations.
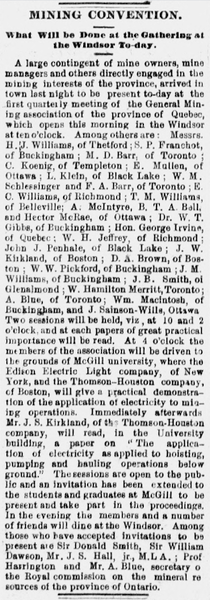
“Mining Convention: What Will be Done at the Gathering at the Windsor To-day.” The Gazette. 29 April 1891. Link
In fact, at McGill’s Faculty of Arts convocation, where Alexander Johnson described the Faculty of Arts as the “heart of the university,” he also mentioned the applied sciences and harnessing energy through electricity, citing the work of scientist Daniel Faraday. He highlighted the fact that the school of Applied Science grew out of the faculty of arts, and the importance of teaching science for its applications in ordinary life and in the narrative of human progress.
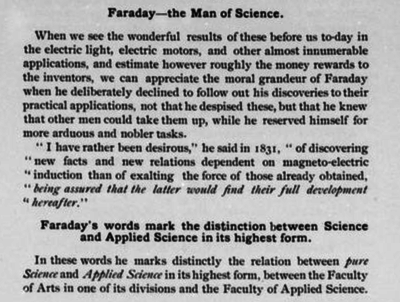
“The Faculty of Arts — The Heart of a University: An Address to the Convocation of McGill University.” Alexander Johnson. 30 April 1891.Link
Although examining weather records from one specific day over 100 years ago may not seem like it can provide much useful information about our current climate crisis, in fact, looking at our climate past in context can give us valuable insights into our climate future. The long-lasting effects of extractive industries and fossil fuel use can be seen in the terrain of the city and felt in the increasingly severe weather events occurring as a result of climate change. Weather records like those from McGill’s convocation on April 30th, 1891 can be used to make comparisons to later years, track patterns, and make predictions about future weather events, and the future of the climate. As the necessity of divestment from fossil fuels becomes more and more apparent, we must ask ourselves what our responsibilities are towards the planet’s future and welfare, and what institutions have and should do to address their legacy of advancing extractive industries over the past century. In what ways can these institutions prove themselves to be leaders, and what will our legacies be, going forward? In asking these questions, we ask what day will greet the graduating class 100 years hence. We hope the actions we take today can help shape a day as bright and beautiful as that of April 29th, 1891.
References
Atiso, K., & Freeland, C. (2016). Identifying the social and technical barriers affecting engagement in online community archives: A preliminary study of "Documenting Ferguson" archive. Library Philosophy and Practice, 1-21. Retrieved from Link
Blaser, L. (2014). Old Weather: Approaching Collections from a Different Angle. In Mia Ridge (eds), Crowdsourcing our cultural heritage. (pp. 45-56) Ashgate.
Documenting Ferguson. (2020, October 8) Our Purpose. Documenting Ferguson. Link
Library and Archives Canada. (2020, October 8) Introduction. Project Naming. Link
Old Weather. (2020, October 8) The Project. Old Weather. Link
On This Day: McGill University Spring Convocation, April 30th 1894
Convocation season is upon us! In the past, convocation at McGill could occur at any point between March and June, depending on the faculty in question. These days, convocation ceremonies at McGill usually occur over several days at the beginning of June on the lower downtown campus. Due to the pandemic, these ceremonies are currently being held virtually.
In celebration of both McGill’s bicentennial and our upcoming 2021 graduates, we are happy to introduce a series of posts developed by students from the McGill School of Information Studies (SIS) course, GLIS 641: Archival Description and Access, which will examine 5 convocation dates from the past.
For the second week, let’s take a look at April 30th 1894, 127 years ago.
The Windsor Hotel (image 1), a grand hotel formerly located in Downtown Montreal, was packed full the afternoon of April 30, 1894 as three faculties closed their years. The register entries from that day in DRAW tell us that the temperature that Monday was unusually warm for Spring in Montreal, with a minimum of 47.8 °F (8.7 °C) in the morning and reaching a maximum of 69 °F (20.5 °C) in the afternoon—the highest that month! Luckily the students would miss the evening rainfall which started around 7:45 p.m.! A fresh breeze was blowing throughout the day from the South-West direction. Some Stratus clouds were visible during the day but they did not obstruct the sun. The cloud cover only got thicker in the evening before the rainfall, around 7p.m.

Image 1: Windsor Hotel, Montreal, QC, about 1885, McCord Museum, VIEW-1583
As current McGill students and aspiring archivists, we are recreating the convocation of 1894 as much as possible through these photographs of people and places and the weather data from DRAW to offer readers an insight into how convocation was historically celebrated. So, to set the scene…
Inside the beautiful Windsor Hotel, the Faculties of Law, Applied Science (Engineering and Medicine) and Arts were surrounded by friends and family to celebrate their graduation. No images from the Faculty of Law could be found, but an image from the McGill University Photo Archives of the Faculty of Arts (image 2) shows a modestly-sized group of women—14 in total, pictured here wearing their graduation gowns and holding their caps. Two other photos (images 3 & 4) show the medical students and various faculty members from the class of 1894.
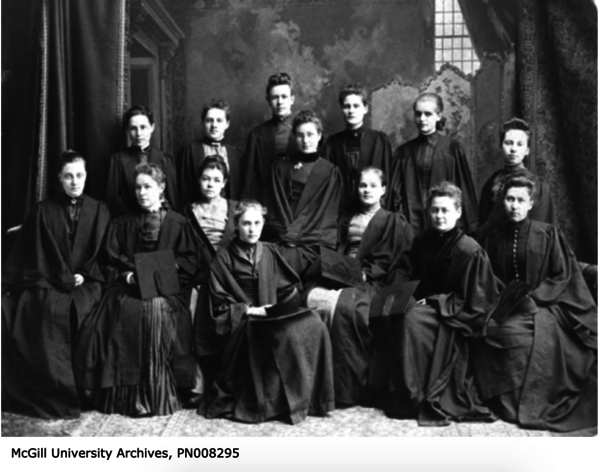
Image 2: Class of 1894, Faculty of Arts, McGill University Archives, PN008295
Image 3: Medical Class of 1894, McGill University Archives, PR000188
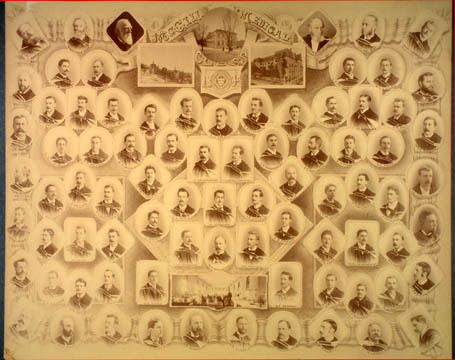
Image 4: Faculty of Medicine 1894
An article found in the Montreal Gazette (image 5) from May 1, 1894 describes the size of the crowd the day of convocation as unexpectedly large. The ceremony, which began at three o’clock, was, they noted, packed full of attendees, many of whom were forced to stand in crowded aisles! Perhaps the beautiful spring day put the students in a joyful mood, as it was also reported that while the audience was assembling, the sound of students singing traditional college songs filled the room.
Image 5: "Convocation of McGill", Montreal Gazette, May 1 1894
According to the article, there were many important attendees that day: Sir William Dawson (image 6), who addressed all three faculties, sharing perhaps an uncommon view today that all students should take courses in the arts for their personal and professional careers: “in our view, every graduate should first take his degree in arts and afterward enter a professional faculty.” Vice-Principal Dr. Johnson was also in attendance and spoke of both the highs and lows of the year. He described with sadness the retirement of the previous speaker, Sir William Dawson, former Vice-Principal, on account of “ill-health.” He also celebrated the year’s biggest achievements, mainly the opening of the new Redpath Library (image 7). The opening ceremony (image 8), Dr. Johnson noted, was attended by its founder, the late Mr. Peter Redpath before he died. They also praised the recent change in the tariffs attached to books and knowledge, a new policy by the Government, which the VP hoped would give “a better chance of filling the empty shelves.”

Image 6: Sir William Dawson, Montreal, QC, 1895, McCord Museum, II-109802

Image 7: Peter Redpath Library, McGill University, Montreal, QC, 1893 (?), McCord Museum, VIEW-2675

Image 8: Opening ceremony, Redpath Library, McGill University, Montreal, QC, 1893, McCord Museum, MP-0000.25.250
Finally, the ceremony ended with the Governor-General’s speech, followed by Sir Donald Smith’s closing words to the crowd, wishing each outgoing student that “their path in life might be prosperous in every way.”
According to the article, Sir Donald Smith entertained the Governor-General, and Sir William Dawson that evening at his residence, in addition to upwards of 90 other guests, who experienced the music, the floral devotions, the menu printed on “Chinese paper.” The dinner was followed by a reception of nearly 600 guests, though it is not clear if any of the students were lucky enough to receive an invitation!
A Day in the Life of a Donalda
Convocation season is upon us! In the past, convocation at McGill could occur at any point between March and June, depending on the faculty in question. These days, convocation ceremonies at McGill usually occur over several days at the beginning of June on the lower downtown campus. Due to the pandemic, these ceremonies are currently being held virtually.
In celebration of both McGill’s bicentennial and our upcoming 2021 graduates, we are happy to introduce a series of posts developed by students from the McGill School of Information Studies (SIS) course, GLIS 641: Archival Description and Access, which will examine 5 convocation dates from the past.
This week, let’s kick things off with a look at April 30th 1902, through the eyes of a Donalda.
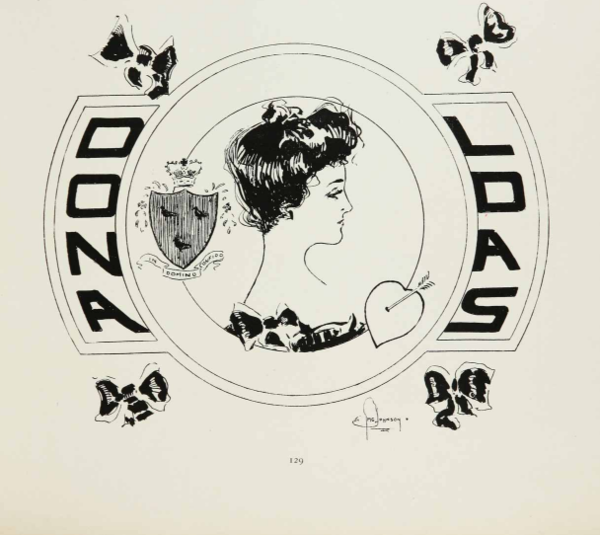
Unknown. ([1901 or 1902]). Donaldas emblem [Drawing]. In Old McGill, Vol. 6 (p. 129). Montreal: McGill University, 1903. Source.
April 30th, 1902: it’s an overcast morning but you’re glad it’s not raining. You pop your head outside, you can feel a bit of a breeze and hear the spring leaves rustling in the wind. You close your eyes and soak it in because today is your day, today is the day you graduate from McGill!
Though your graduating class is small, you’re excited to see the other graduating women of the 1902 class. It took some time for women to start roaming the halls of McGill’s Education and Arts programs (women were not permitted to attend university level classes at McGill until 1884) and you’re proud to have met some seriously smart women through your time at this institution. Why, Harriet Brooks graduated a few years ago and you’ve heard she’s well on her way to becoming Canada’s first female nuclear physicist.
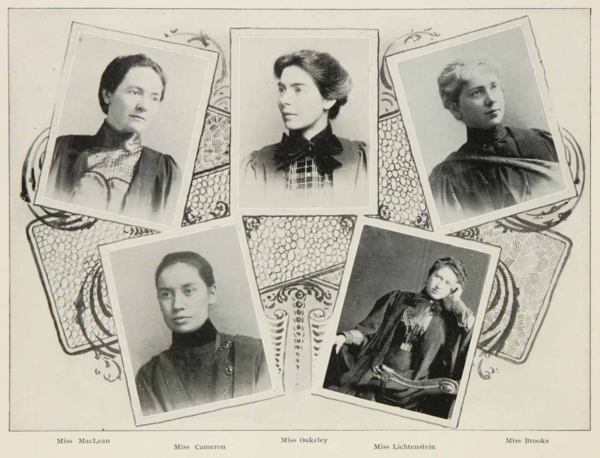
Miss MacLean, Miss Cameron, Miss Oakeley, Miss Lichtenstein, Miss Brooks [Photograph]. In Old McGill, Vol. 4 (p. 140). Montreal: McGill University, 1901. Source.
It’s a beautiful day to graduate. It’s not too hot and not too cold, a perfect 15 degrees, making the graduate hood you’re going to be dawning not only fashionable but functional. You’re glad they decided to add some new colours to the roster, and while you’d have no problem representing McGill’s colourway with the red and white hood, you can’t help but feel like royalty as your gold hood drapes elegantly across your shoulders.
You’re getting ready to head out the door to meet the Donaldas because you’ve decided you’re all going to walk to the ceremony together. You and your friends are looking forward to the dance after the ceremony, but you’ll have to get through a good few hours of poetry and speeches first. Not that you’re turning your nose up at it, it’s just that nothing could beat the early morning Delta Sigma Society debate practices you had this semester, and certainly nothing could compare to the late night laughs you had with them either. You learned to hold your own with your words and how to stand up and show your classmates that women deserve the floor as much, or maybe even more, than the boys.
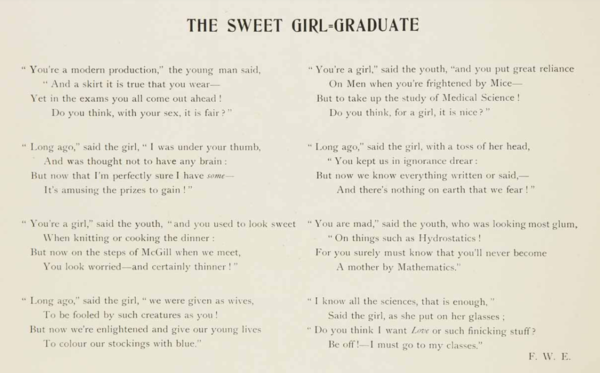
The Sweet Girl-Graduate [Screenshot]. In Old McGill, Vol. 5 (p. 174). Montreal: McGill University, 1902. Source.
Walking out the door, you see it’s still cloudy as the afternoon rolls in but you’re happy not to be trudging through a few feet of snow. As you walk down Sherbrooke Street, you can see the weathervanes spinning on the roofs and the mountain getting bigger and bigger as you approach. Will you miss slipping up and down that hill to get to class? You’ll certainly miss the changing leaves in the fall, the way the greens subtly turn to yellow and then explode into a canvas of orange and red. You’ll miss bluebird days in the dead of winter that energize you, even if you can’t feel your toes. You’ll miss having to remind yourself, as you do every April, that winter won’t last forever, and how it never does. You wonder if future McGill students will feel the same way, will they have to battle the elements to get to class? In 120 years, will students still be sliding up and down that hill?
Thoughts of the future are replaced by the faces of your fellow graduating class as you meet on the corner of Sherbrooke and McTavish. You look up at the sky and think to yourself that it will likely rain later, but nothing could get your spirits down today. You link arms with the Donaldas and begin walking up the McGill hill one last time.
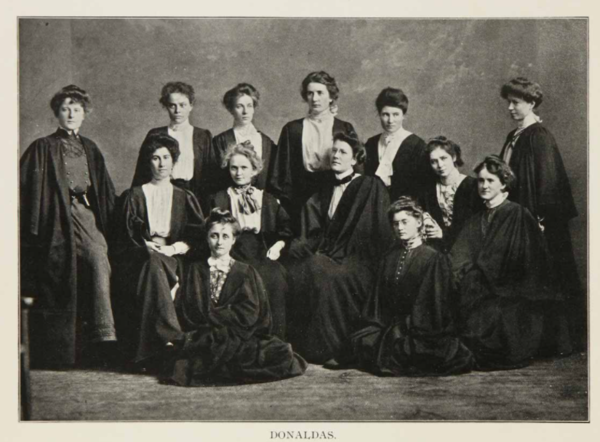
Unknown. ([1901 or 1902]). Donaldas [Photograph]. In Old McGill, Vol. 6 (p. 40). Montreal: McGill University, 1903. Source.
Help save weather data here: DRAW McGill
Learn more about women at McGill here: Blazing trails: McGill's women
Explore McGill’s old yearbooks here: McGill Yearbooks
References
ReferencesBlazing trails: McGill's women. (n.d.). McGill University. https://www.mcgill.ca/about/history/features/mcgill-women.
Data Rescue: Archives and Weather (DRAW). (2020). https://citsci.geog.mcgill.ca/en/.
National Oceanic and Atmospheric Administration (NOAA), Storm Prediction Center. (n.d.). Beaufort Wind Scale. https://www.spc.noaa.gov/faq/tornado/beaufort.html.
Unknown. (1902). Old McGill (Vol. 5). Montreal: McGill University. https://yearbooks.mcgill.ca/viewbook.php?campus=downtown&book_id=1902.
Transcription Tips: City Hall Barometer on Sundays (page 2)
*Psst! If you'd like to learn how to transcribe these pages, skip down to How to Transcribe.
The Explanation
We’re back with another edition of Transcription Tips! This blog post will tackle a tricky observation pattern that has stumped even the DRAW Team since late last year: for the time period of 1890 to 1899 (and a few outliers prior to 1890), the page 2 observations for Sundays include the barometer readings from City Hall, rather than the anemometer readings from the McGill Observatory for that day. Recording City Hall barometric values rather than anemometric values is common to all of the days on all of the “page 2s” for register type 1501, so why are these pages so tricky?
What makes Sundays different from the other days in this time period is that the observation times in the “Local time” column do not line up with the barometric values under the anemometer columns on Sundays. This is because the McGill Observatory typically observed only three or four times per day on Sundays.
During this time period, the standard observation times for Sundays were:
8am (8:00),
3pm (15:00),
8pm (20:00),
and 11pm (23:00).
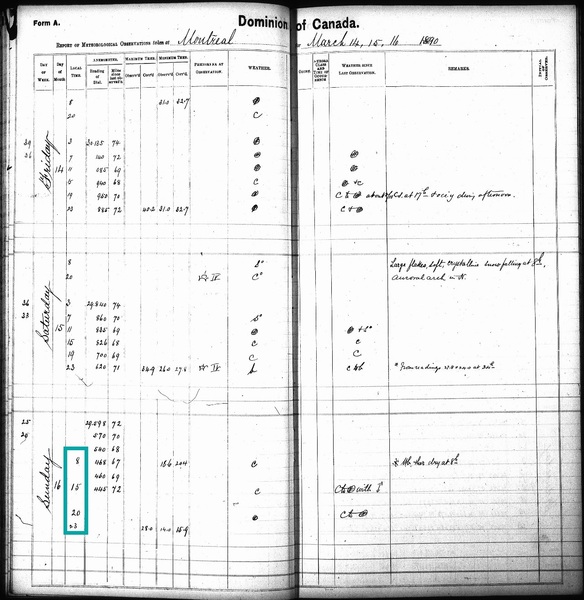
On this page from March 14-16, 1890, the times inside the teal box are the standard Sunday observation times: 8am, 3pm, 8pm, and 11pm.
The City Hall barometer readings, however, were recorded at the same observation times no matter what day of the week it was, at:
3am (3:00),
7am (7:00),
11am (11:00),
3pm (15:00),
7pm (19:00),
and 11pm (23:00).
As a result, the data found on page 2 for Sundays from 1890 to 1899 corresponds to two different sets of times… we hope we haven’t lost you yet!
The data in the “Anemometer - Reading of Dial” column is actually the City Hall barometer reading; the data in the “Anemometer - Miles since last obs.” column is actually the City Hall attached thermometer reading; the data in the “Maximum Ther. - Observ’d” column (though often omitted) is actually the City Hall corrected barometer reading. The data in these three columns was recorded at the standard observation times of 3am, 7am, 11am, 3pm, 7pm, and 11pm. Sometimes these times are written immediately to the left of the data or on the margin between the “Local Time” column and the “Reading of Dial” column; sometimes they are not written but are assumed.
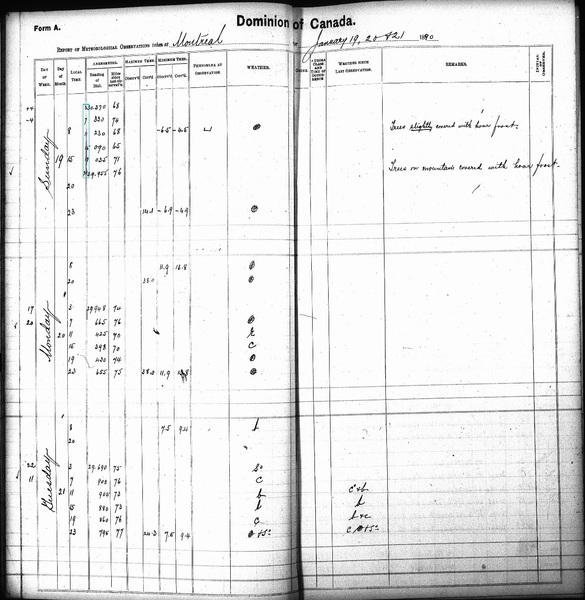
On this page from January 19-21, 1890, the times of the City Hall barometric observations are written just to the left of the observation rows, on the margin between the Local Time and Reading of Dial columns. They are: 3am, 7am, 11am, 3pm, 7pm, 11pm.
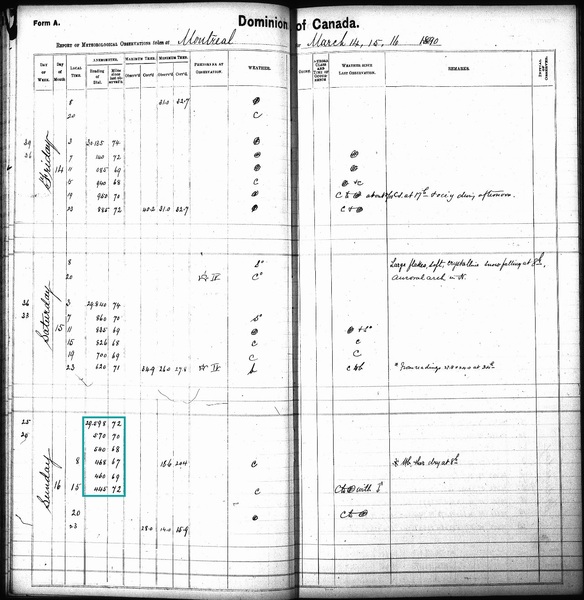
On the page from March 14-16, 1890, the observations within the teal box are the barometric values observed at City Hall but the times are not written beside the observations.
All other data on the page corresponds to the Sunday observation times of 8am, 3pm, 8pm, and 11pm.
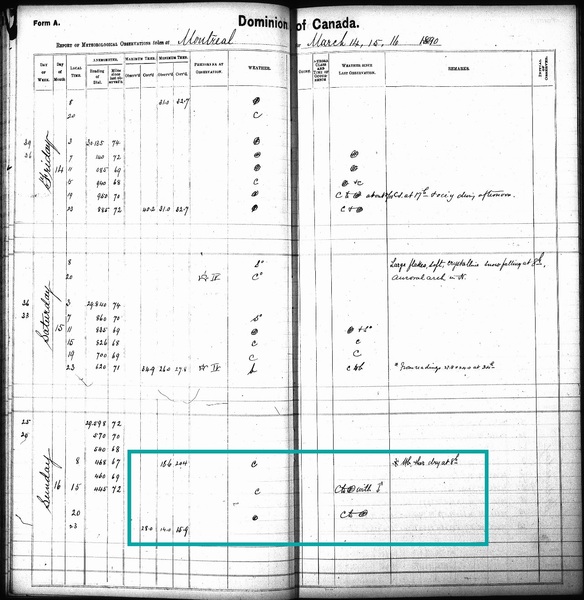
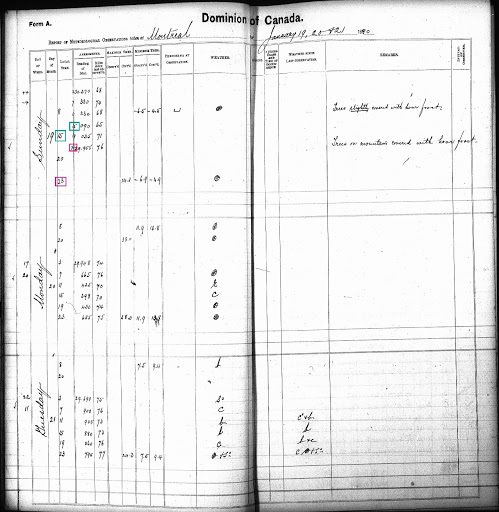
In the example from January 19-21, 1890, the teal boxes indicate the two occurrences of rows for 3pm on a single day, and the pink boxes refer to the two occurrences of rows for 11pm on a single day. When counting your rows to confirm the page metadata, make sure to count each unique observation time only once, even if it appears twice like in this image.
You can see why we were confused, why it took us a long time, and why we had to examine a lot of pages, to figure out all these variations.
Now that we think we understand why and how these discrepancies occur, let’s discuss how to transcribe these pages!
How to Transcribe
- Verify the number of rows
- For Sunday, the number of rows should equal the number of unique observation times; this means that if, for example, 3pm (15:00) appears twice, you should only count it once.
- Count the rows for the other days on the page as you normally would.
- Transcribe the two days which are not Sundays normally, using the times in the “Local Time” column.
- You should be provided with the Anemometer/City Hall Barometer field group in the transcriber panel, which includes the following three fields:
- City Hall Barometer (printed heading Reading of Dial)
- City Hall Att'd Therm (printed title Miles Since Last Observ)
- City Hall Corr. Bar
- For Sunday, transcribe the rows of barometric values under the two Anemometer column headings (City Hall Barometer under printed heading “Reading of Dial,” City Hall Att'd Therm under printed heading “Miles Since Last Observ,” and City Hall Corrected Barometer under printed heading “Maximum Ther. - Observ’d”) following the observation times used on the other days of the week (3am, 7am, 11am, 3pm 7pm, 11pm).
- Sometimes the above-mentioned times for the barometric readings are written to the left of the row of data or on the margin between the “Local Time” column and the “Reading of Dial” column.
- If the times are written and contradict the above-mentioned times, use the times supplied on the page.
- If the times are not written, use the times provided above (3am, 7am, 11am, 3pm, 7pm, 11pm).
- For all other data on Sunday outside the Anemometer columns, use the times in that day’s “Local Time” column to transcribe the data in the corresponding field. On Sundays, the observation times (“Local Time”) tend to be 8am, 3pm, 8pm, and 11pm, but use whichever times are written for that particular day. If the observations do not align exactly, transcribe them at the time they most closely align to.
- Continue until the page is fully transcribed.
Conclusion
If you’ve made it this far: thank you for sticking with us! We would especially appreciate your feedback after trying this transcription process. If anything about our suggestions does not correspond to the page that you are transcribing or if the steps are unclear, please feel free to reach out to us and we would be happy to work on it together. You can email us at draw.archives@mcgill.ca, tweet us @DRAWMcGill, or send us a message on Facebook @DRAWMcGill. As always, if you come across any more interesting observation patterns, please let us know so that we can share more Transcription Tips with our Blog readers!
1Register type 150 refers to a particular page layout template that was used in the time period we are referring to. There are other register types that refer to different layouts. The differences include which variables were observed (weather phenomena, wind, etc.) and the order in which they appear on the printed page that the observers filled out. Each of these register types has a “page 1” and a “page 2,” since observations were taken over two pages in the original logbooks. “Page 1” and “page 2” for each register type also have different variables observed, so that is why we differentiate them.
Meet the Meteorologists: France
Welcome back to Meet the Meteorologists where we look at the individuals around the world who helped to contribute to the creation of meteorology as a field of study and who helped inform the practice here in Montreal.
These individuals were often interested in weather as how it connected to their day jobs. They were often intellectuals, religious figures, engineers, doctors or businessmen in communities and helped contribute to our understanding of weather in the St. Lawrence basin where Montreal resides. All individuals mentioned in this series were taken from Climate in the Age of Empire by Dr. Victoria Slonosky.
This week let’s take a look at those influential individuals from France!
Blaise Pascal (1623-1662)

By unknown; a copy of the painting of François II Quesnel, which was made for Gérard Edelinck en 1691
[réf. nécessaire] - Own work, CC BY 3.0, Link
The son of a local administrator from Clermont, Pascal was a mathematical prodigy, teaching himself from the works of Euclid and developing theories of conic sections as a teenager. He invented a calculating machine able to perform arithmetic mechanically. With his brother-in-law Florin Perier, Pascal tested Torricelli’s theories on the weight of the atmosphere by measuring the height of the mercury column in a barometer with increasing altitude as Perier ascended the Puy de Dome in 1646. This was described as the first verification of a theory in a controlled scientific experiment by the collection of instrumental measurements. He proved the existence of a vacuum above the mercury contained in a barometer; until then it was thought to be impossible for a vacuum to exist. This paved the way for the development of the air pump. Pascal, in letters and discussions with contemporary mathematician Pierre Fermat, cofounded the field of probability. He is described by Napier Shaw as “one of the best writers and profoundest thinkers France has ever produced.” (Napier Shaw and Austin 1932, p.119).
Learn more:
Jean-Dominique (Giovanni Domenico) Cassini (1625-1712)

Public Domain, Link
Cassini was appointed professor of astronomy in Bologna at the age of twenty-five, where he calculated the rotational periods of Jupiter and Mars. He also calculated the movements of the moons of Jupiter, which allowed another scientist, Ole Romer, to estimate the speed of light. Cassini was recruited by Louis XIV’s minister Colbert in 1669 to establish an astronomical observatory in Paris and became a French citizen in 1673. Among his discoveries were the moons of Saturn and the gap in the rings of Saturn. His work on the parallax of Mars allowed him to estimate the size of the solar system, and he also undertook fundamental observations on the size and shape of Earth. His calculations disagreed with the theoretical estimates of Newton, and the quest to measure the size and determine the shape of Earth would become a recurring theme in French science over the next century. The 1997 spacecraft sent to observe Saturn and Jupiter was named the Cassini space probe in recognition of Jean-Dominique Cassini’s pioneering observations of these planets and of the solar system in general.
Learn more:
Philippe de La Hire (1640-1718)
.jpg#/media/File:Philippe_de_La_Hire_(1640-1719).jpg)
By Unknown author - Unknown. This is a contemporary engraving., Public Domain, Link
La Hire was the son of Lauren de La Hire, a professor of the Royal Academy of Painting and Sculpture and a portrait painter of some renown. Philippe de La Hire’s early training was as an artist, and he travelled to Italy in his youth. There he became interested in geometry and perspective, and soon became more interested in mathematics than painting. He returned to Paris in 1664 and worked on conic sections. He was elected to the Académie Royale des Sciences in 1678 and was assigned to work with Jean Picard on surveying. Their aim was to produce more accurate maps, a task that would occupy the scientists at the Paris Observatory for the next century. His work in cartography linked La Hire to the observatory and to Cassini and Maraldi. La Hire also worked on the project to supply water to the gardens of Versailles, then under construction, and so began the first systematic recording of precipitation in Paris. La Hire worked in many areas of the sciences, including magnetism, falling bodies, astronomy, and optics. He developed instruments, including meteorological instruments such as thermometers and barometers at the observatory. Every year he published a summary of the monthly rainfall totals and other measurements such as the extremes of pressure and temperature. His son, Gabriel Philippe de La Hire (1677-1719), worked with his father at the observatory and also published meteorological reports.
Learn more:
Giacomo Filippo Maraldi (1665-1729)
The nephew of Jean-Dominique Cassini, Maraldi was an important astronomer, mathematician, and geoscientist working at the Paris Observatory. He worked on a catalogue of fixed stars, studied Mars extensively, and thus discovered that the Martian ice caps were not aligned with the rotational poles. He also realized that the corona visible during an eclipse belonged to the sun and not the moon. He was one of the geoscientists who measured the arc of the meridian between Dunkirk and Perpignan, which helped determine the size and shape of Earth. He kept meteorological observations and wrote extensively on the distribution of atmospheric pressure around the world.
Learn more:
Jacques Cassini (1677-1756)

By Unknown author - douteuse : [1], Public Domain, Link
The son of Jean-Dominique, Jacques Cassini carried on his father’s work. He is most remembered for his work in cartography and surveying, including the determination of the length of the arc of a meridian between Dunkirk and Perpignan with his cousin Giacomo Filippo Maraldi. Appointed as a student astronomer to the Académie Royale des Sciences in 1692, he was also elected to the Royal Society in 1696, corresponding with Isaac Newton and Edmond Halley.
Learn more:
Antoine Jussieu (1686-1758)
Jussieu studied at Montpellier, renowned for its reputation in medicine, and became a physician. He travelled through Spain, Portugal, and southern France collecting plants, which he brought with him to Paris. He practised medicine in Paris and became a member of the Académie Royale des Sciences in 1715. He took over Tournefort’s position as professor in the Jardin des Plantes in Paris upon the latter’s unexpected death. His most notable work was on the uses of plants, particularly in medicine.
Learn more:
René Antoine Ferchault de Réaumur (1683-1757)

By Metzeroth - , Public Domain, Link
A scientific polymath, Reaumur made significant contributions in a number of fields, including metallurgy and meteorology, although he is best remembered today for founding the field of entomology. His work on thermometers developed not only a thermometer with consistent units and a calibration method that made measurements from different instruments intercomparable but was also known for specifying the physical conditions for the placement of the thermometer to measure air temperature and limit the influence of direct and reflected solar radiation.
Learn more:
Joseph-Nicolas Delisle (1688-1768)

By Konrad Westermayr- A. C. Gaspari, F. J. Bertuch(1800) Allgemeine geographische Ephemeriden, Band 11, Weimar: Industrie - Comptoir Retrieved on 25 November 2011, Public Domain, Link
Delisle was a professor of mathematics at the College de France in Paris and a naval geographer. He was elected to the Academie Royale des Sciences in 1714 as a student of Maraldi’s. In 1725, he travelled to Saint Petersburg to establish an astronomical observatory and stayed for twenty-five years. He developed the thermometer and temperature scale used by Gaulter, and many of Gaultier’s original letters can be found with his scientific papers. He organized the international efforts to observe the transit of Venus to help determine the distance of the sun from Earth, constructing a map that showed where the best locations for observation would be around the planet. He used his numerous contacts and his membership in the Royal Society to ensure international scientific cooperation despite the international tensions of the Seven Years’ War.
Learn more:
Henri-Louis Duhamel Du Monceau (1700-1782)

By François-Hubert Drouais- http://www.ifremer.fr/envlit/actualite/20021003.htm, Public Domain, Link
Duhamel Du Monceau initially studied law in Paris, but while in Paris became interested in botany and the work of the Jussieu brothers at the Jardin du Roi. He wrote a treatise on saffron, which brought him to the notice of the Academie Royale des Science and Maurepas, minister of the navy. Duhamel Du Monceau worked on naval problems for Maurepas and with Buffon prepared a report on the strength of different types of wood. He remained interested in practical botany and forestry for the rest of his life. He was the first to be appointed inspector of the navy. He established a school for naval architecture and engineering, the Ecole de la Marine. Duhamel Du Monceau was Gaultier’s principal correspondent at the academy and submitted Gaultier’s letters and weather diaries for publication, along with similar weather observations he himself kept at his estate in France.
Learn more:
Cesar François Cassini (1714-1785)

By Jean-Marc Nattier - [1], Public Domain, Link
Son of Jacques Cassini, Cesar Francois Cassini also became, in turn, director of the Paris Observatory. His scientific contributions were in the area of geodesy and cartography; under his direction, the complete survey of France was undertaken, and his map of France was the most detailed produced at that time. He verified the length of the meridian in 1744.
Learn more:
Louis de Bougainville (1729-1811)

By Jean-Pierre Franque - Château de Versailles, Public Domain, Link
Bougainville showed an early aptitude for mathematics and in his twenties published a treatise on integral calculus. Bougainville was elected to the Royal Society of London in 1756 and to membership in the Academie Royale des Sciences in 1789. He served as secretary to Gaston-Pierre-Charles de Levis-Mirepoix, ambassador extraordinaire, who travelled to London in 1754 in an attempt to find a diplomatic solution to the skirmishes between the English and French in the Ohio valley that eventually precipitated the Seven Years’ War. Bougainville entered the military at the relatively late (for the time) age of 21; in 1756, he was named aide-de-camp to Louis-Joseph de Montcalm when the latter was given command of the French regulars in Canada. After fighting in numerous battles in North America, Bougainville was dispatched to France in 1758 to report on the situation in the colony. He returned to Canada in 1759 and commanded troops to the defence of Quebec City during the summer of 1759. After the fall of Quebec, Bougainville spent the following winter and summer of 1760 fighting in defence of the colony, was taken prisoner, and sent to France after the surrender of Montreal. In 1766, he left on an expedition of exploration and discovery around the world, exploring South America, sailing through the Strait of Magellan, and stopping in Tahiti. His descriptions of the South Pacific, and especially Tahiti, created a sensation and developed the idea of the “noble savage” and state of innocence versus civilisation, which would be later expounded upon by Rousseau. He continued his naval career until 1792. He was imprisoned during the Reign of Terror but was eventually released and in 1795 became a member of Institut de France, which in some measure replaced the Academie Royale des Sciences. He was appointed to the Bureau des Longitudes in 1799.
Learn more:
Jean-Dominique Cassini (1748-1845)
_-_Julien_L%C3%A9opold_Boilly.jpg#/media/File:Jean-Dominique_Cassini_(Cassini_IV)_-_Julien_Léopold_Boilly.jpg)
By Julien Léopold Boilly (1796-1874) - [1], Public Domain, Link
![[1]](http://www.sil.si.edu/digitalcollections/hst/scientific-identity/fullsize/SIL14-C1-16a.jpg)
The last of the Cassinis to be director of the Paris Observatory, Jean-Dominique Cassini completed the work of his father on the map of France. He was also involved in the ongoing attempt to accurately measure the longitudinal difference between the Paris and London Observatories. He was imprisoned during the French Revolution and much of his work in cartography was taken over by the new republic in the Bureau des Longitudes.
Learn more:
March: In Like a Lion, Out Like a Lamb
On this final day of March 2021, we at DRAW are reflecting on the weather proverb “In like a lion, out like a lamb.” The adage implies that the weather at the beginning of March is as fearsome as a lion, characterized by the final winter storms of the year—apart from a few April storms, as we in Southern Quebec can attest—but that the might of the March lion withers away as the month progresses, leaving us as a harmless lamb to enjoy our April showers and May flowers. The saying is also sometimes flipped, stating that “if March comes in like a lion, it goes out like a lamb, but if it comes in like a lamb, it goes out like a lion;” however, “in like a lion, out like a lamb” is the more commonly heard variation.
This nugget of folk wisdom can be traced at least as far back as 1732, when Thomas Fuller recounted it in his work Gnomologia: adagies [sic.] and proverbs; wise sentences and witty sayings, ancient and modern, foreign and British.1 The theories about the origins of the proverb range widely—from an ancient belief in balance,2 to astrology,3 to biblical stories,4 and undoubtedly many more. Though its origins are uncertain and its basis in reality contested (if not outright refuted),5 its anecdotal value is certain: the proverb has even inspired a children’s book by Marion Dane Bauer (In Like a Lion Out Like a Lamb, 2011).6
If the month of March 2021 has been any indication, there seems to be little factual merit for this proverb: Montreal has seen little snowfall the past month, and none nearing the threshold of a “snowstorm.”7 For the sake of comparison, we looked at the data from 100 years ago—March 1921—to see if that year March came in like a lion and went out like a lamb. You can see the corresponding logbook pages below.
McGill observations for Febuary 27th to March 5th, 1921.
McGill observations for March 6th to 12th, 1921.
McGill observations for March 13th to 19th, 1921.
McGill observations for March 20th to 26th, 1921.
McGill observations for March 27th to April 2nd, 1921.
What we found from a quick review was that McGill’s weather observers never recorded more than a few inches of snowfall for any given day in March 1921; therefore, at least in the case of 1921, March was quite lamblike (or perhaps, froglike, since the month was far more rainy than it was snowy).
If we hope to one day carry out a more comprehensive study, DRAW needs the help of its dedicated citizen scientists. Once the data from these logbook pages has been transcribed into digital bits, it can be used to study trends in past weather phenomena like snowstorms. As we begin Citizen Science Month tomorrow (April 1st, 2021), we encourage you to sign up as a DRAW citizen scientist and help us save this irreplaceable scientific data!
In the meantime, we are gleefully waving goodbye to our lamblike March of 2021, and looking forward to April’s showers bringing our radiant May flowers.
Sources:
1 Thomas Fuller, Gnomologia: adagies [sic.] and proverbs; wise sentences and witty sayings, ancient and modern, foreign and British (London, Printed for B. Barker [etc.], 1732): 295.
2 Farmer’s Almanac Staff. “March Weather: ‘In Like A Lion, Out Like A Lamb’?” Last modified March 8, 2021. https://www.farmersalmanac.com/the-truth-behind-in-like-a-lion-out-like-a-lamb-2867.
3 Sadie Stein. “Folk Wisdom.” The Paris Review. Last modified March 2, 2015. https://www.theparisreview.org/blog/2015/03/02/folk-wisdom/.
4 Sadie Stein. “Folk Wisdom.” The Paris Review. Last modified March 2, 2015. https://www.theparisreview.org/blog/2015/03/02/folk-wisdom/.
5 David Hamblin. “Weatherwatch: Spring comes in like a lion, goes out like a lamb.” Last modified March 9, 2012. https://www.theguardian.com/news/2012/mar/09/weatherwatch-spring-storms-constellations.
6 Goodreads. “In Like a Lion Out Like a Lamb.” Accessed March 26, 2021. https://www.goodreads.com/book/show/9921815-in-like-a-lion-out-like-a-lamb.
7 The Weather Network. “Montréal, QC - Monthly Calendar.” Accessed March 26, 2021. https://www.theweathernetwork.com/ca/monthly/quebec/montreal.
Irish Meteorologists
Happy St. Patrick's Day!
For today’s commemoration of the holiday, we thought we would look at two notable Irish Meteorologists who helped inform the practice in Montreal. Descriptions were taken from Climate in the Age of Empire by Dr. Victoria Slonosky.
Sir Edward Sabine (1788-1883)
.png#/media/File:Sir_Edward_Sabine,_1788–1883_(cropped).png)
By
Stephen Pearce
National Portrait Gallery
, Public Domain,
Link
Born in Dublin, Edward Sabine came from a long line of military officers and was enrolled in the Royal Military Academy of Woolwich at the age of fourteen. He served in the Napoleonic Wars and in North America, at Quebec and on the Niagara Peninsula, during the War of 1812. After the wars, he became involved in scientific explorations, notably on Ross’s 1818 expedition to find the Northwest Passage and later on Parry’s 1819-1820 Arctic expedition. Sabine became especially interested in magnetic and meteorological phenomena while on these voyages. He dedicated most of his long life as a soldier scientist to establishing observatories and analysing data from these two fields.
Sabine was also interested in geodesy, the measurement of the exact shape of Earth, and participated with John Herschel in one of many efforts to determine the difference in longitude between the Paris and Greenwich Observatories. Sabine was elected a member of the Royal Society in 1818 and served as its president from 1861 to 1871. He also participated in the BAAS, serving as general secretary for twenty years and president in 1852. During the 1830s, Sabine worked to build a coalition between the Royal Society, the BAAS, the military, and parliament to support his magnetic crusade, a project to which he would devote the next thirty years.
Sabine worked with the Royal Engineers, and later with the Army Medical Department, to establish regular meteorological observations for all their foreign and colonial stations. His work in analysing the vast amounts of data generated by the observatories led to pioneering research in statistical methods to discover periodic phenomena in the earth sciences. For example, he discovered that the eleven-year solar sunspot cycle was also reflected in geomagnetic observations.
Learn more about Sir Edward Sabine here:
Robert Henry Scott (1833-1916)
Scott studied experimental physics and engineering in Dublin, moving to Berlin after completing his studies. There he worked under Heinrich Wilhelm Dove, one of the most eminent meteorologists and climatologists of the nineteenth century. He translated Dove’s Laws of Storms, dedicating it to Robert FitzRoy. After FitzRoy’s death in 1865, Scott was appointed director of the Met Office by a committee appointed by the Royal Society. It is likely that his close friendship with Edward Sabine, then president of the Royal Society, helped secure Scott’s position. Scott was also secretary of the International Meteorological Committee from 1873 to 1900 and worked tirelessly to establish the international cooperation so vital in meteorology. It was through Scott that George Kingston received many of the meteorological instruments that furnished the observing posts throughout Canada.
Learn more about Robert Henry Scott here:
Learn more about other Irish Meteorologists here. Intereseted in other individuals who helped inform Canadian meteorological practice in the 18th and 19th centuries? Check out our Meet the Meterologist series (Quebec, Montreal, Hudson's Bay Company and Toronto).
Montreal's Winter Sports
Mr. R.D. McGibbon, at the 1881 Annual Dinner of the Montreal Snowshoe Club, proclaimed the following: “Those who are unacquainted with the real nature of a Canadian winter might be inclined to imagine that a period of some five or six months of perpetual ice and snow, when rivers are frozen and the thermometer almost invariably below freezing point, would be the dullest of the year, and a season of dreary and monotonous gloom for the inhabitants of the country afflicted with such uninviting clemency.”1
After another chilly February—during which many Montrealers sought the comfort of the great outdoors—we thought it would be appropriate to take a look at winter sports throughout history.
Montrealers have been braving our tough Canadian winters for centuries, but contrary to Mr. McGibbon’s proclamation, there has never been a shortage of amusing things to do, or as Norman MacMillan Hinshelwood called them, “the pleasures there are to be experienced while King Frost holds his Court.”2

Snowshoeing
Among the many winter pastimes of Montrealers past, present and future is snowshoeing. The Montreal Snowshoe Club was founded in 1840 and at the time, membership numbered only twelve people, though by 1882 it had grown into the hundreds. In his account of the Club’s history, Hugh W. Becket reported that snowshoeing had “taken a firm hold upon the youth of Montreal,” as well.3 The Snowshoe Club’s activities expanded beyond its regular “tramps,” to athletic competitions including racing and hurdle-jumping. Members of the Club were known as the “Tuques Bleues,” for the blue tuques with scarlet tassels adopted as their uniform at the Club’s 1869 Annual Meeting.4

Skating
In 1903, Hinshelwood identified skating as one of the three most popular forms of amusement during Montreal winters, along with snowshoeing and sleighing.5 “Skating is an amusement that can be enjoyed by both old and young, as no great activity is required,” noted Hinshelwood, “and the number of rinks, both covered and open, makes it a very easy matter to find some sheet of excellent skating ice in every quarter.”6 Of Montreal’s Victoria Rink, in particular, Hinshelwood wrote that it was “one of the finest covered rinks in the world.”7 Hinshelwood equally observed the many open-air rinks to be enjoyed in Montreal, and the carnivals and galas that they accommodated.8

Curling
We would be remiss to present an account of winter sports in Montreal’s history without mentioning the Royal Montreal Curling Club, the city’s (and in fact, North America’s) oldest active athletic club, founded in 1807. The RMCC moved from an indoor rink on Drummond Street to its present location in 1889, and the Ladies’ Branch of the Club was established in 1894.9 Two other Montreal clubs had sprung up by 1884: the Montreal Thistle Curling Club, established in 1843 and incorporated in 1870, and the Caledonia Curling Club, organized in 1850; the Royal Montreal Curling Club is the only remaining club of the three.10

There are certainly many other winter sports and activities that have kept Montrealers busy throughout the coldest months of the year, for centuries past: hockey, tobogganing, skiing, and sleighing were also favoured activities of the locals. Many of these activities took place at the Montreal Winter Carnivals, popular in the 1880s. If you’d like to learn more about the Winter Carnivals, you can read the DRAW blog post “On This Day: Winter Carnival 1883.”

In concluding this blog post, it seems appropriate to quote Hugh W. Becket’s reflections on winter sports:
“I have said enough—very imperfectly I regret—to convince you if indeed you need conviction, that our winter season is one which has the most pleasurable accompaniments, and that our winter sports are not only enjoyable in themselves, but thoroughly appreciated by us Canadians.”11
And perhaps, if Becket’s convincing was as weak as he believed, this confident proclamation from William George Beers will sway you:
“[...] Canadians not only look Jack Frost in the face, but force him to become our companion in sport rather than our master in misery.”12
Enjoy these last beautiful winter days before it’s time to hang up our skates and snowshoes for another year!
Sources:
1 Hugh W. Becket, The Montreal Snow Shoe Club,
its history and record, with a synopsis of the racing events of other clubs throughout the Dominion, from 1840 to the present time (Montreal: Beckett Bros., 1882): 484-485.
2Norman MacMillan Hinshelwood, Montreal : Christmas 1902 (Montreal: Desbarats, [1902?]).
3Becket, The Montreal Snow Shoe Club, 8.
4 Becket, The Montreal Snow Shoe Club, 180.
5Norman MacMillan Hinshelwood, Montreal and vicinity : being a history of the old town, a pictorial record of the modern city, its sports and pastimes, and an illustrated description of many charming summer resorts around (Montreal: Desbarats, 1903): 88-89.
6Hinshelwood, Montreal and vicinity, 89.
7Hinshelwood, Montreal and vicinity, 89.
8Hinshelwood, Montreal: Christmas 1902.
9Royal Montreal Curling Club, “History,” accessed February 28, 2021, http://royalmontrealcurling.ca/the-club/history/.
10Hugh W. Becket, Record of winter sports, 1883-84 : snowshoe and skating races, hockey and curling matches (Montreal : Becket, 1884): 109-111; Royal Montreal Curling Club, “History,” accessed February 28, 2021, http://royalmontrealcurling.ca/the-club/history/.
11Becket, The Montreal Snow Shoe Club, 490.
12William George Beers, Over the snow, or, The Montreal carnival (Montreal : W. Drysdale and J. Robinson, 1883): preface.
Weather and Poetry: Henry David Thoreau
Welcome to the next instalment of Weather and Poetry, where we explore poets who touch on weather in their works. This week we are looking at American poet Henry David Thoreau!
Henry David Thoreau

By
B. D. Maxham
-
National Portrait Gallery
, Public Domain,
Link
Henry David Thoreau (1817-1862) is a naturalist, essayist, poet and philosopher best known for his book Walden. His works in fact touched on natural history and philosophy, which helped to inform modern-day environmentalism. He was deeply interested in the idea of survival in the face of hostile elements, historical change, and natural decay.
Today we will be looking at four of his poems, all of which speak about weather phenomena.
Check out the following to learn more about Henry David Thoreau:
- Wikipedia - Henry David Thoreau
- Stanford Encyclopedia of Philosophy
- The Thoreau Society
- The Walden Woods Project
- Britannica
- The New Yorker - The Moral Judgements of Henry David Thoreau
Now onto the poems!
Poems
Mountains
With frontier strength ye stand your ground,With grand content ye circle round,
Tumultuous silence for all sound,
Ye distant nursery of rills,
Monadnock, and the Peterborough hills;—
Firm argument that never stirs,
Outcircling the philosophers,—
Like some vast fleet
Sailing through rain and sleet,
Through winter's cold and summer's heat;
Still holding on upon your high emprise,
Until ye find a shore amid the skies;
Not skulking close to land,
With cargo contraband;
For they who sent a venture out by ye
Have set the Sun to see
Their honesty.
Ships of the line, each one,
Ye westward run,
Convoying clouds,
Which cluster in your shrouds,
Always before the gale,
Under a press of sail,
With weight of metal all untold;—
I seem to feel ye in my firm seat here,
Immeasurable depth of hold,
And breadth of beam, and length of running gear.
Methinks ye take luxurious pleasure
In your novel western leisure;
So cool your brows and freshly blue,
As Time had nought for ye to do;
For ye lie at your length,
An unappropriated strength,
Unhewn primeval timber
For knees so stiff, for masts so limber,
The stock of which new earths are made,
One day to be our western trade,
Fit for the stanchions of a world
Which through the seas of space is hurled.
While we enjoy a lingering ray,
Ye still o'ertop the western day,
Reposing yonder on God's croft,
Like solid stacks of hay.
So bold a line as ne'er was writ
On any page by human wit;
The forest glows as if
An enemy's camp-fires shone
Along the horizon,
Or the day's funeral pyre
Were lighted there;
Edged with silver and with gold,
The clouds hang o'er in damask fold,
And with fresh depth of amber light
The west is dight,
Where still a few rays slant,
That even Heaven seems extravagant.
Watatic Hill
Lies on the horizon's sill
Like a child's toy left overnight,
And other duds to left and right;
On the earth's edge, mountains and trees
Stand as they were on air graven,
Or as the vessels in a haven
Await the morning breeze.
I fancy even
Through your defiles windeth the way to heaven;
And yonder still, in spite of history's page,
Linger the golden and the silver age;
Upon the laboring gale
The news of future centuries is brought,
And of new dynasties of thought,
From your remotest vale.
But special I remember thee,
Wachusett, who like me
Standest alone without society.
Thy far blue eye,
A remnant of the sky,
Seen through the clearing of the gorge,
Or from the windows of the forge,
Doth leaven all it passes by.
Nothing is true,
But stands 'tween me and you,
Thou western pioneer,
Who know'st not shame nor fear,
By venturous spirit driven
Under the eaves of heaven,
And canst expand thee there,
And breathe enough of air.
Even beyond the West
Thou migratest
Into unclouded tracts,
Without a pilgrim's axe,
Cleaving thy road on high
With thy well-tempered brow,
And mak'st thyself a clearing in the sky.
Upholding heaven, holding down earth,
Thy pastime from thy birth,
Not steadied by the one, nor leaning on the other;—
May I approve myself thy worthy brother!
Mist
Low-anchored cloud,Newfoundland air,
Fountain-head and source of rivers,
Dew-cloth, dream-drapery,
And napkin spread by fays;
Drifting meadow of the air,
Where bloom the daisied banks and violets,
And in whose fenny labyrinth
The bittern booms and heron wades;
Spirit of lakes and seas and rivers,—
Bear only perfumes and the scent
Of healing herbs to just men’s fields.
The Thaw
I saw the civil sun drying earth’s tears —Her tears of joy that only faster flowed,
Fain would I stretch me by the highway side,
To thaw and trickle with the melting snow,
That mingled soul and body with the tide,
I too may through the pores of nature flow.
But I alas nor tinkle can nor fume,
One jot to forward the great work of Time,
‘Tis mine to hearken while these ply the loom,
So shall my silence with their music chime.
Smoke
Light-winged Smoke! Icarian bird,Melting thy pinions in thy upward flight;
Lark without song, and messenger of dawn,
Circling above the hamlets as thy nest;
Or else, departing dream, and shadowy form
Of midnight vision, gathering up thy skirts;
By night star-veiling, and by day
Darkening the light and blotting out the sun;
Go thou, my incense, upward from this hearth,
And ask the gods to pardon this clear flame.
Be sure to keep a lookout for the next Weather and Poetry instalment and if you have any suggestions let us know!
Transcription Tips: Relative Humidity Average
Have you ever come across numbers in the relative humidity column that just don’t seem to fit? Perhaps they are much too high—into the hundreds—or they are listed below the last observation time? It is possible that you have run into the calculations for an average!
The average is calculated by adding together the relative humidity values for each observation time throughout the day, and dividing that sum by the number of observations. Sometimes this calculation yields a whole number, while other times the observers rounded to the nearest whole number, since the relative humidity is expressed as a percentage.
From what we have seen so far, these relative humidity averages occur from 1900 to 1918 inclusively, but they are represented differently throughout the period.
From 1900 to the end of September 1902, the observers included the sum value of the three observations, with the average below it; this makes it much easier to spot an average, since relative humidity values are expressed as a percentage and should not exceed 100%. The sum is typically separated from the observation above it by a line, and is sometimes separated from the average below it by another line.
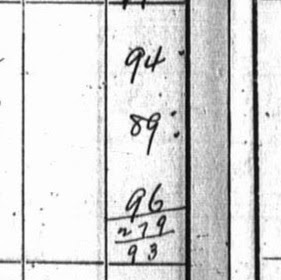
In this example from February 28th, 1900, 279 is the sum of 94 + 89 + 96. Since there are three observations, the sum is divided by three (279/3), giving an average of 93. The sum is separated from the third observation by a line, and separated from the average by another line.
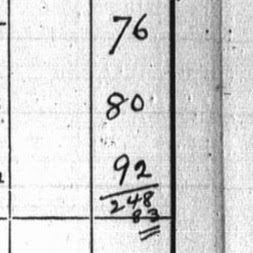
The average is sometimes distinguished by a double underline, as seen in the example above from June 23rd, 1902. In this case, there is no line separating the sum from the average.
From October 1902 onward, however, the observers generally left out the sum and recorded only the average—sometimes separated from the third observation with a line, and sometimes not. The line is often a good indication that the value below it is an average.
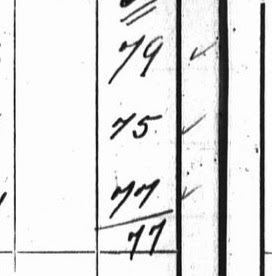
Here, the relative humidity average is separated from the previous observation by a line (November 11th, 1902)
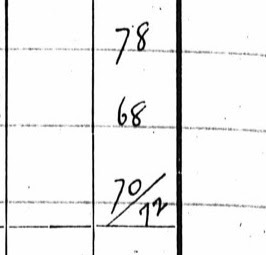
Sometimes the line separating the average from the previous observation looks more like a “slash” symbol (March 5th, 1911).
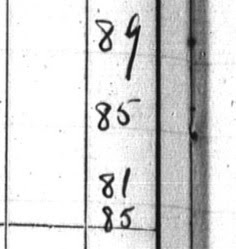
In the example above, there is no sum value or line(s) to separate the average (85) from the other three observations (December 8, 1907).
The relative humidity average is particularly hard to notice if it is recorded in a row corresponding to an observation time. Sometimes these rows even contain other observations, such as barometric readings. The average value is almost indistinguishable from any other relative humidity observation when the row includes other observations: the only clues are the year the observation was taken (from 1900-1918), a line dividing it from the observations above, or a quick calculation of the average.
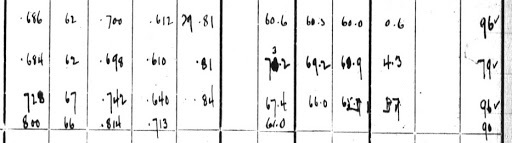
In this example from June 7th, 1904, there are other barometer and temperature observations recorded in the same row as the relative humidity average (90). There is no line separating the average from the other observations, so the only way we can guess that it is an average is by knowing that this was a common practice from 1900 to 1918, and calculating this and the other averages on the page to see if they add up. In this case, all of the other days on the page seem to record averages as well.
Sometimes, the relative humidity average value is “sandwiched” between the second-to-last and last observations of the day (in this time period, typically the third observation around 7:40pm and the fourth observation around 11:13pm). Sometimes there is a line above the relative humidity average, separating it from the third observation, while other times it is simply wedged between observations.
In the example above, the relative humidity average (82) is “sandwiched” between the third and fourth observations. This is the average for the first three observations of the day, probably calculated before the fourth observation was taken around 11:13pm (July 1, 1917).
So what should you do if you come across an instance that you believe to be a relative humidity average? If it falls within the time period and matches one of the situations described above, it likely is an average. Since our transcription platform was not built with this possibility in mind, the best way to record this value is by using the “Transcriber comments” field, which can be found furthest to the right in your Transcriber panel. Type “Relative humidity average:” or “RH avg:” followed by the value. You can use 11:59pm as the associated time for this Transcriber Comment so that it appears in a logical place in the data table relative to the other observations. Using a transcriber comment will cause the data to stand out in post-processing, so that it can be correctly interpreted.
In the example above, you would type “RH avg: 70” as a transcriber comment, with the time set at 11:59pm (April 25, 1915).
As we work with this dataset and as our dedicated transcribers make this data available, we continue to find interesting variations on the standard observation patterns, such as this. If you come across other unusual observations while transcribing a page, check out our FAQs; if you cannot find an answer there, send an email to draw.archives@mcgill.ca with the transcription number and dates covered on that page, and we will advise you on how to transcribe it.
Happy Transcribing!
Vicky Recommends
Happy Wednesday everyone! This week we are delving into the bookshelves of Victoria Slonosky, our Team Lead! Below is a list of Fiction Books which deal with weather topics that she has read, and recommends!
A Better Man - Louise Penny

The Long Winter - Laura Ingalls Wilder

Emma - Jane Austen

Spinning Silver - Naomi Novik

The Calculating Stars - Mary Robinette Kowal

Without a Summer - Mary Robinette Kowal

Komarr - Lois McMaster Bujold

The Mathematician’s Shiva - Stuart Rojstaczer

Meet the Meteorologists: Toronto
Welcome back to Meet the Meteorologists where we look at the individuals around the world who helped to contribute to the creation of meteorology as a field of study and who helped inform the practice here in Montreal.
These individuals were often interested in weather as how it connected to their day jobs. They were often intellectuals, religious figures, engineers, doctors or businessmen in communities and helped contribute to our understanding of weather in the St. Lawrence basin where Montreal resides. All individuals mentioned in this series were taken from Climate in the Age of Empire by Dr. Victoria Slonosky.
This week let’s take a look at those influential individuals from the Toronto observatories (Royal Artillery and Civillian).
Toronto Weather Observers (Royal Artillery)
John Henry Lefroy (1817-1890)

By John Watt Beattie (1859-1930) - Link
Lefroy was educated at the Royal Military Academy in Woolwich, where he met Charles Younghusband. Although initially hoping to be accepted into the Corps of Engineers, he was posted instead to the Royal Artillery, with further study in astronomy at the Royal Engineer’s school. In 1839, Lefroy was selected by Sabine to go to Saint Helena in the South Atlantic to take magnetic observations. He was trained in magnetic observations by Humphrey Lloyd in Dublin. He remained at Saint Helena until 1842, when he was transferred to the Toronto Observatory after Charles Riddell was granted medical leave and resigned the post of director. Before taking up his duties in Toronto, Lefroy spent nearly two years on a voyage of scientific discovery in the Canadian Northwest, which established his reputation as a geoscientist. At Fort Chipewyan in Alberta he made hourly magnetic observations, with his companion Bombardier William Henry, for over four months, with readings taken every two minutes during episodes of high magnetic activity. These were later described by Humphrey as the most important contributions to the study of the geomagnetism ever made. Upon his return to Toronto late 1844, he took up the directorship of the observatory. Lefroy was elected to the Royal Society in 1848 and, as a founding member, acted as both vice president and later president of the Canadian Institute. He returned to England in 1853, where he continued his scientific work as a part of his military career. He was appointed governor of Bermuda and was also closely involved in the Crimean War. He returned to Canada for the 1884 meeting of the British Association for the Advancement of Science (BAAS), where he served as president of the geographical section (Vetch and Stearn 2004; Whitfield and Jarrell 1982; Lefroy 1895; Toronto Public Library 1967, p.95).
Learn more:
Charles J. Buchanan Riddell (1817-1903)
An officer and geologist, Riddell entered the Royal Military Academy at Woolwich and graduated into the Royal Military in 1834. His first tour of duty was in Quebec from 1835 to 1837. He was chosen to serve as superintendent of the Canadian Magnetic and Meteorological Observatory under Sabine and was acting officer in charge of establishing the observatory. It was Riddell, acting under Bayfield’s geological advice, who made the decision to relocate the observatory to Toronto. He was invalided back to England in 1841, where he was given the position of assistant superintendent of the military magnetic observatories. In this post, he continued to help Sabine in the collation and analysis of magnetic observations. He was elected to the Royal Society in 1842 (James and Baigent 2004; Toronto Public Library 1967, p.95).
Learn more:
Charles Younghusband (1821-1899)
Described by Lefroy as “the youngest and smallest officer in the service” (Lefroy 1895, p.19) Charles Younghusband followed his father into the Royal Artillery. Younghusband unexpectedly became acting director of the Toronto Observatory at the age of twenty when Riddell was sent home on medical leave and Lefroy, the appointed director, was on a two-year scientific expedition of the Canadian Northwest. He was later attached to Sabine’s office and became a member of the Royal Society in 1852.
Learn more:
Toronto Observatory (Civilian)
George Kingston (1816-1886)

By Unknown author - Public Domain, Link
Kingston was born in Portugal, the son of an English wine merchant, and was sent to school in England. He entered the Royal Navy and was awarded the gold medal for mathematics at the Naval College. He left the navy at the age of twenty-six and enrolled at Cambridge, where he earned an MA in mathematics. He emigrated to Canada where he became the head of the Naval College in Quebec City and in 1855 took the position of professor of the Department of Meteorology at King’s College. York (later the University of Toronto), and director of the Toronto Observatory. The latter had passed into civil control of the provincial government of Upper Canada (Ontario) when the Royal Artillery withdrew from the observatory in 1854. With the cooperation of Egerton Ryerson, Kingston instituted a network of observers at twelve grammar schools across Ontario. Kingston and other meteorologists campaigned for the formation of a Canadian national meteorological service. They succeeded in having the Meteorological Service of Canada (MSC) inaugurated in 1871 under the Department of the Marine and Fisheries for the purposes of issuing storm warnings. Thereafter, Kingston took an active role in developing Canada’s official meteorological service, corresponding with volunteer observers, distributing instruments, and collecting observations nationwide (Thomas 1982; Toronto Public Library 1967, p.95).
Learn more:
- Wikipedia - George Kingston
- The Canadian Encyclopedia - George Templeman Kingston
- Toronto Public Library Record on George Templeman Kingston
A Frosty Montreal Christmas
As we approach the Christmas holiday, we thought we would celebrate in the best way we know how… with some weather data! This blog post will explore the weather 140 years ago, on Christmas Day (December 25), 1880...
“Again, and yet again,” proclaimed the Montreal Herald and Daily Commercial Gazette, “Christmas ‘returns with the revolving year,’ and, as it has been for so many centuries, will be again celebrated with the advent of frost and ice amid the depths of winter [...].” 1
The air temperature on this particular Christmas day ranged from 12.3°F (about -10°C) at 3:13 am to 20.2°F (about -6.5°C) at its warmest, twelve hours later at 3:13 pm. The northeastern wind was calm. The day was overcast, with a full cloud cover. It was an average December day, but what made nature come alive that day was the clinging hoar frost, “about an inch thick” according to that day’s McGill University weather observer.
Hoar frost is formed when dew is deposited on an object with a temperature below water’s freezing point. The formation of hoar frost requires moist air, ideally in conditions with a relative humidity value above 80%2. Hoar frost is commonly mistaken for rime, which only forms in foggy conditions.3

The presence of hoar frost on this particular Christmas day is easily explained by the high relative humidity values recorded in the few days prior, and the hoar frost already present on Christmas Eve. The mean relative humidity values for December 22nd, 23rd, and 24th were 87.8%, 93%, and 93.2%, respectively.
.jpg)
The term “hoar frost” comes from the English word “hoar” which refers to grey or white hair, to which the frost bears a certain resemblance.4
This enchanting frost prompted the Montreal Herald and Daily Commercial Gazette to recall the lines of Lord Houghton’s Christmas Story:
Frost diamonds twinkle on the grass
Transformed from pearly dew
And silver flowers encrust the glass
Which gardens never knew.
No matter the weather, we at DRAW are wishing a very Merry Christmas to all those who celebrate!
Sources:
1 Montreal herald and daily commercial gazette, December 25, 1880: https://numerique.banq.qc.ca/patrimoine/details/52327/3758945
2Russell D. Thompson, Atmospheric Processes and Systems (Taylor and Francis Group, 1998): 69
3Robert Henry Scott, The Observer’s Handbook (Darling & Son Ltd, 1908): 53.
4 "hoar, adj. and n.". OED Online. December 2020. Oxford University Press. https://www-oed-com.proxy3.library.mcgill.ca/view/Entry/87396?rskey=Emoxng&result=1&isAdvanced=false (accessed December 18, 2020).
Weather and Poetry: Ralph Waldo Emerson
Welcome to the next instalment of Weather and Poetry, where we explore poets who touch on weather in their works. This week we are looking at American poet Ralph Waldo Emerson
Ralph Waldo Emerson

By Link
Ralph Waldo Emerson (1803-1882) was an American essayist, lecturer, philosopher, most recognizably, a poet. He led the transcendentalist movement of the mid-19th century. This movement believed in the inherent goodness of people and nature. It comes to no surprise then that the subjects of some of his essays and other writings were about the relationship between the soul and the surrounding world!
Today we will be looking at three of his poems, all of which speak about weather phenomena.
Check out the following to learn more about Ralph Waldo Emerson:
- Wikipedia - Ralph Waldo Emerson
- Stanford Encyclopedia of Philosophy
- Biography.com
- Poetry Foundation
- Britannica
- Poets.org
- Goodreads
Now onto the poems!
Poems
The Snow Storm
Announced by all the trumpets of the sky,Arrives the snow, and, driving o'er the fields,
Seems nowhere to alight: the whited air
Hides hills and woods, the river, and the heaven,
And veils the farmhouse at the garden's end.
The sled and traveler stopped, the courier's feet
Delayed, all friends shut out, the housemates sit
Around the radiant fireplace, enclosed
In a tumultuous privacy of storm.
Come see the north wind's masonry.
Out of an unseen quarry evermore
Furnished with tile, the fierce artificer
Curves his white bastions with projected roof
Round every windward stake, or tree, or door.
Speeding, the myriad-handed, his wild work
So fanciful, so savage, nought cares he
For number or proportion. Mockingly,
On coop or kennel he hangs Parian wreaths;
A swan-like form invests the hidden thorn;
Fills up the farmer's lane from wall to wall,
Maugre the farmer's sighs; and, at the gate,
A tapering turret overtops the work.
And when his hours are numbered, and the world
Is all his own, retiring, as he were not,
Leaves, when the sun appears, astonished Art
To mimic in slow structures, stone by stone,
Built in an age, the mad wind's night-work,
The frolic architecture of the snow.
The River
And I behold once moreMy old familiar haunts; here the blue river,
The same blue wonder that my infant eye
Admired, sage doubting whence the traveller came,
—
Whence brought his sunny bubbles ere he washed
The fragrant flag-roots in my father’s fields,
And where thereafter in the world he went.
Look, here he is, unaltered, save that now
He hath broke his banks and flooded all the vales
With his redundant waves.
Here is the rock where, yet a simple child,
I caught with bended pin my earliest fish,
Much triumphing, —and these the fields
Over whose flowers I chased the butterfly,
A blooming hunter of a fairy fine.
And hark! where overhead the ancient crows
Hold their sour conversation in the sky:—
These are the same, but I am not the same,
But wiser than I was, and wise enough
Not to regret the changes, tho’ they cost
Me many a sigh. Oh, call not Nature dumb;
These trees and stones are audible to me,
These idle flowers, that tremble in the wind,
I understand their faery syllables,
And all their sad significance. The wind,
That rustles down the well-known forest road—
It hath a sound more eloquent than speech.
The stream, the trees, the grass, the sighing wind,
All of them utter sounds of ’monishment
And grave parental love.
They are not of our race, they seem to say,
And yet have knowledge of our moral race,
And somewhat of majestic sympathy,
Something of pity for the puny clay,
That holds and boasts the immeasurable mind.
I feel as I were welcome to these trees
After long months of weary wandering,
Acknowledged by their hospitable boughs;
They know me as their son, for side by side,
They were coeval with my ancestors,
Adorned with them my country’s primitive times,
And soon may give my dust their funeral shade.
Song of Nature
Mine are the night and morning,The pits of air, the gulf of space,
The sportive sun, the gibbous moon,
The innumerable days.
I hid in the solar glory,
I am dumb in the pealing song,
I rest on the pitch of the torrent,
In slumber I am strong.
No numbers have counted my tallies,
No tribes my house can fill,
I sit by the shining Fount of Life,
And pour the deluge still;
And ever by delicate powers
Gathering along the centuries
From race on race the rarest flowers,
My wreath shall nothing miss.
And many a thousand summers
My apples ripened well,
And light from meliorating stars
With firmer glory fell.
I wrote the past in characters
Of rock and fire the scroll,
The building in the coral sea,
The planting of the coal.
And thefts from satellites and rings
And broken stars I drew,
And out of spent and aged things
I formed the world anew;
What time the gods kept carnival,
Tricked out in star and flower,
And in cramp elf and saurian forms
They swathed their too much power.
Time and Thought were my surveyors,
They laid their courses well,
They boiled the sea, and baked the layer
Or granite, marl, and shell.
But he, the man-child glorious,--
Where tarries he the while?
The rainbow shines his harbinger,
The sunset gleams his smile.
My boreal lights leap upward,
Forthright my planets roll,
And still the man-child is not born,
The summit of the whole.
Must time and tide forever run?
Will never my winds go sleep in the west?
Will never my wheels which whirl the sun
And satellites have rest?
Too much of donning and doffing,
Too slow the rainbow fades,
I weary of my robe of snow,
My leaves and my cascades;
I tire of globes and races,
Too long the game is played;
What without him is summer's pomp,
Or winter's frozen shade?
I travail in pain for him,
My creatures travail and wait;
His couriers come by squadrons,
He comes not to the gate.
Twice I have moulded an image,
And thrice outstretched my hand,
Made one of day, and one of night,
And one of the salt sea-sand.
One in a Judaean manger,
And one by Avon stream,
One over against the mouths of Nile,
And one in the Academe.
I moulded kings and saviours,
And bards o'er kings to rule;--
But fell the starry influence short,
The cup was never full.
Yet whirl the glowing wheels once more,
And mix the bowl again;
Seethe, fate! the ancient elements,
Heat, cold, wet, dry, and peace, and pain.
Let war and trade and creeds and song
Blend, ripen race on race,
The sunburnt world a man shall breed
Of all the zones, and countless days.
No ray is dimmed, no atom worn,
My oldest force is good as new,
And the fresh rose on yonder thorn
Gives back the bending heavens in dew.
Be sure to keep a lookout for the next Weather and Poetry instalment and if you have any suggestions let us know!
Interview with Renee Sieber: What is Citizen Science
Welcome to this week’s edition of the DRAW Blog! DRAW had the pleasure of interviewing Dr. Renee Sieber to discuss 4 questions about Citizen Science:
- What is Citizen Science?
- Why Citizen Science?
- How can Citizen Scientists Contribute to Scientific Research and Discovery?
- How do you Determine if Citizen Science is Right for a Project?
Renee is an Associate Professor at McGill University, holding equal appointments in the Bieler School of Environment and the Department of Geography. Her current research focuses on the intersection of technology (such as communications, E-commerce and Geographic Information Systems) and public participation or civic engagement. Renee is also a part of the DRAW Team, contributing her knowledge of citizen science, user-centered design and providing another facet to our interdisciplinary team.
You can learn more about Renee here:
Now on to our Questions!
What is Citizen Science?
Citizen Science, at the basic definition, is scientific research conducted by non-professional scientists, those who do not have credentials. Renee includes that defining what citizen science is can be difficult as it “depends on who you talk to”.
“It could be citizens actively or passively engaged in the practice of science. It could be citizens who utilize science for social and political influence. Variations depend based on what you are talking about, the users or the goals. You could include people contributing to social media platforms as participating in citizen science. Or you could have school children who are in an adopt a watershed program. Or you could have the people in Flint, Michigan who were responding to being poisoned by a state government in which the state government refused to send in scientists to monitor and the citizens got together and hired an outside scientist to t test the water.”
Renee notes that citizen science is also somewhat complicated by the baseline activities and technology. “Citizen science’s roots, at least in Britain, traces itself to ramblers, people who go on evening walks or weekend walks but they often would note in their journals when the first trees bloomed or trees turned colour or lost their leaves. It can be somewhat confused with the role of technology because it really has become so popular because of these giant citizen science platforms. [It’s no longer] merely people in the local community that have to go around and find all these separate cases of individuals now you have these platforms that have global reach”.
Citizen science also varies by whether you are doing direct observations or passive observations. Galaxy Zoo and eBird are good examples. “With eBird you are going sighting and then taking your handwritten notes and uploading them or in certain applications you are uploading via mobile. [With] Galaxy Zoo you are presented with images and interpret what you see in the images”.
There is some debate about whether DRAW is citizen science or not, as well Renee notes. “In the scientific community there is not a lot of transcription. In the humanities there is a lot of transcription. So historical weather bridges the humanities and sciences where it concerns mode of contribution”.
Why Citizen Science?
One major reason is lack of credentialed scientists.
“One of the sad facts about scientific activities is that resource cuts often mean cuts, for example, in field biologists - and Canada is a big country. It requires a lot of human labour to cover the extent as it is not only big but there’s a steep population gradient with the population concentrated in cities and sparsely elsewhere. It takes a lot of employed STEM to cover the geographic extents of Canada so you may very well cut that kind of staff. It’s not merely, for example, successful astronomers capturing millions of images and we don’t have enough person power to do [the description]. And we can no longer afford to fund graduate students and government research to do it so the only alternative we have now to do daily work is to rely on volunteer contributions”.
Why users may contribute to citizen science is more complex. Motivations could include social justice, preserving the environment, pride in their locale, genealogy, professional interest, or even malicious intentions. “There are people who have studied the motivation of people to contribute to citizen science and the number one reason for contribution[s]...is ‘I realize science is important, generic or specific, so my efforts contribute to a larger body of basic and applied knowledge’”.
Separate motivations could include preserving the environment, or that the individual is proud of where they live and they want them to know about where they live. For example, “DRAW could appeal to people who live in Montreal but also potentially people who have left Montreal or who resided in Montreal and this is a way of amplifying the importance of the city in the historical climate supply change of information”. Or, it could be because the project has a connection to past relatives, such as with Old Weather where the “motivation is genealogical also partly historical but it was my grandfather was on this ship and he or someone recorded the weather as it transverse the Atlantic”.
Professional intent is also possibly a reason for why individuals would contribute to citizen science projects. “Some jobs in the software industry expect you to have contributed to GitHub or Ask.com or Stack Overflow, showing that you have been a good citizen in helping others out.”
And as mentioned, there are some who contribute to provide wrong answers, which thankfully is relatively small. Renee notes that there are citizen science projects which were created to prove theories wrong: “there is at least one citizen science site for skeptics trying to disprove that certain locations are producing accurate temperature and other data”.
The third thing to keep in mind in regards to why citizen science is that sometimes “it’s important for people to get interested in science or historical transcription just for the sake of it. The more people you have involved, the more you have an educated public”.
How can Citizen Scientists Contribute to Scientific Research and Discovery?
When looking at the Levels of Engagement listed in Muki Haklay’s article, there is the question of passive vs active consumption of science. Renee notes “it is not merely a matter of contributing to but a matter of consumption of. There is value to the public at large and scientists to just be involved in science. It builds a public consciousness of the importance [of the work] and it might build a constituency [who would] advocate on [their behalf].”
The question that researchers face is how deliberate does the contribution have to be? If you are just consuming the information, such as visiting a museum or science center, are you being a citizen scientist? When does your activities become active participation (transcribing, interpreting images) rather than passive participation (leaving your computer on for grid computing, visiting science centres)? Renee’s own research comes into contact with questions of participation and engagement and she says these terms are “unbelievably hotly contested”.
She notes that “it can be excruciatingly difficult to draw hard boundaries between these various activities”, and mentions things like public participation or civic participation (attending a city hall meeting), museum memberships (visiting exhibits), or whether one’s participation is caused by another’s (such as your parent participating in an Parent Teacher Association). And there is a consideration of direct and indirect contributions: if you contributed one observation vs. reviewed someone else’s contribution.
There are also political power dimensions to consider: the motivations are often a means to an end.
“What are those ends and who gets to decide what those ends are? If you’re a citizen scientist in Flint, Michigan, your goal was not to contribute to science generally, your goal was to stop being poisoned. If you were a member of Act Up during the 80s, when the AIDS crisis was killing thousands of people, the fact that you protested at the CBC, the fact that you got donations to hire your own medical researchers to investigate the disease, that’s about citizen science for influence”.
How do you Determine if Citizen Science is Right for a Project?
“This is a very good question and there was actually a recent publication, that I can’t recall now, called ‘Is Citizen Science Right For You?’.” She continues that you need to consider the users themselves and technology above all and notes that citizen science isn’t easy. “It’s like watching an excellent guitar player and the guitarist makes it easy. Good citizen science platforms make citizen science look easy.”
As mentioned, users are an important consideration. Domain scientists need to keep in mind that the “most important aspect is to not disrespect the contributors” - you should not treat them as if they are merely “cogs in a giant exploitative machine of data collection”, a means to an end.
“If however you are interested, there is a topic that is socially relevant in terms of science but you just don’t have the person power to do it...then a good case can be made”. It’s “more than exploiting uncompensated labour”, its identifying “an urgent scientific need or societal need”.
Something else to consider is that citizen science is not easy, technology-wise. “Often you need tech support and you need it sustained because browsers change, various components change, the application usually brakes”. She continues, stating that this is why “so much money has been invested in Zooniverse as a platform because there’s been this global...recognition that the stuff is way too technically complicated for a lot of domain scientists to do.”
You can of course do citizen science without relying on these large platforms; DRAW is one such example. But you need to recognize that “these are not trivial to implement and maintain over time and often it is up to you to do the maintenance”. This is why most projects are time limited, as they are dependent on research money which can run out.
She continues noting DRAW’s interdisciplinarity, which is exemplary in the field. “Not all projects take advantage of interdisciplinarity of this kind of research so it is actually a good opportunity if there are interdisciplinary angles in your research. [It] has its own costs but if you have the time and the will you can reap massive benefits”.
Interested in learning more about Citizen Science? Check out these resources:
- Citizen Science: How Ordinary People are Changing the Face of Discovery, by Caren Cooper
- Citizen Science Association
- Citizen Scientists
- National Geographic: Citizen Science
- Wikipedia: Citizen Science
- Government of Canada: Citizen Science Portal
- EBird
- Galaxy Zoo
- Old Weather
Meet the Meteorologists: Hudson's Bay Company
Welcome back to Meet the Meteorologists where we look at the individuals around the world who helped to contribute to the creation of meteorology as a field of study and who helped inform the practice here in Montreal.
These individuals were often interested in weather as how it connected to their day jobs. They were often intellectuals, religious figures, engineers, doctors or businessmen in communities and helped contribute to our understanding of weather in the St. Lawrence basin where Montreal resides. All individuals mentioned in this series were taken from Climate in the Age of Empire by Dr. Victoria Slonosky.
This week let’s take a look at those influential individuals from the Hudson's Bay Company, which is the oldest incorporated joint-stock merchandising company in the English-speaking world. Learn more about the HBC here and here
William Wales (1734-1798)
Wales was a mathematician, astronomer, and scientific explorer who was sent with Joseph Dymond to Churchill, on the western shore of Hudson Bay, to observe the 1769 transit of Venus (Carlyle and Howse 2004; Wulf 2012). He spent the winter of 1768-1769 at Fort Churchill preparing for the transit and kept a meteorological journal during his stay.
Learn more:
- Wikipedia - William Wales
- Captain Cook's Computer, the Life of William Wales FRS (1734-1798) by Wendy Wales
Thomas Hutchins (unknown-1790)
Hutchins was a surgeon first employed by the HBC at York Factory in 1766. He worked together with Andrew Graham, master of the post of Fort Severn, Ontario, inspired by William Wales’ year in York Factory in 1768-69. Hutchins was interested in meteorology, performing careful and detailed experiments on the congelation of mercury, which won him the Royal Society’s prestigious Copley medal in 1783, and kept meteorological and magnetical observations (Houston et al 2003; Williams 2003; Binnema 2014).
Learn more:
Samuel Hearne (1745-1792)

Public Domain, Link
Born in London, Hearne joined the Royal Navy at the age of eleven as servant to a captain during the Seven Years’ War. During the winter of 1768-1769 he learned astronomical and navigational skills from William Wales, posted to the Prince of Wales Fort by the Royal Society to observe the Transit of Venus in June 1769. Hearne retired to London in 1787, and encouraged by Wales and Laperouse, published his travel journals and notes of his explorations in the northwestern continental interior, including scientific and ethnographic details of interest to scientists and explorers (Houston et al 2003; Mackinnon 2003; Binnema 2014).
Learn more:
- Wikipedia - Samuel Hearne
- Hudson s Bay Company History Foundation - Samuel Hearne
- Canadian Encyclopedia - Samuel Hearne
- Britannica - Samuel Hearne
John Siveright (1779-1856)
Siveright was born in Scotland and, at the age of nineteen, entered the fur-trade as an apprentice clerk with the Montreal-based new North-West Company. After an incidence of violence between the North-West Company, the Hudson’s Bay Company, and the Red River settlement in 1816, Siveright was posted to Sault Sainte Marie (which he labelled in his journals as Saint Marys Falls) from 1821 to 1823 and then to Fort Coulonge on the Ottawa River from 1823 to 1832. Following the coalition between the North-West Company and the Hudson’s Bay Company, Siveright was retained as a clerk by the Hudson’s Bay Company. Following the directives that had been put in place in the 1810s, Siveright kept meticulous weather records, copies of which were retained in McCord’s scientific papers. He was put in charge of the Timiskaming district in 1843, was briefly a chief factor in Montreal, and retired to Scotland in 1849 (Galbraith 1985; Arthur 1985).
Learn more:
- Wikipedia - John Siveright
- Manitoba Historical Society - Memorable Manitobans: John Siveright
- Dictionary of Canadian Biography - John Siveright
Rainfall
In many ways, rain is both one of the simplest and one of the most difficult of the meteorological elements to measure and record. It is simple to record as all it takes is a rainfall gathering and measuring device – a graduated tube- and rainfall measurements are thousands of years old.

Rainfall measurements are difficult because “rain” covers everything from a gentle drizzle with hardly any accumulation to torrential downpours unleashing floods in a matter of minutes. Strong winds can send falling water sideways, making it miss any measuring container. If the rain isn’t recorded immediately after it fell, heat, sun and wind can evaporate water quickly, leaving less water in a catchment device than actually fell. Trees, fences or buildings, to say nothing of larger landscape features such as Mount Royal, can shield or funnel rainfall to a particular place.
Even worse, a slow change in the environment, such as trees growing over decades, can gradually alter a recording environment to bring nearly imperceptible changes to the measurements that are not due to a change in the weather regime or climate, but which can add up over decades or centuries. These are called inhomogeneities. There is considerable debate on whether and how these measurements should be adjusted; on the one hand, they do reflect the actual, original measurements, but on the other, we know at least some of the long-term trends they contain may be influenced by factors other than climate variability, such as trees gradually growing to shield the catchment area.
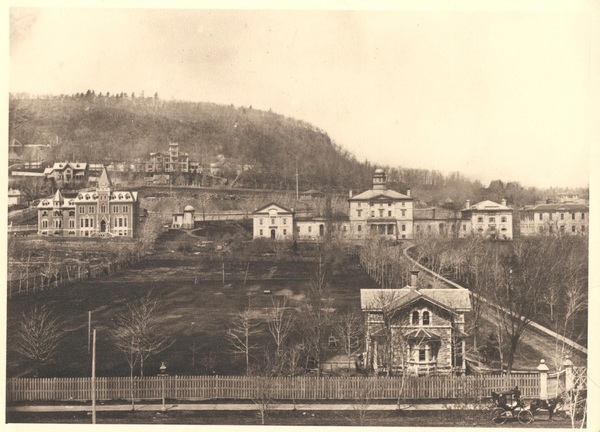
If you have visited McGill's downtown campus recently, you will notice a the striking differences seen in this image from ca. 1874(so much open space!) ['McGill University campus with view of observatory', McCord Museum, MP35179/McGill University Archives, PR023224]
In comparing the original working documents from a hundred years ago to the publicly available data available today from websites, we see some interesting differences. While Canada has an amazing amount of open, freely available and up to the minute weather data, (with huge thanks to our colleagues in Environment and Climate Change Canada who make this happen), there is not often space on the form for “extra” information such as the amount of rain that fell from a specific event or storm. When looking at the original registers, however, we can often see how the observers made notes on specific rainfall events or storms, writing down precisely how much rain fell and when. In fact, the historical observers trying to associate rainfall amounts with particular observation times is the source of one of our biggest difficulties in trying to transcribe the observations into neat boxes – the observers often used brackets to indicate that rain continued over several observation times, or else scribbled in a note to say exactly when the rain fell to add in extra precision. There are things we’ve gained with modern technology, but things we’ve lost as well.
An example of rain amount measured over several observation times.
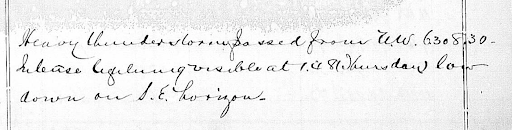
In-dept observation of a thunderstorm outside regular observation times.
Observations of snowfall, not adding up to measurable amounts.
With measuring tools such as radar and satellites able to sense water vapour or precipitation in clouds even before any rain actually falls, we also have new ways to measure cloud humidity and predict rainfall. Methods developed at the current McGill Radar Observatory use radar and models to predict rain, snow or the transition from rain to snow over periods of up to three hours
Rain will always remain one of the fundamental elements of any weather report, both because of its obvious importance as a key element of the weather we experience and because of the simplicity of measurement gauges. Still, rain, like the clouds that generate it, also remains a complex and elusive phenomenon.
Introducing DRAW Members: Jazmine Aldrich
Introducing…
Who:
Jazmine Aldrich

From:
Eastern Townships, Quebec
Role at DRAW:
Research Assistant
Favourite part of DRAW?
Favourite Season?
Summer
Favourite Weather Symbol?
Aurora
Favourite Cloud Type? Why?
Cumulus, because they're fluffy!
Coolest thing you’ve learned while participating in DRAW?
How to decipher complex weather observations that combine words and symbols.
And of Course:
Sweet or Salty?
Sweet
Star Wars or Star Trek?
Star Wars
Cats or Dogs?
Cats
Favourite Animal?
Horse
Favourite place in Montreal?
McGill
Keep checking out the blog to see more DRAW Member Introductions in the coming weeks alongside our usual content!
Meet the Meteorologists: Montreal
Welcome back to Meet the Meteorologists where we look at the individuals around the world who helped to contribute to the creation of meteorology as a field of study and who helped inform the practice here in Montreal.
These individuals were often interested in weather as how it connected to their day jobs. They were often intellectuals, religious figures, engineers, doctors or businessmen in communities and helped contribute to our understanding of weather in the St. Lawrence basin where Montreal resides. All individuals mentioned in this series were taken from Climate in the Age of Empire by Dr. Victoria Slonosky.
This week let’s take a look at those influential individuals from Montreal!
Thomas McCord (1750-1824)
McCord was a Protestant Irish businessman and public office holder. Thomas McCord’s father, John McCord, settled in Quebec in 1764 and engaged in trade. Thomas McCord became a businessman in 1770 and was a citizen of some importance by the 1790s. He left for Ireland in 1796 for business purposes on what was intended to be a brief visit, but political unrest and rebellion prolonged his stay until 1805 when he returned to Montreal as a general merchant. He was a member of the elected assembly, justice of the peace, and police magistrate and was a political force behind the establishment of a regular paid police force in 1818. Starting in 1813, McCord worked with his young son John Samuel to record temperatures in Montreal (Senior 1987).
Learn more:
- Wikipedia - Thomas McCord
- Dictionary of Canadian Biography - Thomas McCord
- Assemblée nationale du Québec - Thomas McCord
Alexander Skakel (1776-1846) and William Skakel (unknown-1863)
A Scottish educator who taught at the Classical and Mathematical School and later at the Royal Grammar School, Alexander Skakel was one of Montreal’s principal educators in the early nineteenth century. Skakel taught John Samuel McCord and Archibald Hall as well as many other citizens of Montreal in the late nineteenth century. He was a founding member of the Montreal Natural History Society. Skakel is likely to have started keeping meteorological observations with his brother William in the early 1820s. Fragments (probably copies) of the observations survive for 1842-1852 and 1862-1868 (Frost 1988). William was Alexander Skakel’s brother, who is presumed to have continued Alexander’s meteorological record after Alexander’s death in 1846.
Learn more:
Robert Cleghorn (1778-1841)
Cleghorn was a Scottish botanist who operated Montreal’s first commercial nursery, Blink Bonny Gardens, north of the city. Fragments of his records, including daily temperatures, survive for the period 1829 to 1833 (McGuire 2010).
Learn more:
John Bethune (1791-1872)
Bethune was an Anglican clergyman, the son of a Presbyterian minister and a refugee from the American revolution. He was educated by Bishop Strachen in Upper Canada and was influenced by Strachan to become an Anglican, rather than a Presbyterian, clergyman: the first to be educated and ordained in Canada. Bethune was assigned to be a minister of Christ Church and rector of the Anglican parish in Montreal in 1818. He was the principal of McGill College from 1835 to 1846, a contentious period during which he came into conflict with other educational authorities in Montreal. Bethune succeeded nonetheless in starting the construction of the McGill University campus. He remained at Christ Church Anglican parish for the rest of his life, becoming dean in 1854. He kept a meteorological diary, noting the minimum and maximum temperature, barometric pressure, wind, and weather from 1838 to 1860 (Cooper 1972).
Learn more:
John Samuel McCord (1801-1865)
One of the most prominent meteorologists of the first half of the nineteenth century, John Samuel McCord was considered by Smallwood to be the “Pioneer of Canadian Meteorology” (Smallwood 1860, p.309). As a child and young man, John Samuel contributed to and may even have been the instigator, under the influence of his teacher Alexander Skakel, of the meteorological journal kept with his father from 1813 to 1826. He studied law and was a member of the Montreal Militia. He was deeply involved in the Natural History Society of Montreal (NHS), acting as secretary in the 1830s and 1840s. McCord instigated the first bihourly weather observations kept by the military on Saint Helen’s Island from 1839 to 1841. His involvement in the government’s military action to quell the Rebellions of 1837-1838 may have led to his semi-exile from Montreal by means of his appointment as a district court judge, which involved considerable travel and significantly curtailed his scientific activities (Young 2014). In his quest to determine whether the climate had changed, and whether humans were responsible for any changes in climate, McCord collected and analysed numerous historical records of weather and climate. These were conserved among his scientific pages by his son, David Ross McCord, and are housed in the archives of the McCord Museum of Canadian History. McCord’s own observations, along with those he collected from other observers, now form the core of the documents used in modern studies of the climatic history of the Saint Lawrence valley region.
Archibald Hall (1812-1868)
A native Montrealer, Hall studied under Skakel as a child and as a young man became one of Skakel’s natural philosophy demonstrators during Skakel’s evening classes and public lectures for adults. Hall studied medicine at McGill before completing his medical degree in Edinburgh. He was appointed to the McGill Medical Faculty in 1835, where he remained for the rest of his life. He was also associated with the Montreal General Hospital. He had an interest in zoology and was awarded the Natural History Society’s silver medal for his memoir on the mammals and birds of Montreal. He edited two medical journals, the British American Journal of Medical and Physical Science and later the British American Journal. Hall kept detailed meteorological records that he published in these journals, which he also sent to Joseph Henry as part of the Smithsonian volunteer weather observing network (Canada Medical Journal 1868; Bensley 1976).
Learn more:
Charles Smallwood (1812-1873)
Born and educated in Birmingham, Charles Smallwood studied medicine in England at the University College of London, graduated with an MD and emigrated to Canada in 1833. In 1834, he settled in Saint Martin on Ile Jesus in the Saint Lawrence River, just to the north of Montreal (present-day Laval), where he “acquired one of the largest medical practices in the Country” (Smallwood 1861). He built his own observatory where he kept not only detailed meteorological records but also observations on terrestrial magnetism, atmospheric electricity, and ozone. Smallwood developed various self-recording instruments. He received some government support for his observatory, and in 1862 moved the observatory to McGill University, where he was appointed honorary professor of meteorology. Astronomical observations for timekeeping also made McGill Observatory the principal centre in Canada for the determination of time and longitude. Smallwood was also a member of the Natural History Society of Montreal and the American Association for the Advancement of Science (Marshall 1972; Marshall and Bignell 1969).
Learn more:
William Sutherland (Sunderland) (1815-1875)
Sutherland graduated from McGill Medical School in 1836 and spent several years on the Niagara frontier before returning to Montreal in the early 1840s. Sutherland participated in a bilingual medical school, giving lectures once in French and once in English as well as operating a free dispensary for poorer patients. Sutherland also edited a medical journal with Francis Badgely. Sutherland was appointed to the McGill Medical Faculty in 1849. William Sutherland’s meteorological and personal diary for 1844-1848 is conserved in the McGill University Archives (Canada Medical Record 1875; Canada Medical and Surgical Journal 1875; Roland and Bernier 2000).
Clement Henry McLeod (c.1850-1917)
One of the first engineering graduates of McGill in 1874, as an undergraduate McLeod had been allowed to live in the main college building so as to be able to take readings at the McGill Observatory. After Smallwood’s death in November of 1873, McLeod was given charge of the observatory. He trained briefly under George Kingston in Toronto. McLeod was eventually appointed supervisor of the observatory as well as professor of the Department of Civil Engineering and vice dean of the Faculty of Science at McGill. He and his students undertook important observations in the telegraphic determination of longitude in 1883, which resulted in more accurate measurements for the entire continent (Bignell 1962).
Learn more:
Interview with a Scientist: Operational Meteorologist Dov Bensimon
Welcome to this special edition of the DRAW Blog on Science Literacy Week 2020!
In honour of Science Literacy Week, DRAW has interviewed Dov Bensimon, Operational Meteorologist in the Environmental Emergency Response Section at the Canadian Centre for Meteorological and Environmental Prediction (CCMEP) and Manager of the Montreal Volcanic Ash Advisory Centre (VAAC).

Dov Bensimon, Summer 2020
We met with Dov to discuss his work and career and of course, to ask some silly questions :)
Conventional Questions
- What was your career path like? Did you always know you wanted to work in this field?
- What originally got you interested in your current field of work?
- Can you tell us more about the Volcanic Ash Advisory Centre in Montreal?
- What does a typical day look like for you?
- What is the most challenging part of your job or day?
- What is your favourite part of the workday?
- Can you tell us anything about some of the projects you are currently working on?
- Any advice for budding climate scientists/meteorologists?
- Favourite Season?
- Favourite Cloud Type?
- If you could have a super power, what would it be?
- If you could go back to anytime in history, where would you go?
- Sweet or Savoury?
- Cats or Dogs
- Star Trek or Star Wars?
- Favourite Animal?
- If you could be a mythical creature (unicorn, phoenix, etc.) which one would you be?
Dov Bensimon has always known what he wanted to do since he was a child. He notes that around grade 4 he was at school one day when a thunderstorm rolled overhead, causing the classroom to get so dark that lights were needed in the middle of the day in May. “It really made an impression on me… that nature is incredibly powerful,” he stated, noting that the experience fascinated him and made him want to know more. From that moment on it was “crystal clear” what he wanted to do in the future. Most meteorologists Bensimon’s spoken to since didn’t have this experience of certainty: “I discovered to my surprise that I am one of only a few meteorologists in Canada who knew that they wanted to do this ever since I was a kid.”
As a result, Bensimon focused on courses in high school that consisted of higher level maths and sciences and in CEGEP pursued an applied science program, knowing that both were needed to continue his pursuit towards meteorology and becoming a weather forecaster.
For university, wanting to stay in the city, his choice was easy: McGill had the only undergraduate degree in meteorology through the Department of Meteorology (now the Department of Atmospheric and Oceanic Sciences). At the time McGill asked for your top three choices for your program of study and he notes that he “remember[s] putting meteorology first and then I couldn’t come up with a number two or three. [I] had no interest in anything else, it was either that or nothing at all.”
When he graduated with a Bachelor of Science in Meteorology in 1994, his original plan was to work as a forecaster and specifically with the Canadian government but the economy wasn’t great at the time. “It was a choice of either looking for work in the field outside of Montreal or Canada or continuing [my] studies.” After consideration, he pursued a Masters in Atmospheric and Oceanic Sciences at McGill, and once he graduated he started working at the Weather Network as an operational meteorologist. He would remain in this position for three years before shifting to work with Environment Canada (now Environment and Climate Change Canada, ECCC) in 1999.
Since then he has worked in various roles for ECCC as an operational meteorologist at the Canadian Meteorological Centre (now called the Canadian Centre for Meteorological and Environment Prediction, CCMEP). This includes working in the Implementation and Operational Services Section, the Analysis and Prognosis Section, and since 2009 Bensimon has been with the Environmental Emergency Response Section, which is tasked with responding to a number of different kinds of emergencies in the environment. As part of this work he has been the manager of the Montreal Volcanic Ash Advisory Centre (VAAC) since 2013.
While as a forecaster, he notes that “in the years that I did it I really enjoyed analyzing what was going on in the weather and then figuring out what would happen and then be able to deliver that information to people.”
This background flowed nicely into working with the Analysis and Prognosis Section, where he put what he enjoyed most as a forecaster to work. When asked about whether he likes finding the information and tracking environmental events or informing those concerned most, he states that it’s the latter: “[It’s a] sense of how can I help other people in my job, knowing that through the tools I have, the knowledge I have...I can basically warn pilots of where not to fly - that is by far the most rewarding part of what I do…[There are a] lot of people behind the scenes to make sure a plane files and is safe and being part of a team that ensures that, helping people get to Point A to Point B in the safest way possible is the icing on the cake.”
In regards to becoming Manager of the VAAC, Bensimon notes that it was serendipity. He was on a day off when he received a call to come in as a volcano erupted in Alaska and it looked like the ash was heading into Canadain airspace. He was “new to the section, didn’t know much about the program [and] went in to help and just learned on the fly how to do that kind of forecast”. Following this event he was asked “how he did the forecast [and] one thing leads to another and the next time there was a volcanic ash event, people remembered...I worked the last one [and was] called to work the next.”
When shift work started to take its toll he went to work in the Environmental Emergency Response Section, which was also involved in running the VAAC, and through his previous experience and picking up other duties along the way, was the most knowledgeable when his colleague running the VAAC retired. He has held the position of VAAC Manager ever since.
The Montreal Volcanic Ash Advisory Centre (VAAC) is situated in Dorval out of the CCMEP office but Bensimon notes that it “can be run from anywhere… [all you need is] just a laptop and a good internet connection. Because part of our work is responding to emergencies….we have been able to work remotely for years. Actually when the pandemic hit, it was easy for me and my colleagues to work from home [as] we were already prepared.”
The VAAC has a team of roughly 20 people, with about 15 operational meteorologists and 5 who are not on shift but are trained responders and meteorologists who can help with environmental emergencies. “In a nutshell there are nine centres around the world whose job it is to monitor the atmosphere for volcanic ash,” he states, noting that airplanes and ash don’t mix and that their job is to ensure there continues to be no fatalities due to volcanic ash in the atmosphere.
Most of his time is dedicated to the VAAC, but the section he works in, the Environmental Emergency Response Section, is tasked with responding to a number of different kinds of emergencies in the environment, of which volcanic ash is only one event. “For example, if there is a fire that breaks out in a chemical factory. Firefighters arrive on scene, they see that there are toxic gases coming out of the factory. [They] have to make a decision - do we evacuate people who live in the neighbourhood? How far is the evacuation order that we issue? Do we tell people to stay inside?
Essentially we have models that can simulate the release of pollutants in the environment, mostly air but also water as well. Simulations allow us to track the expected trajectory [and we can] provide that information to the people in the field to allow them to make decisions of what to do.”
A typical day depends on the event; if specifically an event occurs due to volcanic ash, Bensimon’s day would include looking at satellite images to see where it is, and “once we know where it is we will do simulations of whatever volcano it came out of so we…[can] put out products, forecasts to see where it is next going to be, in the next 18 hours”.
Events are rare though, and instead of responding, work focuses on improving response time and modelling simulations.
“A lot of times the work we do in our section when we are not in emergencies, a lot of it is doing legwork to make sure we are prepared to do it. That can take many forms, can take the form of trying to improve models that we have, that represent processes that go on when there is an environmental event. It can be coordinating with other centers to make sure they are doing things the same way. Part of it is also participating in exercises and tests we do on our own or with other centres… To respond to something when it’s real, means you have to practice a lot.”
Bensimon agrees that during the emergency times, when an event is occurring and a response is needed, it is challenging as the team needs to get the product of their models to those who need it, ensuring that the data they’ve contributed to the model in the end helps improve the output.
“In terms of the science, getting enough information about what is going on initially so that you know that your forecast that you’re developing is solid enough to deliver to someone - that is the biggest challenge. With any model we have a saying ‘garbage in, garbage out’ - if you don’t put good quality data into the model you’re not going to get good information out of the model.”
In addition, he remarks on the stress, stating a “certain amount of stress and learning how to deal with that when you get called. We have time constraints too and we can’t just say we will put out a product tomorrow - we have deadlines - that adds stress to the job. It [does make] it interesting at the same time.”
Rather than a favourite part of the workday, Bensimon has a favourite part of his job:
“The favourite part of my job is being able to deliver good quality and useful information to people who are going to make decisions based on it. Whether it is a weather forecast to plan out a family activity or a volcanic ash forecast to give airlines the best information I can to try to help plan where to fly their planes, that feeling of satisfaction that I am delivering useful information at the end of the day, [that’s] the most rewarding part of the job.”
“Details are still being worked out, but the forecasts that we do for volcanic ash are qualitative. So basically when we come up with these forecasts we delineate areas where we believe volcanic ash will be present and we just tell airlines, at this time here is where we expect volcanic ash to be. But we don’t say anything about how much ash will be there. What we’re trying to do worldwide now is to come up with a quantitative forecast of volcanic ash. It’s an easy concept but details and saying how can we do this in a consistent way across the world and deliver high quality product to our clients, is not so easy.”
Bensimon recommends in regards to academics to take as many maths and physics courses as you can when pursuing a future in meteorology. In CEGEP, a pure applied science program is what you would follow and then once in university enrolling in an undergraduate degree in atmospheric sciences. “It’s only [when you’re working in the field] or [in] graduate studies you look at specializing in sub-domains”, he states.
He also notes that it’s important to be aware of the working conditions when working as a meteorologist. Working in shifts is a large part of the work schedule and “people coming out of school need to be aware and won’t necessarily know how they handle shift work.” While there isn’t any internship program in meteorology that he is currently aware of, it would be a good idea to get a sense of the job through volunteering or an internship if you are able to find an opportunity to do so.
And above all, Bensimon states,
“Follow your dreams. If you are really interested in meteorology and climatology then pursue it. No matter what you end up doing as a career or a job if you don’t enjoy it you’re going to find the time very long, you know. It’s really important for people to pursue what they’re interested in. If it's a passion you are going to enjoy it.”
Unconventional Questions
“I like the fall. Not too hot, not too cold. It’s the sweet spot in between.”
“Cumulus clouds. So those are the ones that have flat bases that are fluffy - they look like pieces of popcorn or cauliflower. I like them because I mean, they’re nice clouds, they’re attractive clouds to look at, but they also tell a lot about how the atmosphere works. They form because the sun starts to heat the surface of the earth and as it heats the air closest to the surface of the earth, that air becomes less dense as it's heated and begins to rise. While it’s rising it's also cooling because it's surrounded by air that’s gradually colder… so as it’s cooling you start to get condensation happening and so the water vapor that’s in the air that is invisible starts to condense and forms the cloud. Just the form of the cloud tells you about what level you reach condensation at (the base) but then the fact that the top of the cloud is a puffy mound indicates that the air is rising. So when I look at that I always think of the mechanics behind how they form and, of course, they are pretty to look at and make all sorts of interesting shapes.”
“To be able to recall or remember anything at any point in my life would be very helpful.”
“I am a fan of history and born and raised in Montreal and the history of Montreal particularly interests me, and one thing I’ve been always interested and curious about would be to go back to pre-European times and see what did the island of Montreal looked like 500, 600 years ago...Really, really interested to know what the island of Montreal looked like before a lot of people came along and we started changing what it looks like.”
“Sweet, for sure. I don’t have just one sweet tooth, it's a whole mouth full.”
“I don’t have either and I‘ve never had pets really, but I like all animals so I like both equally.”
“Star Wars for sure. For Star Wars movies, I really like the original three [and while] the three in the 2000s I didn’t get into at all... the last three made in the past few years, I think were even better than the originals.”
“I don’t know why, but as a kid I really liked hippopotamuses.”
“You know, so I read that question, I didn’t know how to answer it and so I had a conversation with my twelve year old daughter about it. ‘What should I answer?’ and she said ‘a banana’. I said, ‘a banana is not a mythical creature’ and she goes, ‘well it could be!’ I said to her: ‘OK, I’ll give it as an answer but I don't know what sort of mythical creature a banana would be’.”
Interested in learning more about what was discussed during this interview? Check out the following links!
- Environment and Climate Change Canada (ECCC)
- Canadian Meteorological Centre
- Montreal Volcanic Ash Advisory Centre (VAAC)
- McGill Department of Atmospheric and Oceanic Sciences (AOS)
Disinfecting with Ozone in Pandemics: A 19th-century Idea comes back for Covid-19
I read an article the other day suggesting the use of low levels of ozone to disinfect airborne coronavirus particles. A search suggests a Saskatchewan company was already producing ozone decontamination units back in Mayand research articles investigating ozone as a surface disinfectant for viruses go back at least a decade (Tseng, Chun-Chieh & Li, Chihshan. (2008). Inactivation of surface viruses by gaseous Ozone. Journal of environmental health. 70. 56-62. ). There may be some technical difficulties - balancing a sufficiently high concentration of ozone to be lethal to the virus without it becoming toxic to humans - but this revival of a 19th century medical preoccupation caught my interest.
Ozone is an allotrope of oxygen, usually found in the stratosphere where it protects us from much of the Sun’s UV radiation. An allotrope, you may vaguely remember from Grade 10 chemistry, is an alternate form of a chemical molecule. Oxygen gas, the kind we usually breathe in from the atmosphere around us, is almost always formed of two oxygen molecules bound together; ozone is a rarer form of oxygen gas formed when three oxygen molecules bind together. Anyone who’s ever done any photocopying - another vanishing technology - will recognize the smell of ozone from that sharp, slightly acrid smell that arises from running a photocopier machine.
Ozone was first described by Christian Schönbein in 1839. As I described in Climate in the Age of Empire, even before its chemical properties were fully discovered, it was recognized as an antioxidant, a bleaching agent and thus a disinfectant. It was this disinfectant potential that made ozone interesting to Dr Charles Smallwood, founder of the McGill Observatory. The connection between atmospheric ozone and prevalent diseases became one of his main topics of investigation.
Pandemics were rife throughout the highly interconnected 19th century world, cholera being the most deadly and most feared, with typhus not far behind. Before Louis Pasteur isolated microbial pathogens and developed germ theory towards the end of the 19th century, the transmission agents of these pandemic diseases were not clearly understood, through the pioneering geomedical work of Dr John Snow in 1854 made cholera understood as a disease transmitted through water, not miasma or “bad air” (“malaria”) as was commonly thought at the time.
Smallwood thought ozone could be a key to fighting the pandemics, and measured ozone not only as a part of his routine daily meteorological observations but also in a variety of settings: in sickrooms, in gardens, over drains (ozone has been used in wastewater and sewage treatment for several decades), at ground level, 80 feet in the feet, next to diseased plants and around decaying animal and vegetable matter. He measured ozone levels using strips of paper or calico coated with a starch and potassium iodide solution, which turned blue in the presence of ozone: the darker the blue, the higher the concentration of ozone. He placed his strips among potato plants during an episode of potato blight, and tracked atmospheric ozone levels during typhus and cholera outbreaks. Smallwood’s measurements showed the levels of ozone in Montreal were exceptionally low during the 1854 cholera epidemic. Cautious scientist that he was, Smallwood noted that it was also a dry year, so it wasn’t possible to conclusively point to the low levels of ozone as a sole atmospheric determinant of disease, and more observations, preferably global ones, were needed. Again, words we’re still repeating a century and a half later.
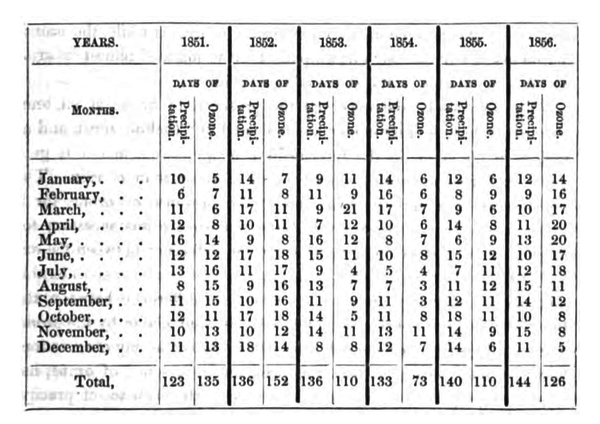
“On Ozone”, Charles Smallwood. Proceedings of the American Association for the Advancement of Science, 1858
Ozone concentrations were seen to be higher near the sea, one reason why many hospitals and health stations were built near the seaside during the 19th century. Today there are still in some countries specialized hospital towns in coastal regions.
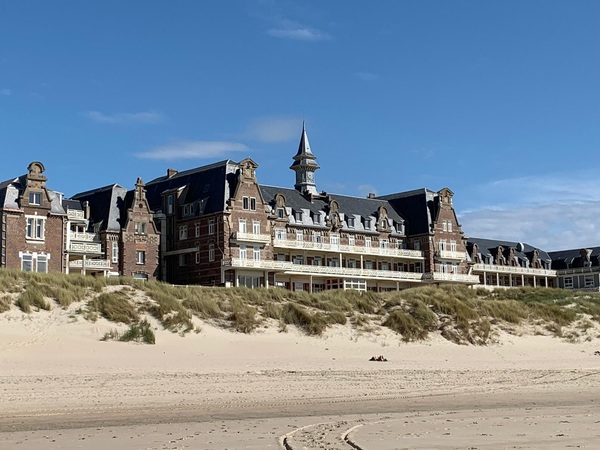
Institut Calot, Berck-sur-Mer, France. Notice the wide windows and balconies facing the sea. Photo credit: Isabelle Hacot
Berck-sur-Mer is a seaside hospital town in northern France, the setting of the book and film le Scaphandre et le Papillon (The Diving Bell and the Butterfly)
Today, facing another global pandemic over a century and a half later, we’re once again looking into the disinfectant properties of ozone. But our Victorian forebears got there first.
Weather and Poetry: E. Pauline Johnson
Welcome to DRAW's latest series: Weather and Poetry! Here we will explore poets who touch on weather in their works. This week we are looking at Canadian poet E. Pauline Johnson.
E. Pauline Johnson

This image is available from Library and Archives Canada under the reproduction reference number C-085125 and under the MIKAN ID number 3194762.
Emily Pauline Johnson (March 10 1861-March 7 1913) was a Canadian poet, author and performer who was popular in the late 19th and early 20th centuries. Her father was a hereditary Mohawk chief of mixed ancestry from Brantford, Ontario and her mother was an English immigrant.
She was stylized as E. Pauline Johnson and was also known as Tekahionwake (pronounced dageh-eeon-wageh meaning “double-life”). Johnson was notable for her poems, short stories and performances that celebrated her mixed-race heritage drawing from both Indigenous and English influences.
Check out the following to learn more about E. Pauline Johnson:
- Wikipedia - E. Pauline Johnson
- Dictionary of Canadian Biography - Emily Pauline Johnson
- The Canadian Encyclopedia - Pauline Johnson (Tekahionwake) by Amanda Robinson
Here are a selection of books by or about E. Pauline Johnson:
- Buckskin and Broadcloth: A Celebration of E. Pauline Johnson - Tekahionwake, 1861-1913 by Sheila M.F. Johnston
- Flint and Feather: The Complete Poems by E. Pauline Johnson
- Tekahionwake: E. Pauline Johnson's Writings on Native North America by E. Pauline Johnson, Margaret Fee (Editor)
- Flint and Feather: The Life and Times of E. Pauline Johnson, Tekahionwake by Charlotte Gray
- Legends of Vancouver by E. Pauline Johnson, Robin Laurence
Poems
Shown here are poems from Flint and Feather (1912) that touch on weather, particularly wind, rain, storms, mist, sunsets and clouds.
The Song my Paddle Sings
West wind, blow from your prairie nest
Blow from the mountains, blow from the west
The sail is idle, the sailor too;
O! wind of the west, we wait for you.
Blow, blow!
I have wooed you so,
But never a favour you bestow.
You rock your cradle the hills between,
But scorn to notice by white lateen.
I stow the sail, unship the mast:
I wooed you long but my wooing’s past;
My paddle will lull you into rest.
O! drowsy wind of the drowsy west,
Sleep, sleep,
By your mountain steep,
Or down where the prairie grasses sweep!
Now fold in slumber your laggard wings,
For soft is the song my paddle sings.
August is laughing across the sky,
Laughing while paddle, canoe and I,
Drift, drift,
Where the hills uplift
On either side of the current swift.
The river rolls in its rocky bed;
My paddle is plying its way ahead;
Dip, dip,
While the waters flip
In foam as over their breast we slip.
And oh, the river runs swifter now;
The eddies circle about my bow.
Swirl, swirl!
How the ripples curl
In many a dangerous pool awhirl!
And forward far the rapids roar,
Fretting their margin for evermore.
Dash, dash,
With a mighty crash,
They seethe, and boil, and bound, and splash.
Be strong, O paddle! be brave, canoe!
The reckless waves you must plunge into.
Reel, reel.
On your trembling keel,
But never a fear my craft will feel.
We’ve raced the rapid, we’re far ahead!
The river slips through its silent bed.
Sway, sway,
As the bubbles spray
And fall in tinkling tunes away.
And up on the hills against the sky,
A fir tree rocking its lullaby,
Swings, swings,
Its emerald wings,
Swelling the song that my paddle sings.
Erie Waters
A dash of yellow sand,
Wind-scattered and sun-tanned;
Some waves that curl and cream along the margin of the strand;
And, creeping close to these
Long shores that lounge at ease,
Old Erie rocks and ripples to a fresh sou’-western breeze.
A sky of blue and grey;
Some stormy clouds that play
At scurrying up with ragged edge, then laughing blow away,
Just leaving in their trail
Some snatches of a gale;
To whistling summer winds we lift a single daring sail.
O! wind so sweet and swift
O! danger-freighted gift
Bestowed on Erie with her waves that foam and fall and lift,
We laugh in your wild face,
And break into a race
With flying clouds and tossing gulls that weave and interlace.
Rainfall
From out the west, where darkling storm-clouds float,
The ‘waking wind pipes soft its rising note.
From out the west, o’erhung with fringes grey,
The wind preludes with sighs its roundelay.
Then blowing, singing, piping, laughing loud,
It scurries on before the grey storm-cloud;
Across the hollow and along the hill
It whips and whirls among the maples, till
With bough upbeat, and green of leaves blown wide,
The silver shines upon their underside.
A gusty freshening of humid air,
With showers laden, and with fragrance rare;
And now a little sprinkle, with a dash
Of great cool drops that fall with sudden splash;
Then over field and hollow, grass and grain,
The loud, crisp whiteness of the nearing rain.
At Sunset
To-night the west o’er-brims with warmest dyes;
Its chalice overflows
With pools of purple colouring the skies,
Flood with gold and rose;
And some hot soul seems throbbing close to mine,
As sinks the sun within that world of wine.
I seem to hear a bar of music float
And swoon into the west;
My ear can scarcely catch the whispered note,
But something in my breast
Blends with that strain, till both accord in one,
As cloud and colour blend at set of sun.
And twilight comes with grey and restful eyes,
As ashes follow flame.
But O! I heard a voice from those rich skies
Call tenderly my name;
It was as if some priestly fingers stole
In benedictions o’er my lonely soul.
I know now why, but all my being longed
And leapt at that sweet call;
My heart outreached its arms, all passion thronged
And beat against Fate’s wall,
Crying in utter homesickness to be
Near to a heart that loves and leans to me.
The Sleeping Giant (Thunder Bay, Lake Superior)
When did you sink to your dreamless sleep
Out there in your thunder bed?
Where the tempests sweep,
And the waters leap,
And the storms rage overhead.
Were you lying there on your couch alone
Ere Egypt and Rome were born?
Ere the Age of Stone,
Or the world had known
The Man with the Crown of Thorn.
The winds screech down from the open west,
And the thunders beat and break
On the amethyst
Of your rugged breast, -
But you never arise or wake.
You have locked your past, and you keep the key
In your heart ‘neath the westing sun,
Where the mighty sea
And its shores will be
Storm-swept till the world is done.
Lady Icicle
Little Lady Icicle is dreaming in the north-land
And gleaming in the north-land, her pillow all a-glow
For the frost has come and found her
With an ermine robe around her
Where little Lady Icicle lies dreaming in the snow.
Little Lady Icicle is waking in the north-land,
And shaking in the north-land her pillow to and fro;
And the hurricane a-skirling
Sends the feathers all a-whirling
Where little Lady Icicle is waking in the snow.
Little Lady Icicle is laughing in the north-land,
And quaffing in the north-land her wines that over-flow;
All the lakes and rivers crusting
That her finger-tips are dusting,
Where little Lady Icicle is laughing in the snow.
Little Lady Icicle is singing in the north-land,
And bringing from the north-land a music wild and low;
And the fairies watch and listen
Where her silver slippers glisten,
As little Lady Icicle goes singing through the snow.
Little Lady Icicle is coming from the north-land,
Benumbing all the north-land where’er her feet may go;
With a fringe of frost before her
And a crystal garment o’er her,
Little Lady Icicle is coming with the snow.
The Lifting of the Mist
All the long day the vapours played
At blindfold in the city streets,
Their elfin fingers caught and stayed
The sunbeams, as they wound their sheets
Into a filmy barricade
‘Twixt earth and where the sunlight beats.
A vagrant band of mischiefs these,
With wings of grey and cobweb gown;
They live along the edge of seas,
And creeping out on foot of down,
They chase and frolic, frisk and tease
At blind-man’s buff with all the town.
And when at eventide the sun
Breaks with a glory through their grey,
The vapour-fairies, one by one,
Outspread their wings and float away
In clouds of colouring, that run
Wine-like along the rim of day.
Athwart the beauty and the breast
Of purpling airs they twirl and twist,
Then float way to some far rest,
Leaving the skies all colour-kiss’t -
A glorious and a golden West
That greets the Lifting of the Mist.
Be sure to keep a lookout for the next Weather and Poetry instalment and if you have any suggestions let us know!
Montreal as an Island
The spring ice break up season was always a tricky time for Montrealers. Unless you live off-island, we tend not to think too much about the practical geographical fact of the city Montreal as an island in the St Lawrence River these days. When the dire condition of the old Champlain bridge was realized and plans for the building of the new bridge were being drawn up, there was a fair amount of grumbling opinion along the lines of “I never leave the island; why should my taxes pay for all those suburbanites coming into the city?” The Champlain bridge is a vital piece of Canadian infrastructure linking the Atlantic provinces, Eastern Canada and the US to central Canada, and the most heavily travelled bridge in the country. As Montreal is an island, it has always needed goods and supplies brought in across the river. Electricity too: for those who remember the 1998 ice storm, they might also remember that at one point only one of the power lines supplying the city across the water was still functioning.
Until the Victoria railway bridge was opened in 1859, there was no permanent link across the St Lawrence to Montreal, and it wasn’t until the Jacques-Cartier bridge was opened in 1934 that there was a permanent crossing for pedestrians and carts or cars. In summer, boats and ferries supplied the city, from as near as Longueuil or as far away as Europe.
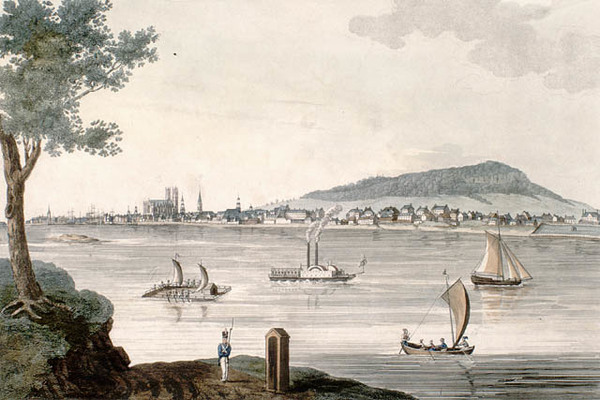
View of Montreal from St Helen’s Island c.1830. Steam boats and sail boats ferry passengers across the Saint Lawrence. (Library and Archives Canada, MIKAN 2837606)
In winter, ice roads across the frozen river went to Longueuil, St Lambert and LaPrairie. Some years there were disputes as to which town was responsible for maintaining the ice road (which seemed to devolve into complaints about who had shovelled the most snow).
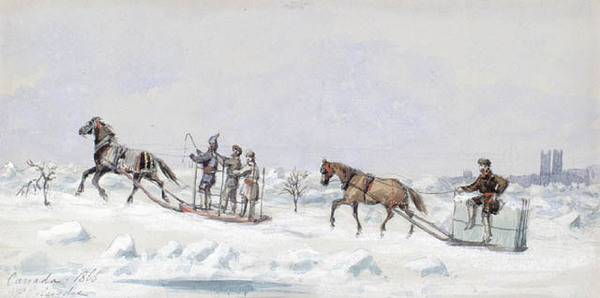
Transporting blocks of ice cut from the River for summer cooling, 1866 (Library and Archives Canada, MIKAN 2897892)
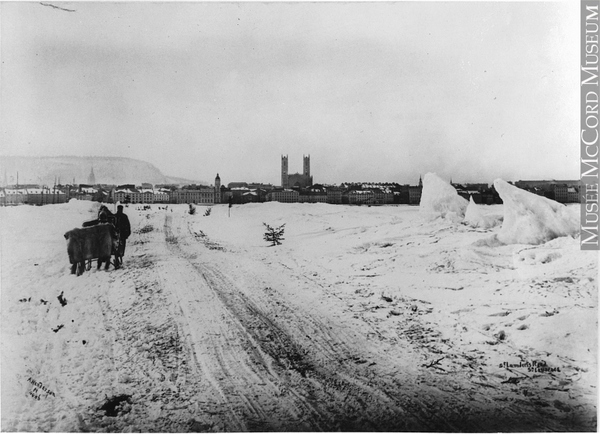
St. Lambert's Road, Montreal, QC, about 1870 (Alexander Henderson about 1870, 19th century MP-0000.1452.59, McCord Museum)
The worst times were during the freeze up and break-up of river ice. During the early winter and spring the river was too dangerous to cross and Montreal was cut-off from the rest of the continent. People either pushed the limits of boats amid the currents and ice floes or of their sleds on melting ice, risking their lives on the deceptively solid surface. Every few years, there were tragedies; on Dec 4, 1831 John Samuel McCord recorded that “Captain Perry, late of Waterloo, drowned crossing from Longueuil to Montreal.” Weather Journal of J.S.McCord, McCord Museum Archives.
Breaking Up of the Ice in the St. Lawrence at Montreal. 1864 (Library and Archives Canada, 2838636)
It’s no wonder that Montrealers, including our weather observers, anxiously watched the state of the river. Not only was the river critical to the transport of goods and people, the annual spring break up also often led to catastrophic flooding, something still familiar to us in the 21st century. But there’s enough about flooding to be the topic of another blog post (or ten).
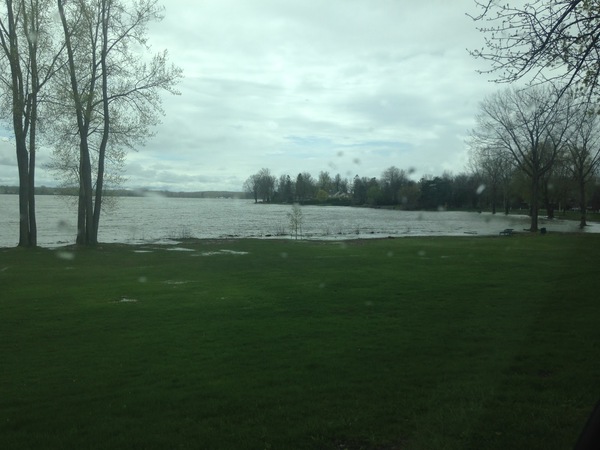
Flooding on the southwestern shore of Montreal, Spring 2018 (V. Slonosky)
Meet the Meteorologists: Quebec City
Today we are kicking off a new series on the blog: Meet the Meteorologists! Our aim is to look at the individuals around the world who helped to contribute to the creation of meteorology as a field of study and who helped inform the practice here in Montreal.
These individuals were often interested in weather as how it connected to their day jobs. They were often the intellectuals, religious figures, engineers, doctors or businessmen in communities and helped contribute to our understanding of weather in the St. Lawrence basin where Montreal resides. All individuals mentioned in this series were taken from Climate in the Age of Empire by Dr. Victoria Slonosky.
So let’s kick things off with New France and the people who called Quebec City home.
Jean-François Gaultier (1706-1756)
Gaultier was born in Rouen, Normandy, in northern France and educated in medicine in Paris, where he came into contact with some of the most renowned botanists and natural philosophers of his day at the Jardin du Roi, where medical students were instructed in the therapeutic uses of plants. These connections, notably to the Jussieu brothers and Duhamel Dumonceau, helped him obtain the prestigious appointment of royal physician in Quebec City from 1742 to 1756. He was the first person to keep systematic instrumental meteorological observations in Canada. Detailed records were sent every year to his correspondents at the Academie Royale des Sciences. Gaultier’s temperature observations, especially of the cold winter temperatures in Canada, were of crucial importance to the development of thermometers in the eighteenth century (Boivin 1974).
Learn more:
- The Meteorological Observations of Jean-François Gaultier, Quebec, Canada: 1742-56, by Victoria Slonosky
- Répertoire du patrimonie culturel du Québec: Jean-François Gaultier
- The Canadian Encyclopedia: Jean-François Gaultier
- Dictionary of Canadian Biography: English French
James Thompson (1733-1830)
Thompson studied civil engineering at some point in this youth. He participated in the siege of Louisberg and the capture of Quebec in 1759/ He supervised repairs and dealt with military and government construction for all of the British colony of Canada until 1825. During the 1770s and 1780s, he kept a diary in which he noted down the weather and how it affected his civil engineering works (Rioux 2003, Chapman and McCulloch 2010).
Learn more:
- Dictionary of Canadian Biography: James Thompson
- A Bard of Wolfe's Army HC: James Thompson, Gentleman Volunteer 1733-1830
Alexander Spark (1762-1819)
Spark was a Scottish clergyman who founded the first Presbyterian Church in Canada: St. Andrew’s in Quebec City. A product of the Scottish Enlightenment, Spark did much to promote education in Canada. He kept meteorological records from 1789 to 1819 (Campbell 1887, Lambert 1983, 1984).
Learn more:
- Dictionary of Canadian Biography: Alexander Spark
- Répertoire du patrimonie culturel du Québec: Alexander Spark
Louis-Édouard Glackmeyer (1793-1881)
Glackmeyer was a notary in the Quebec City region whose records cover the 1844 to 1859 period. His father had been a bandmaster from Germany who settled in Quebec in 1776. Glackmeyer was politically active and did much to reform the profession of notaries. He was interested in music and botany as well as meteorology (Vachon 1982).
Learn more:
- Louis-Édouard Glackmeyer, Portrait
- Dictionary of Canadian Biography: Louis-Édouard Glackmeyer
- Wikipedia: Louis-Édouard Glackmeyer
William Ward, Royal Engineers (unknown-1867)
William Cuthbert Ward served in the Napoleonic Wars. He was promoted to lieutenant colonel in 1837, to colonel in 1851, and to major general in 1858. Ward was the senior engineering officer in York (Toronto) during the construction of the Toronto Observatory and later was the senior officer in charge of meteorological observations in Quebec City (Royal Engineers 2016).
This wraps up our first look at meteorologists which helped to shape the field of meteorology and the creation of our own ledgers. Tune in next time for a look at the individuals who called Montreal home!
Introducing DRAW Members: Drew Bush
Introducing…
Who:
Drew Bush
From:
Lyndonville, Vermont
Role at DRAW:
Education Team Member
Favourite part of DRAW?
Favourite Season?
All of them (as long as I get to be outdoors)
Favourite Weather Symbol?
Snow

Favourite Cloud Type? Why?
Cirrus, the wispiness is cool
Coolest thing you’ve learned while participating in DRAW?
About Charles Smallwood, the founder of the McGill Observatory
And of Course:
Sweet or Salty?
Salty
Cats or Dogs?
Dogs
Favourite Animal?
Dog
Favourite place in Montreal?
Chinatown/Place des Arts
Learn more about Drew here:
- Personal Website
- SALTISE Profile
- McGill Academia Profile
- Research Gate Profile
- Linked In Profile
- EarthSky - Clouds that look like ocean waves
- Wikipedia - Kelvin-Helmholtz Instability
- UCAR Centre for Science Education - Kelvin Helmholtz Clouds
- ThoughtCo - What are clouds that look like breaking waves?
- MetOffice - Kelvin-Helmholtz cloud
- CBS News - Freak hailstorm dumps up to 6 feet of ice on Guadalajara, Mexico
- Meteorological and Environmental Factors Contributing to Hail Glaciers on the Southern High Plains - PDF
- NBC News - Freak hailstorm that hit Mexico city has a surprising explanation
- WDRB - Throwback Thursday: Giant Hail Glaciers...
- Wikipedia - Fallstreak hole
- National Weather Service - Fallstreak - What Are They?
- Skybrary - Fallstreak Hole
- Cloud appreciation society - a new understanding of fallstreak holes
- Some thoughts on fallstreak holes by David E. Pedgley
- Science Alert - Meet Nature's Strange, Self-Rolling Snow Doughnuts
- Wikipedia - Snow roller
- NPR - Snow Doughnuts Are the Real Thing
- The Seattle Times - A rare treat from nature: Perfect snow doughnuts
- Citylab - Idaho Is Visited by Extremely Rare Snow Doughnuts
- Wikipedia - Morning Glory Cloud
- UCSB Geography - Morning Glory Clouds
- Higgins Storm Chasing - Morning Glory Clouds explained
- Morning Glory: Australia's Rare Meteorological Phenomenon
- Amusing Planet - The Morning Glory Clouds of Australia
- Wikipedia - Thundersnow
- ScienceNews for Students - Explainer: What is thunder snow?
- Global News - Thundersnow: why it happens and how it forms
- Let's Talk Science - Thunderstnow: winter thunderstorm
- Wikipedia - Lenticular cloud
- EarthSky - Lenticular clouds look like UFOs
- Met Office - Lenticular clouds
- Skybrary - Lenticular Cloud
- National Weather Service - Altocumulus Standing Lenticular Clouds
- Wikipedia - Block (meteorology)
- Climate Signals - Atmospheric Blocking
- Atmospheric Blocking
- The Irish News - What is atmospheric blocking and is it responsible for the current heatwave?
- Wikipedia - St. Elmo's Fire
- St. Elmo's Fire
- St. Elmo's Fire - Causes
- Washington Post - St. Elmo's Fire
- What Causes St. Elmo's Fire
- How Rare are Twin Tornadoes?
- The Science behind the twin tornadoes in Nebraska
- Twin Tornadoes spotted in Oklahoma
- How a Storm gave birth twin tornadoes
- Scientific American - Ball Lightning
- Wikipedia - Ball Lightning
- National Geographic - Ball Lightning
- Rare Hurricane like medicane strike Egypt and Israel
- What is a medicane?
- Medicane
- Mediterranean tropical like cyclone
- Leaf Cutter Designs - Sky Scarf Kit
- Weather Network: Knit the Sky Temperature Scarf Goes Viral
- Sleeping Dog Quilts Blog Post: Sky Scarf
- Yarnchick Blog Post
- Knitting Squirrel Blog Post: The Sky Scarf
- The archivist(s) are your best friends! Always be sure to contact the archive before your first day of research. This is important for a number of reasons, including ensuring the documents you want to look at are accessible. And often archivists can recommend other fonds that may be relevant to your research.
- Enquire about copyright restrictions. Are you able to take photographs of the documents, can they be scanned, and what use restrictions (if any) do the documents have.
- If you are able to take your own images: take an image of the file number of the folder to keep track of where subsequent images are from or keep detailed notes! It will save you time later when you need to create references.
- Eat and drink before your visit. Food and drinks are not allowed in archives and special collections as they could accidentally be spilled and ruin unique documents.
- Have fun!
- Persistence – What the weather is today to determine the weather tomorrow
- Barometer – Has the pressure suddenly changed? Might be rain or clear skies!
- Sky Observations – Certain clouds can indicate rain is coming
- Analog Technique – A complex prediction where a previous weather event is compared to an upcoming similar event to explain what might happen. This often happens for storms
- How training can reduce errors in citizen science projects (2015)
- How to improve the process of citizen science engagement (2016)
- Testing validity concerns surrounding the transcription of citizen scientists vs. professionals (2017)
- Testing if the transcribed data to date is fit for use (2018)
- The First World War has been over for a year, with Canada signing the Treaty of Versailles over the summer to make it official
- Influenza is running rampant and Alberta experiences an epidemic
- In May, the Winnipeg General Strike begins
- The Canadian National Railway is formed
- Pierre Elliott Trudeau is born, and William Osler passes away
- The Unionist Party is in charge federally and the Liberals are the official opposition
- On the global scale, Russia is in the midst of a civil war
- The United States officially bans alcohol beginning Prohibition
- And the League of Nations is founded in January
- McGill Remembers Project
- How World War I Changed Weather Forecasting for Good
- Meteorology Report in World War One
- Military Meteorology(mostly USA examples)
- Meteorology in War
- D-Day: How Meteorologists Helped Win the War
- Women in Meteorology in Canada: The Early Days
- The Aeronauts film
- Joseph Louis Gay-Lussac
- Meteorological Observations and Essays by John Dalton
- Jean-Baptiste Biot
- Science History Institute of Philadelphia
- To conduct research
- UX, UI Design
- Translating goals of the project into software architecture
- Part of the interdisciplinary glue of DRAW (Geography) - the value is to advance all fields, no one is treated like a technician, we encourage people to explore what is researchable at the outer limits of their discipline
If you find something you can’t read - don’t panic!
Check the resources available
Look for clues on the page - words/letters/numbers
Spelling
Ask for help
- Historical Canadian Climate Data
- Climate in the Age of Empire by V. Slonosky
- Interview with Vicky by Hans von Storch
- Marginalia as note taking
- The Marginal Obsession with Marginalia (New Yorker)
- Doodles in Medieval Manuscripts
- Strange Medieval Doodles
Keep checking out the blog to see more DRAW Member Introductions in the coming weeks alongside our usual content!
Heatwaves: Blasts from the Past
Heatwaves and cold snaps have always been a feature of Montreal and Quebec weather. Jean-François Gaultier (1708-1756), who was royal physician in Quebec City from 1742 to 1756, left vivid descriptions of heatwaves and hot summers in the mid-18th century, mentioning “les chaleurs excessives presque continuelles” (“the nearly continual excessive heat”; July 1746).
Answering questions like ‘Which was the hottest day or warmest summer on record?’ is not always straightforward when dealing with complicated historical data. Both mean temperature and maximum temperature need to be considered to provide a complete view of historical summer weather and heat waves.
The summers of 1807 and 1808 were extremely warm in Quebec City, for example, with the warmest summer known so far in the Saint Lawrence Valley region at an estimated mean temperature of 23.5°C occurring in 1808. It’s possible that 1807 was even warmer than 1808, but many observations are missing for the months of June and early July, when Alexander Spark, the Presbyterian clergyman who kept the weather diary for those years, moved house. For comparison, 1955 was the 4th warmest summer at 22.4 °C and 2018 the 7th warmest at 22.0 °C (all mean temperatures).
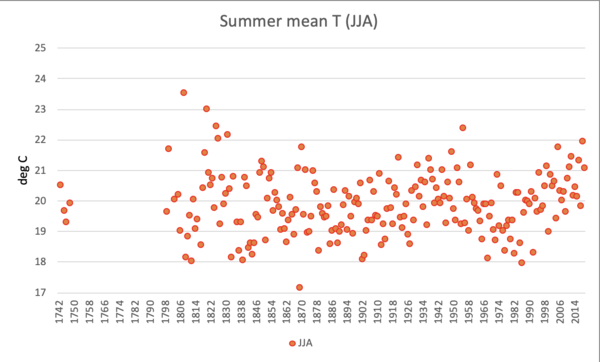
Looking at maximum temperatures for the months of June, July and August only, 1800 comes in at a scorching 29.3°C, 1808 at 28.4°C, 1955 in 7th place at 27.4°C and 2018 in 9th place at 27.04°C. The numbers from the early 1800s do have to be taken with a large pinch of salt, however; although some adjustments have been made to account for the different way the instruments were exposed, the observers were almost all men with other jobs. As a result, they weren’t often home during the day, so afternoon observations which were closest to maximum temperatures tend to be missing more often than the morning temperatures which were closest to the daily minimum. Looking at the more reliable daily minimum temperatures, the warmest summers were 1807 at 18.8°C followed by 1808 at 18.5°C, with 1955 in 5th place at 17.4°C and 2018 in 7th place at 16.9°C.
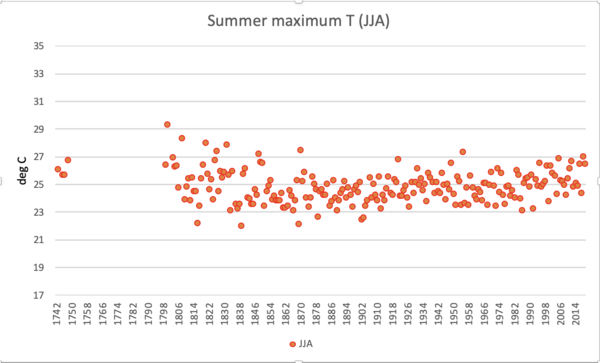
But what about heat waves during ‘normal’ summers?
In 1820 there were six separate heatwave events. For context, a ‘heat-wave’ is defined by consecutive days above 30°C. The first, lasting from June 23 to June 30 was preceded by three separate days (June 18, 19, and 23) at 30°C. Two heat waves hit from July 3-5, with readings of 36.7°C (98°F) at 1pm on July 3, and from July 7-9. The longest however was during the nine days lasting from July 23 to July 31. Although the afternoon temperatures weren’t extraordinarily warm, ranging a degree or two above 30°C, it didn’t seem to cool off at night with estimated minimum temperatures staying above 18°C. There were still a further two heatwaves that season (August 9-12 and September 7-11). On September 11 1820 the temperature hit 34.4°C (94°F). By September 21 the heatwaves were over and there was frost in the early morning.
And although 1868 doesn’t stand out in the statistical data as a very hot summer, it does have a surprising number of days with smoke recorded by John Bethune, an Anglican clergyman who kept a meteorological diary from 1838 to 1860, and two separate recorded heat waves. Going by Bethune’s weather records, the first lasted from July 1-4 and the second from July 9-14, although the temperature hovered around the 30°C mark until July 20th. The maximum temperatures recorded by Bethune for July 15 and July 18 came short of the official heat wave definition, clocking in at 29.4°C.
A look through the Montreal Gazette archives shows that the official definitions don’t always capture the whole story though. The summer of 1868 was hot and dry with forest fires burning throughout the region. Throughout the month of July, Gazette reporters kept a commentary on the heat and its effect on Montrealers. On July 14th, the city “seemed converted into a huge Turkish bath”. On July 16th, seven people were reported as having died of sunstroke or from the heat, and one person drowned. “The heat is not only fatal to man and beast but the trees and grass show signs of the terrible ordeal they are going through. The grass is crisp and brown and the trees.. are fast turning a sickly yellow”. On July 21, the lack of rain was causing cattle to suffer on farms, and the hay crop was feared to be in danger of being short.
The heatwaves of the 19th century mostly had to be endured before much of the public infrastructure we take for granted was developed: not only no electricity, but no running water, water fountains or public swimming pools. Efforts were made to keep the streets cool by sprinkling water on them but “so hot are the streets that the water sprinkled on them… at one end is dried up before the carts reach the other”. The Sanitary Association and a Dr. Carpenter opened up a free bathing place by having boards put up on the Lachine canal for “decency”, the Gazette reported approvingly on July 20, though “the sooner the bathers extract the broken bottles the better”. A thousand people a day were using the canal to cool off by the 23rd, when plans to open up a second free bathing spot in the eastern end of the city by the harbour was announced.

July 23rd, a welcome relief: “ALMOST COOL. Last night was the coolest night… for some time. When the expression coolest is used it means the beds were not as hot as pancakes, just fired, and the atmosphere not like a baker’s oven”. The last heat wave of 1868 broke by the 24th, but the trials of Montrealers were not over. Just as the heat broke, the city was engulfed in smoke from “numerous fires in the woods in the neighborhood”. Smoke from forest fires had been reported as surrounding Quebec City as early as July 20. “Great fires” were also reported to have been “raging for weeks” in the Ottawa region.

As the century progressed, public health authorities worked to open parks and pools to Montrealers, especially those of the work class who didn’t have easy access to running water or clean, private pools or lakes. Like Montrealers today, many visited parks to keep cool. Unlike today, residents were sometimes given permission to sleep in the parks at night to escape their “hot as pancakes” beds. As well as sleeping in parks, the Quebec Chronicle recorded residents sleeping on balconies, rooftops and in doorsteps. Wealthy citizens could leave the city for the country, which could mean Mount Royal in the early to mid 19th century, the West Island in the late 19th century and 20th century, or all the way to the lower Saint Lawrence for the upper classes.
What do you think of the heatwaves of yester years compared to those we are experiencing today? Could you survive without air conditioning, refrigeration and readily available swimming spaces? Let us know!
Measuring Humidity: A Long and Difficult Process
Why is it that some days it feels hotter than others? Or that we have difficulty breathing? It's all thanks to humidity, or water vapor in the air. This week let's dive into how humidity is measured.
Humidity has long been one of the most difficult atmospheric variables to measure objectively. Indeed, it took some time to recognize exactly what the role of water vapour was in the precipitation cycle, and it was in attempting to quantify just how precisely water vapour, humidity, clouds and precipitation were all related that John Dalton, a passionate meteorologist, became the discovery of atomic theory through his gas law of partial pressures and revolutionized chemistry.
For humidity, the measurement we really want to get at is the amount of water vapour contained in the air. However, because the amount of water vapour the air can contain is strongly dependent on temperature, another indicator we might find useful is how close the air is to saturation. When the air is completely saturated, it can’t contain any more water vapour and water starts to precipitate out in droplets, forming fog. Air which is very cold can contain very little water vapour and yet be close to saturation, and conversely warm air can contain a lot of water vapour and be nowhere near saturation. Relative humidity is a measure of how much water vapour the air actually contains compared to how much it could contain, given its temperature. The dew point is the temperature to which the air would have to be cooled in order for fog to start to form. Confused yet?
Early hygrometers attempted to measure the humidity directly by finding some material which responded to humidity and calibrating it. Hygrometers were made from anything from cotton to hair to metals, but making them reliable and, more importantly, inter-comparable from one instrument to another, was nearly impossible. Measuring the amount of water vapour in the air directly involves much time-consuming and complicated chemical manipulation.
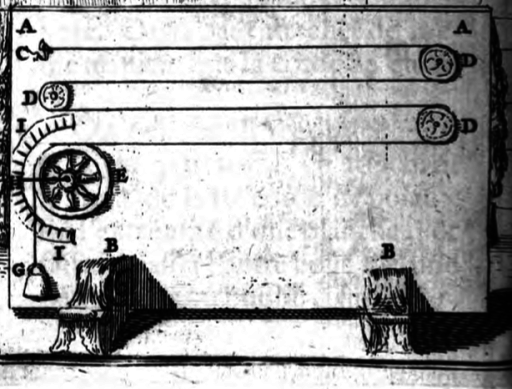
18th century hygrometer made of hemp fibre. From d’Alencé, Traittez des Barométres, Thermométres et Notiométres, 1707
One way of trying to get at the humidity of the air is through the dry and wet bulb thermometer. The dry bulb thermometer is just a regular air thermometer, but the wet bulb thermometer has a piece of cloth, usually cotton or linen, soaked in water and wrapped around the bulb of the thermometer. The thermometer is then whirled around until the temperature registered by the wet bulb thermometer stops falling. The principle behind this similar to the beads of water that form on the glass of a cold drink on a humid day: that the water in the cloth will evaporate into the surrounding air until the air surrounding the thermometer is saturated; it can’t hold any more water vapour.
Meanwhile, the amount of heat needed to evaporate the water from the cloth surrounding the wet bulb thermometer is recorded by the drop in temperature noted by the wet bulb thermometer compared to the dry bulb thermometer. Not all of the water from the cloth needs to be evaporated, just as much as the surrounding air can take in. If the surrounding air is already 100% saturated, and there is fog, no extra water can be evaporated from the wet bulb thermometer and the wet bulb and dry bulb thermometers will record the same temperatures. Look-up tables were used to find the values of the relative humidity and dew point from the wet and dry bulb thermometer readings.
Of course, a problem in Canada is what to do when the temperature is below freezing, and the water surrounding the wet bulb is frozen. According to the instructions sent out to all Canadian observers in 1878, a thin film of water on the wet bulb thermometer should be brushed onto the cloth to form as thin a film of ice as possible, while taking care that not too much ice should accumulate on the bulb of the thermometer.
Wet-bulb thermometers. From Instructions to Observers in the Canadian Meteorological Service, 1931.
Part of the behind-the-scenes work we’ve done here at DRAW is to match the transcription environment (the pop-up bar which floats on top of the image of the weather register sheet) to the data on the page, so that when you type in the data, you should have a matching box with a title in the transcription bar that matches the printed sheet. (If you find something that doesn’t match up, please let us know through email or the “Report a problem” sheet). Every time there’s a change in the layout of how the data appears on the page, we flag this as a new “register type” and set up a new transcription environment to match.
I hear you asking, “What does this have to do with humidity?” Well, in the 1910s, the humidity measurements changed layout five times in 18 months, as the observers experimented with hygrometers, wet and dry bulb thermometers, and other ways of capturing the humidity, sometimes adding in extra observations to the printed forms.
To this day, water vapour remains one of the most important, but most elusive, variables needed to understand weather and climate.
Rare Weather Phenomena - Part 2
As promised, today's blog post is a followup from last week. We'll be delving into rare weather phenomena connected to clouds and snow.
While snow and clouds are a common feature of our days, especially if you reside within Canada, the following phenomena are not often experienced by the everyday individual. The snow and cloud based rare weather seen in today's post need specific conditions to exist!
Kelvin-Helmholtz Clouds

Kelvin-Helmholtz clouds, named for Lord Kelvin and Hermann von Helmholtz, resemble a series of rolling waves in the sky. They often form on windy days when two adjacent layers of atmospheric air are moving at different speeds. This phenomenon is a good indicator of atmospheric instability and turbulence for aircraft. Kelvin-Helmholtz clouds are relatively short-lived but it is believed that this phenomenon is the inspiration behind Van Gogh's famous painting Starry Night.
For more information:
Hail Glaciers
Hail glaciers are large accumulations of hail that can stay frozen for some time after a storm. In New Mexico in 2004 a 15ft ice glacier formed along riverbanks following a summer hail storm and remained for nearly a month. Most recently this was documented in Mexico in June 2019, when six feet of ice buried the city, luckily causing no injuries to residents.
For more information:
Fallstreak Holes

Fallstreak holes, or hole-punch clouds, are elliptical holes that can appear in cirrocumulus or alto cumulus clouds. This phenomenon is caused when the water temperature of the clouds are below freezing, but the water has in fact not frozen yet. When ice crystals are introduced, the water quickly freeze and start to fall. It is thought that a plane flying through the clouds could trigger fallstreak holes, introducing ice crystals.
For more information:
Snow Doughnuts
Snow doughnuts, or snow rollers, are a completely natural rare meteorological spectacle that occurs under very specific weather conditions. When conditions are right (including a thin surface layer of snow, an under layer that is ice or powder snow, a wind that is strong enough to push but not destroy, and gravity) large cylindrical snowballs are formed. They can be super small, like a snowball made by you or me, or they could be as large (or larger!) as a car. This phenomenon can be experienced mostly in the open prairies of North America or some remote regions of Northern Europe.
For more information:
Morning Glory

Morning Glory clouds are occasionally observed in different locations around the world, but often form in the gulf of Carpentaria region of northeastern Australia and resemble elongated roll clouds. They often occur in series or wave succession and are typically spotted during the morning when atmospheric conditions are relatively stable.
For more information:
Thundersnow
An extremely rare weather event, thundersnow, which can also be referred to as a winter thunderstorm or a thundersnowstorm, is a thunderstorm which occurs in frigid-weather and produces snow rather than rain. So rare in fact, you may never realize that you are experiencing a thundersnowstorm unless you are right beneath it as snow acts a muffler to the thunder. While rare, it is more common in lake-effect snow areas around the Great Lakes area in Canada and the US. An occurrence of thunder snow likely means more heavy snowfalls, with a 80% chance that a minimum of 6ft of snow will fall within a radius of seventy miles of the lightning flash.
For more information:
Lenticular Clouds

Lenticular clouds, often described as looking like UFOs or a stack of pancakes, are lens-shaped clouds that form typically where stable moist air flows over a mountain or a range of mountains. There are three types (altocumulus standing lenticular, stratocumulus standing lenticular, and cirrocumulus standing lenticular) and unlike other clouds, they remain stationary in the sky. Aircraft avoid these clouds as they can cause heavy turbulence.
For more information:
And, one more interesting rare weather phenomenon for the road:
Atmospheric Blocking
Atmospheric blocking is quite possibly one of the rarest weather events on the earth and one of the most dangerous. This phenomenon occurs when a high pressure system gets 'stuck' and isn't able to continue moging through the jet stream. As a result, it can lead to events such as flooding or extremely hot and dry conditions leading to heatwaves and droughts. For example, in 2003 an atmospheric blocking event caused the European heatwave which killed 700,000 people. In 2004, atmospheric blocking caused extremely high temperatures in Alaska, causing the glaciers in the area to melt and large forest fires to begin.
For more information:
Rare Weather Phenomena - Part 1
This week on the DRAW Blog: Rare Weather Phenomena!
With this week’s forecast in Montreal looking intense (30C-33C, humidex 35C-38C, chance of thunder) we at DRAW thought it would be apt to delve into some rare weather phenomena. This will be a two part series, with this week looking at rare weather connected to storms!
Storms are a common occurrence and I imagine many of our readers have experienced a storm or two themselves. Storms are often characterized by low barometric pressure, cloud cover, precipitation, strong winds, and possibly lightning and thunder. I personally have found that August tends to be the worst month for storms in central Ontario and Quebec. For example, in August 2009 a series of severe thunderstorms spawned numerous tornadoes in Southwestern Ontario, Central Ontario and the Greater Toronto Area (GTA), with 19 touching down. Montreal got hit with an intense summer storm in August 2017, which left many without power and several 100-year-old trees toppled.
Here are a few interesting rare weather phenomena associated with storms for your perusing pleasure:
Derecho
Derecho are a “line of intense, widespread, and fast-moving windstorms and sometimes thunderstorms that moves across a great distance and is characterized by damaging winds”. Caused by intense heat combined with ripples in the jet stream, this phenomenon is very rare across the mid-Atlantic and only occurs roughly every four years. The first named Derecho was identified in July 1877 and named for its straight rather than spiralling winds. The last recorded Derecho event occurred at the beginning of May 2020 near Nashville, Tennessee.
For more information:
St. Elmo's Fire

By Elmo's_fire.jpg: Unknown
derivative work: Saibo (Δ) - Elmo's_fire.jpg, Public Domain, Link
Most often occurring during thunderstorms at sea, St. Elmo’s Fire is an eerie burst of ionized air that glows blue and can cause tall structures to appear to be on fire. At sea, this would commonly appear on the top of ships masts, but it can also be seen on at the top of Church steeples on land. Named after the patron saint of sailors St. Erasmus of Formia, it was possibly considered a good omen by those who witnessed it. This phenomenon occurs from an imbalance in electrical charge that causes molecules to rip apart.
For more information:
Twin Tornadoes
A single tornado can leave immense destruction and loss of life in its wake, but what about two tornadoes at the same time? Unfortunately Pilger, Nebraska found out in 2014, when twin tornadoes levelled the town. While multiple tornadoes touching down from the same parent storm are not rare, the fact that the tornadoes seen in Pilger were only apart by less than two kilometres and were equal to each other in strength, made these unique. Meteorologists are divided on what causes twin tornadoes, as they can manifest in several different ways. The NOAA Storm Prediction Centre states that twin tornadoes like these only occur roughly every 10-15 years.
For more information:
Ball Lightning

By The original uploader was Srbauer at German Wikipedia. - http://www.photolib.noaa.gov/library/libr0524.htm, Public Domain, Link
This phenomenon is rare but occurs during or after thunderstorms and is characterized by white, yellow, orange, red or blue orbs appearing in the sky. Moving slowly and erratically and leaving behind smoke trails, ball lightning can shine as bright as a 100-watt light bulb. They’ve been well documented over the years but only about 5% of the world’s population has witnessed ball lightning.
For more information:
Gustnado
You’ve heard of the Sharknado, but have you heard of the Gustnado? Classified as thunderstorm wind events, Gustnadoes are created by rain and cold air coming down from inside a storm and hitting the ground hard, creating a gust of wind. Separate from storms and not as strong as tornadoes, Gustnadoes last only minutes but are capable of inflicting some serious damage on their surroundings with wind speeds up to 60-80mph.
For more information:
Microbursts

Public Domain, Link
Microbursts are a type of downburst, which are columns of sinking air and high speed winds associated with thunderstorms. Similar to a tornado, they can cause significant damage to buildings and landscapes but also to airplanes as they can cause a sudden change in wind direction or speed. Microbursts can be wet, dry or a hybrid of the two. Personally, I’ve seen the result of a microburst, where a grove of trees had been chopped in half after an intense thunderstorm.
For more information:
Medicanes
Mediterranean hurricanes, or ‘Medicanes’, are tiny and form when a non-tropical storm comes into contact with the warmer temperatures in the Mediterranean. Extremely rare, fewer than 100 have been noted between 1948 and 2011, and no definite trend has been detected in this period as to how and why they form. One such Medicane occurred in the Mediterranean in October 2019 hitting Egypt and Israel.
For more information:
And, one more interesting rare weather phenomena for the road:
Moonbows

By Arne-kaiser - Own work, CC BY-SA 4.0, Link
Moonbows, or lunar rainbows or white rainbows, are a neat phenomenon where moonlight produces a rainbow rather than sunlight. The colours seen are very light in comparison to rainbows. It is an extremely rare phenomenon as the conditions have to be just right for them to be observed. To see a moonbow, the moon has to be full, low in the sky, and the sky must be extremely dark without the presence of light pollution, with water droplets in the air and opposite of the moon. Particular, right!
So, have you seen any of these rare weather phenomena before? Let us know on Twitter and Facebook!
Crafting the Weather
Today on the blog let's take a look at an alternative way of recording observations about the weather!
The creative macramé community has come up with a neat way of tracking and logging weather observations. The two that I am aware of are Sky Scarves and Temperature Scarves. They are considered conceptual knitting or crafting, where projects go beyond the pattern to “become a small act of performance, community outreach or experimentation”. We’ll briefly go over each project below, with examples, and some suggestions for further exploration.
First seen via Leafcutter Designs in 2012, the Sky Scarf encourages those who knit and crochet to watch the weather each day, wherever they are, and create a stripe in colours that match that day’s sky. The scarf is usually undertaken for one calendar year, and you can either complete the project using Leafcutter Design’s Kit or you could raid a local craft store and put together the colours and supplies on your own. Some crafters have even added in beads to represent rain that occurred during their documentation!
Temperature Scarves are a very similar idea; a stripe is created to represent the temperature at a given time, wherever you are, for a calendar year. This trend also emerged in 2012, but has been gaining awareness, with The Weather Network putting an article out on the activity in February of this year, and hashtags like #WeatherScarf and #temperaturescarf being used to document progress. Numerous patterns exist online for discovery, with some users suggesting to average out temperatures over a day, but you can always once again raid your local craft store and create a table of colours and their associated temperatures for yourself.
While most of the focus has been on knitting and crochet, I imagine that this project could also translate to other macramé projects like weaving. Imagine: a weather blanket or wall hanging! What a beautiful way to document your observations of the weather!
Here are some examples of both Sky Scarves and Temperature Scarves that have been seen around social media:
Another cool project that does something similar is the Tempestry Project, an ongoing collaborative fibre arts project started in 2017 that aims to showcase climate change through knitted and crocheted items. Participants are given weather data for a specific date and area of the world and then their pieces are shown side by side with others from the same area in order to show changes, specifically in temperature. The project relies more on existing, already recorded data, rather than daily observations by the individuals. It is a super neat project and you can find out more here: The Tempestry Project.
Have you ever thought of creative ways to document trends or patterns like those that can be found in temperatures and the sky? Please let us know if you have!
For more information checkout:
Don't Miss Our New Educator's Corner, Years in the Making...
You may have noticed a new tab on our website meant just for teachers and educators who want to bring Canada’s history and citizen science into their classrooms. With classes now occurring online for the foreseeable future, we hope you will add the Data Rescue: Archives and Weather (DRAW) project by asking your students to help with real scientific research that concerns their own heritage.
You can explore the resources in our educator’s corner today and we’ll continue to add new ways to engage your students. Our new “Thematic Guide” offers primary sources on your student’s own cultural history that you can pair with any work you might assign them to examine weather and climate at specific times in the DRAW record. Or try using our curricula to guide your teaching.
For now, we offer a downloadable three-week curriculum PDF developed for Collège d'enseignement général et professionnel (CEGEP) students. It includes a daily course plan, lab handouts, quizzes, final exam questions, and a final assignment that involves students in meteorological data transcription and historical archival research. We’ll soon add slide decks to spice up your online lectures for use with this curriculum, and online interactive teacher training.
Plans are also in the works for a shorter CEGEP curricula and a half-day workshop class for high school students. All of this work was made possible by generous support from the Supporting Active Learning & Technological Innovation in Studies of Education (SALTISE) community in the form of a Fall 2018 Mini Grant. As part of this work, we have studied the impacts of our curricula and expect to soon be able to share our peer reviewed research papers in our educator’s corner as well.
Superb Super-Users: Thank you!

We want to say a super thank-you today to our super-users. We have four transcribers who have each transcribed over 100 pages: Josée, Kathy, Jean-Paul and Louis. Together, these four transcribers have contributed 83% of our transcriptions! In a strange coincidence, this is the same percentage that the 10% of the contributors dubbed superusers were found to make in Online Citizen Science and the Widening of Academia. Another 15 users have completed over ten pages each, and we’re nearly at the half a million mark for the number of data points transcribed- 452 575 and counting! We still have a long way to go, though. Will we get there?
Not only have our users, and especially our super users, contributed by transcribing data, but in the process of transcribing and examining the documents, they have also become the experts on these records. While transcribing over 500 pages Josée has examined the documents closely and has become more expert on the McGill records than many on the DRAW team. We on the DRAW team at McGill tend to look at one area of expertise, such as coding, database management or page quality and legibility. While we look at behind the scenes issues, our citizen science transcribers are the ones on the front lines who are closely engaged with the actual observations.
Our users are the first ones to alert us to discoveries in the data, such as new words used in the observations or new observation types, some of which can lead to new ways of looking at the observations and data.
Some issues that crop up are relatively easy to address. Our transcribers often find new words in weather descriptions, such as the use of “calm” as a wind direction, as well the traditional 8 cardinal points of north, northeast, east, all the way round the compass to northwest. Adding in a new option, such as a ninth wind “direction” for ”calm”, for transcribers to select is easy thanks to the software design.
Other issues they've discovered are more complicated, such as some of the second pages having no observation times on them, as it never occurred to the early 20th century observers that the pages would be seen apart from each other. We’re in the process of working behind the scenes to resolve the issue but some of our more dedicated transcribers have developed work arounds, finding the corresponding pages, writing down the observation times from the first page and then using them to enter them onto the second page. This dedication is amazing and we are so grateful for the time and effort that was expended!
Our users’ time and effort is our most precious resource. Without your help, this data would remain locked inaccessibly in paper format. Thank you to all of our users, and Josée, Kathy, Jean-Paul and Louis, for your continuing contributions to DRAW. We greatly appreciate your efforts!
A Day in the Archives
For this week’s blog, we wanted to give you a behind the scenes look of some of the archival research we have been doing here at DRAW. This week we were looking at the Dawson-Harrington Fonds that is held at the McGill University Archives.
Most of the research conducted was centred around Anna Dawson Harrington. Anna was the daughter of John William Dawson, who was a principal at McGill in the 19th century. Anna married Bernard James Harrington in 1876. Together they had 9 children: Eric, Edith, William, Bernard, Ruth, Clare, Constance, Conrad and Lois. Later in the post, we will get a chance to see some letters written by Anna’s daughter Ruth.
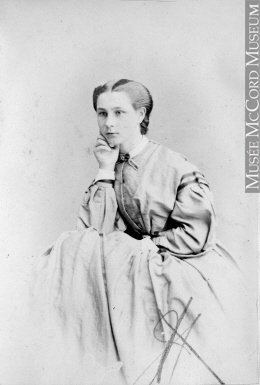
Miss Anna Lois Dawson, William Notman 1865, 19th century I-18160.1, McCord Museum
Anna was usually writing in Montreal or Little Metis, however, she received letters from different parts of Canada and England from her brothers, father and husband. These letters have provided a glimpse into how weather events were written about in the 19th century. Sometimes the mention of the weather was quite brief, but other times we are able to see how the weather impacted the lives of the Dawson-Harringtons.
Letter to Anna from Mrs. Harrington on June 26, 1868:
 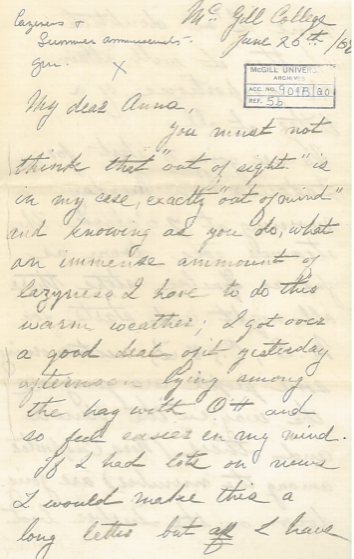
From the Dawson-Harrington Fonds held at McGill University Archives: MG1022_c.61_003
In this letter, Mrs. Harrington complains that the hot weather had been making her lazy. This is an example of a more passing mention of the weather. However, it was one of several letters sent in the summer of 1868 that Mrs. Harrington complained about the extreme heat.
Letter to Anna from Mrs. Harrington on July 19, 1868:
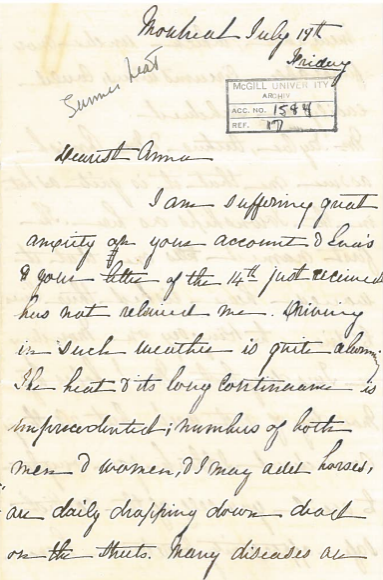
From the Dawson-Harrington Fonds held at McGill University Archives: MG1022_c.61_003
This letter shows the more extreme consequences of high summer temperatures. In this letter, Mrs. Harrington states that both men, women and horses were dying in the streets due to the heat. The letter potentially shows the impact of hot summers in the mid-19th century. It also highlights the usefulness of using historic documents to explore the social impacts of the weather.
Anna’s daughter, Ruth, wrote about the weather in a much more light-hearted way. For example, in a letter from November 1894 to her mother, Ruth writes about wanting to go skating. In her next letter, she mentions skating again, declaring that the skating rink would open that week.
Letter to Anna from her daughter Ruth on December 9, 1894:
 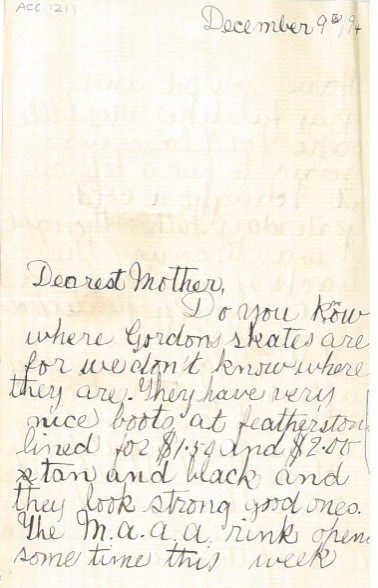
From the Dawson-Harrington Fonds held at McGill University Archives: MG1022_c62_029
During the 19th century, many Montrealers took advantage of the winter weather to participate in other winter activities as well such as tobogganing, snowshoeing and sleighing. You can learn more about winter in Montreal by checking out some of our previous blog posts (Like this one for example!)
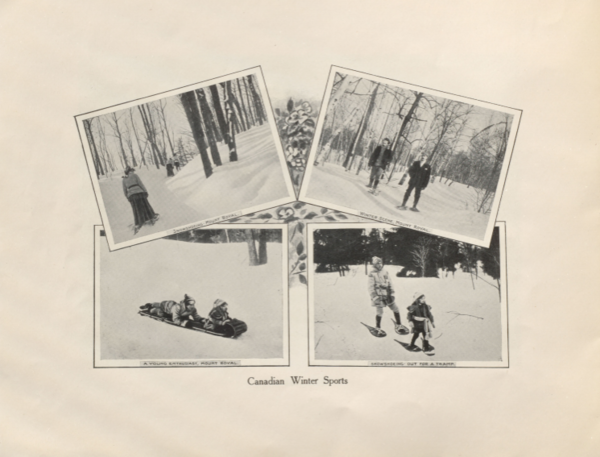
Winter Souvenir of Montreal. Montreal: Valentine, 1900. Rare Books and Special Collections, McGill University Library
To end off this week, here are some tips and tricks for undertaking archival research:
While archival institutions may be practicing social distancing like the rest of us, don't hesitate to reach out if you are interested in doing some research - they may have a ton of resources available online that you could access! For example McGill has a cool exhibit on at the moment, 'Food Riddles and Riddling Ways', which takes material from the Rare Books and Special Collections Department! Check out other cool citizen science projects on our discover page if you're looking to connect further!
Calling All Weather Enthusiasts - We Challenge You!
Looking for something to do while you’re self-isolating and social-distancing? Would you like to contribute to weather, climate science, and history? Come help us transcribe weather records from the past on DRAW: https://citsci.geog.mcgill.ca.
DRAW (Data Rescue: Archives and Weather) is a project to digitize the most complete historical record of Canadian weather. In these handwritten logbooks, students at McGill University from a century ago recorded temperature, cloud cover, weather symbols, and many other types of weather observations several times a day.
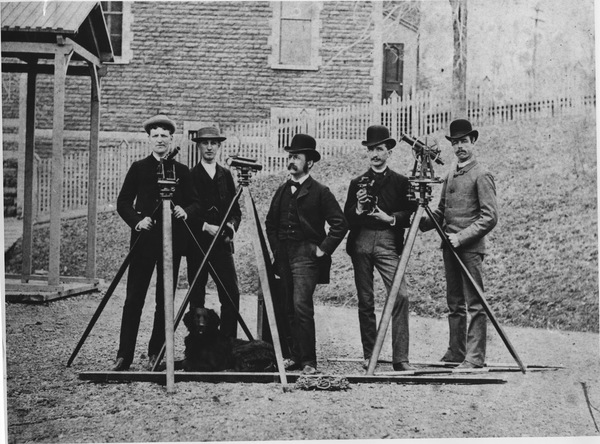
McLeod with surveying students
We need to make these millions of meteorological observations digitally available for scientific analysis. These logbooks also allow us to preserve the social history of daily life battling Canadian weather.
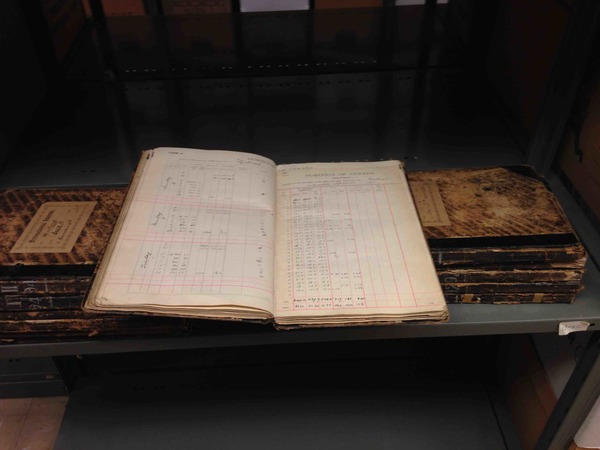
McGill Observatory Logbooks
Here’s where we need your help! You can join a community of citizen scientists who are contributing to the understanding of historical weather patterns and building better knowledge of our climate. All you need to do is sign up at https://citsci.geog.mcgill.ca and begin transcribing handwritten weather observations into computer-crunchable data. The more involvement we have from individuals like you, the sooner this important data can be used by scientists. For example, we want to see how the number and severity of snowstorms, floods or heat waves are changing; your contributions can help us do that.
Follow our social media to learn more about our project. Tweet us about your progress and you just might appear on our feed as a featured transcriber! You can also check out our website to find out more about Montreal, Quebec’s and Canada’s past weather, climate history and incredible scientific heritage.
https://citsci.geog.mcgill.ca/
Facebook: DRAW McGill
Twitter: @DRAWMcGill #DRAWMcGill #CanadaTranscribes
Instagram: @draw_mcgill
Rainbow Wonderland
Good Morning Readers! While we tried very hard to discover a cool weather themed April Fool’s Day hoax to discuss, there’s surprisingly very few weather themed hoaxes out there! Instead we are going to chip in with spreading some hope and talk about Rainbows!
Windows, landmarks and social media accounts across Quebec and Montreal have been blowing up with images of Rainbows. Children and adults are participating to show that while the world may be a little uncertain at the moment, we are full of hope and good will towards each other. Landmarks such as the Champlain Bridge, the Montreal Tower, and the Montreal International Airport have all been participating, giving off this beacon of light to residents.
The use of the rainbow as a symbol of hope isn’t all that surprising in fact! Throughout many cultures they are seen as having positive connotations. In Greco-Roman tradition they were a path made by a messenger between Earth and Heaven, while the Irish saw the rainbow as leading to the leprechaun’s secret hiding place for his pot of gold. In Christian tradition, the rainbow was placed in the sky as a sign of God’s promise that He would never again destroy the earth with flood, as we see with Noah and the Ark. The Norse saw it as the Bifrost, the bridge which connected Asgard and the Midgard.
Often rainbows are colourful symbols of peace and are featured in music, film and art. They feature heavily in religious art and in modern art where they emphasize joy and celebration. When it comes to music, first to mind for me is the famous song, Over the Rainbow from the movie Wizard of Oz, where Dorothy sings of a wonderful place where dreams come true. In addition, rainbow flags have represented LGBT social movements since the 1970s. You can see a representation in Montreal during the summer with the art installation ’18 Shades of Gay’ which covers a one kilometre long stretch in the Gay Village.
But what of rainbows as weather phenomena? Rainbows are caused by the reflection, refraction and dispersion of light in water droplets. Light enters the water droplet and refracts from white light to coloured light, reflects off of the back of the droplet and then refracts once more upon leaving the droplet. What appears to us then is the beautiful multicoloured circular arc. If one is lucky, you can even see a double rainbow, or a full circular rainbow.

In our ledgers, the rainbow has been assigned its own symbol, but it does not appear all that frequently.

While with DRAW I have yet to encounter one in our ledgers! While this is speculation, this could be due to the location of where we took our readings (where the current Leacock Building is) or due to the time of day when we took readings. Rainbows exist all over, but where and how you are viewing the refraction of light will determine if you perceive the rainbow.
So this is our challenge to you, readers: Help us transcribe our ledgers in search for the elusive rainbows and let us know on Twitter when you find a rainbow!
Have an excellent rest of your week and stay happy and healthy!
The Flood of 1886
This week on DRAW learn more about the flood of 1886, brought to us by one of our archival students, Brittany Nolan!
In the 19th century, the coming of spring was often accompanied by floods in Montreal. The floods of 1886 were particularly bad; some parts of the city were covered by over 4 feet of water!
The flooding began on Saturday, April 17th. At first, only cellars had a few inches but it quickly worsened. The flood was so bad that the Grand Trunk Railway yards were filled with water and had to be closed. Two days later the Gazette wrote an article claiming that these were the worst floods yet and that the Saint Lawrence River was at an all-time high.
But, what caused the flood in the spring of 1886 to be the worst one yet? That year the St. Lawrence had larger than usual ice floes which were lodged close to where the Jacques Cartier bridge is currently. An ice floe is a floating sheet of ice and the lodged ice floes caused the St. Lawrence river banks to overflow with both ice and water.
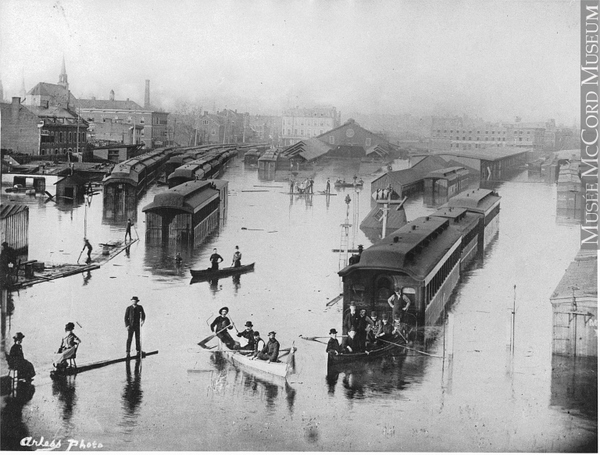
Flood, Bonaventure Depot, Montreal, QC, 1886; photographer: George Charles Arless; MP-0000.236.2
Although the flood was clearly devastating, some people with an entrepreneurial spirit started charging others fifty-cents for boat rides. As you can see in the above image of Bonaventure Station, the road and railways of Montreal became temporary waterways. I’m sure you’ve already guessed that there were no trains coming or going from Bonaventure Station that day!
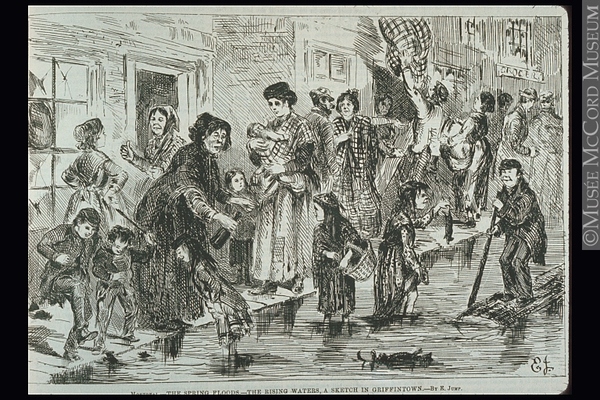
Montreal - The Spring Floods - The Rising Water, a Sketch in Griffintown, 1873; photographer Edward Jump; M985.230.5356
One thing you may not have expected is for fires to break out on account of the flooding. Two blocks were burnt to the ground in Griffintown on account of the floods! The floods greatly affected Griffintown inhabitants. During the 19th century, Griffintown was a working-class neighbourhood with a large Irish population. The above image is a caricature that depicted the Irish population during the 1886 flood. The image not only displays the displaced inhabitants but also shows us some of the stereotypes that were imposed on the Irish population during the 19th century. Despite this, the inhabitants of Griffintown tried to make light of their situation. People allegedly had surprise parties, and young women were singing and playing concertinas on their rafts.
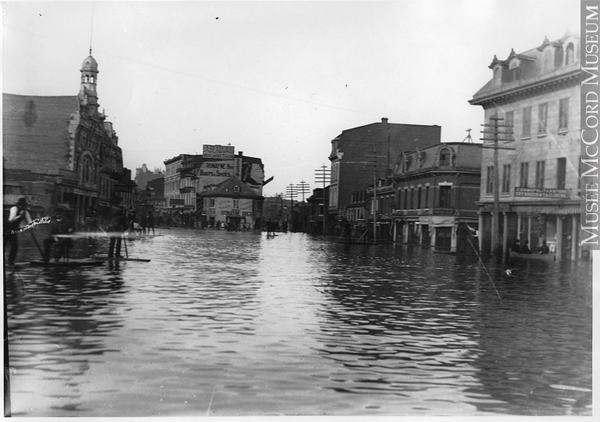
Flood, Chaboillez Square, Montreal, QC, 1886; photographer Henry Herbert Lyman; MP-0000.411.2N
The floods of 1886 were devastating - but they did push the city to come up with better flood prevention plans. In May 1886 a royal commission was launched to determine the cause of the flooding, and form a solution to combat the yearly floods. The result of this commission was a flood wall that measured just over 1500 feet that was completed just before the turn of the century in 1899. Now with the coming of spring, we can rest a little bit easier than our 1886 counterparts!
Weather Forecasting: Vennor's Bulletin
This week in the blog: weather forecasting at the height of our ledger creation!
It’s likely not surprising to our readers that humans have been trying to forecast the weather, for a variety of reasons, for a long time. It’s not too different from what we do today in fact, as ancient weather forecasting methods usually relied on observing events and seeing the patterns that came from them (called pattern recognition). These events could be cloud patterns, for example. A very well-known type of pattern recognition would be ‘old wives’ tales’, such as ‘Red sky at night, sailor’s delight; red sky in morning, sailor’s take warning’ which predicts sunny, fair and clear weather. Weather predictions like these are often area-specific, but variations can occur (New Zealand has a similar one but it predicts the strength of wind rather than a sunny day!).
Some common methods of predicting the weather include:
While many of these methods are useful and often quite accurate, not all predictions during this early weather forecasting period were reliable or would stand up to rigorous testing. As we all likely know well, the weather can be unpredictable at times despite our best efforts.

These days, communicating the weather to the public is a large part of weather predictions. It’s part of our daily lives as it is found in newspapers, the radio, online, or even when we simply open up our phones. Checking what the weather is up to is part of our daily routines as often the weather will dictate travel plans, clothing and even what we need to pack in our bags for the day. But what was weather forecasting and communicating these predictions to the public like when our ledgers were being completed?
Luckily there are amazing resources out there that can tell us exactly this. Let’s look at Vennor’s Weather Bulletin for example!
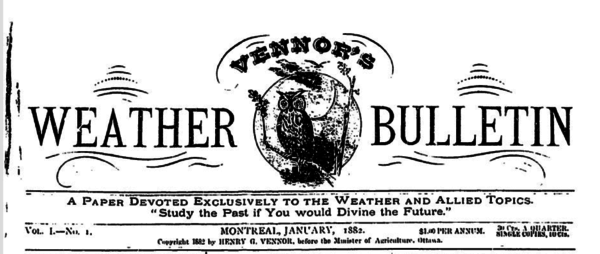
Vennor’s Weather Bulletin was a Quebec publication that ran from 1882 until 1883 in Montreal. Composed of roughly 16 pages, it was sent by post monthly and was “a paper devoted exclusively to the weather and allied topics”. This meant that it didn’t just look at discussing or predicting the weather but also advertised products and services within its pages. It aimed to put weather in a way that the ordinary reader could understand and endeavoured to “present in a readable and simple form, occasionally with a diagram, what have been the more marked features of the closing month, and endeavour to sketch out the probable outline of the weather for that just entering”.
The bulletin ultimately was to be a source for weather inquiries for all across North America. Vennor wished to avoid vague descriptions and whenever possible tried to go for detailed descriptions of weather events. It described the ‘character’ of the months (February being ‘fickle’), looked at weather milestones like heaviest snows, looked at the range of temperatures for the seasons, and included correspondence from other locations, such as an article on winter in Japan. The bulletin also provided concrete information like an entire article on how to hang a Barometer in the January 1882 edition. In addition, there were letters to the editor, reports, and even a ‘Queries and Answers’ section in which some answers were of a more joking tone.
While this bulletin is short lived, it provides a wealth of information about Montreal, Quebec and the weather predictions which were occurring for this area and for North America at large. If you’re interested in learning more about Vennor’s Bulletin, it is available online here through McGill.
Introducing DRAW Members: Robert Smith
Introducing...
Who:
Robert Smith
From:
L’anse au Loup, Labrador
Role at DRAW:
Creator and maintainer of the DRAW’s archival data rescue web application.
Favourite Part of DRAW?
My favourite part is working together to solve tough challenges as a team.
Favourite Season?
Spring
Favourite Weather Symbol?
Lunar Halo

Favourite Cloud Type? Why?
Cirrus because they are made up of ice crystals far up above the others and look really beautiful during sunsets.
Coolest thing you've learned while participating in DRAW?
I learned how to build a Ruby on Rails web application. I started developing this software as my independent study project at McGill during my final semester before graduation, and have been continuously designing and developing the software with the rest of the DRAW team ever since! Working on the software has led me to pursue an exciting career in software development and continues to be a source of creative expression to this day.
And of Course:
Sweet or Salty?
Sweet
Star Wars or Star Trek?
Star Trek
Cats or Dogs?
Dogs
Favourite Animal?
Mantis Shrimp
Favourite place in Montreal?
Mont Royal
Keep checking out the blog to see more DRAW Member Introductions in the coming weeks alongside our usual content!
DRAW February Funnies
To help alleviate any February blues, this week on DRAW we are going to liven things up with some weather themed jokes! Let us know which one is your favourite or tell us your favourite weather themed joke/pun/story on Facebook or Twitter!
How do you prevent a Summer cold?
What do you call a month's worth of rain?
What do you call dangerous precipitation?
What do you call a wet bear?
Why does Snoop Dogg need an umbrella?
What did the thermometer say to the other thermometer?
You make my temperature rise!
What happens when fog lifts in California?
UCLA!
What's the difference between weather and climate?
You can't weather a tree but you can climate!
What do you call it when it rains chickens and ducks?
Fowl weather!
What do you call a cold ghost?
Casp-brrrrr!
What day of the week has the most powerful gusts of wind?
Windsday!
Why do hurricanes travel so fast?
Because if they travelled slowly we'd have to call them slow-i-canes!
What are the hottest days during the summer?
Sun-days!
What game do tornadoes like to play?
Twister!
What do freezing rain and cake icing have in common?
Both are a glaze!
Why is the sky not happy on clear days?
It has the blues!
What is the opposite of a cold front?
A warm back!
What do lightning bolts do when they laugh?
They crack up!
How do meterologists say hi?
With a heat wave!
Who is it that everybody listens to but nobody believes?
The weatherman!
On This Day: Winter Carnival 1883
Did you know this Friday, January 24th, is the 137th anniversary of the first winter carnival held in Montreal? In honour of this anniversary, let’s take a look at what the weather in Montreal was like that day.
The Montreal Winter Carnivals were week long events focusing on local social and recreational activities. The Carnivals, which were held in 1883, 1884, 1885, 1887 and 1889, were held annually at the end of January, and hoped to showcase the unique Montreal winter activities as a way to foster a Canadian National Identity and of course benefit the local economy. Like the summer festivals held today in Montreal, the Winter Carnivals established the city as the winter wonderland spot in the nineteenth century.

By classicauctions.net, PD-US, Link
The planning for a carnival would begin the previous September and would include a beautiful program that detailed a schedule of events. Pictured below is the cover of the 1887 Montreal Winter Carnival program. A typical carnival included activities like curling, skating, hockey, snowshoeing, tobogganing and one year there was even lacrosse! Brr! The first hockey tournaments held at the Carnivals were the predecessor to the championship leagues later on. The highlight of the carnival though would be the ice palaces which would be created in Dominion Square and which would be the site of a great mock battle which would close the Carnival week with fireworks and a snowshoe walk up Mont Royal.
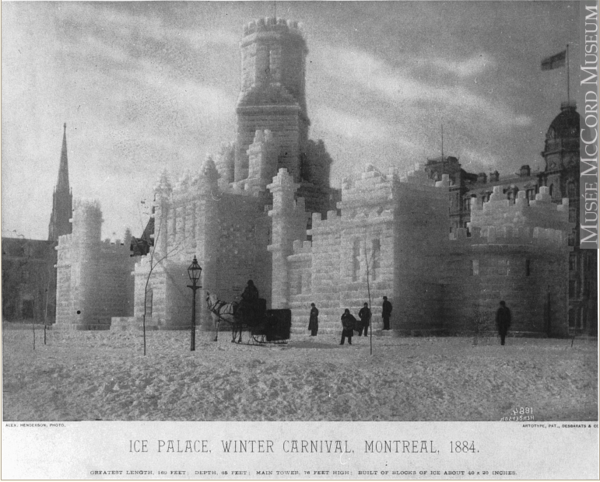
Ice palace, Winter Carnival, Montreal, QC, 1884 (Alexander Henderson 1884, 19th century MP-1975.19, McCord Museum)
In our ledgers, January 24th 1883 was a Wednesday and it was cold. The first observation of the day, 3:13am showed that a lunar corona was observed. A lunar corona is a weather phenomena when rings appear around the moon and are caused by moonlight passing through thin clouds of ice crystals. The old wives tale about lunar coronas is that if you see one, prepare for snow or rain! In our case, this lunar corona did in fact predict snow and rain as later on in the day, snow was observed!

The minimum temperature observed at 7am and 11pm were the same - -18 degrees celsius. The maximum temperature wasn’t much better at -11.5 degrees celsius. With it being a snowy and windy day, it was a day you’d rather bundle up inside than go out and explore a winter carnival!
Let us know if you have attended any Winter Carnivals and if so, what your favourite events were and what the weather was like!
DRAW and Student Projects: ENVR 401
Welcome to our first blog post of the new year! Everyone at DRAW hopes you had a happy end to 2019 and we are looking forward to bringing you more interesting and engaging content in the new year!
ENVR 401: Environmental Research is an undergraduate course offered by McGill’s School of Environment. Offered in the Fall Semester, the course has students “work in an interdisciplinary team on a real-world research project involving problem definition, methodology development, social, ethical and environmental impact assessment, execution of the study, and dissemination of results to the research community and to the people affected.” (Course Description)
Since 2015, a student team from the ENVR 401 course have been formulating research projects around citizen science, weather and more specifically the DRAW project. Past projects focused on:
This latest Fall Semester, the ENVR 401 team chose to look at how to extract value from historical weather data. How is the data we are transcribing actually useful in analysis? Can it tell us anything about the environment and weather and how it has changed?
The students developed a method to detect and classify winter storm events from historical weather records in Montreal, allowing comparisons between winter weather in historic and modern time periods. To do so, they developed a method to detect winter storms using frequently recorded modern data and adapted the Local Winter Storm Scale (LWSS) into a Daily Winter Severity Index (DWSI), which gave a daily score between zero and six based on the amount of snow, freezing rain, and wind in a 24 hour timeframe. In addition, they examined reports in the media to find evidence of the social impact of winter storms.
Based on this media coverage analysis, they determined a numerical threshold level for the DWSI value to detect the start and end of a storm event. When there were multiple consecutive days with a DWSI value above this threshold level, the team considered this to be one winter storm event. Then, a model was created to aggregate the separate elements to account for the total impact of the storm and rank the entire event using a numerical scale, the Storm Severity Index (SSI).
After developing this model, it was run for 6 Januaries between 1879 and 1884, using historical data available through the DRAW Project here in Montreal, as well as 6 Januaries between 2014 and 2019, using data collected at the Pierre-Elliot-Trudeau International Airport in Montreal by Environment and Climate Change Canada (ECCC). When looking at their results, statistical analysis shows that there was no significant difference in frequency, intensity, or distribution of storms between the old weather data and modern data collected!
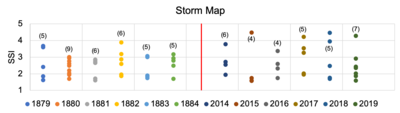
This year’s ENVR 401 Project was a neat look into whether or not claims that the weather is getting worse are justified. The students were able to create a method to detect and classify winter storms in Montreal that can be applied in the future, specifically to other Januaries in DRAW data, or even likely in other datasets around the world.
If you are interested in hearing more about the ENVR 401 classes, let us know! All of the past ENVR 401 Project abstracts are available here. We are also looking towards adding the final papers from each of the DRAW specific projects to our website in the near future - so keep an eye out!
On This Day
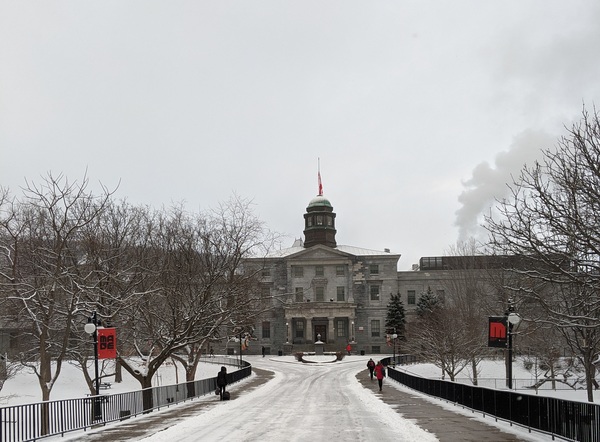
For this week’s blog we are going to look at the weather this time 100 years ago: December 18th 1919. We won’t have time to fully immerse ourselves in what was happening 100 years ago, but to set the scene:
In terms of weather, in our historic ledgers on this day three observations were taken at 7:45am, 3:00pm, and 7:45pm. To note is that the temperatures recorded in 1919 are likely in Fahrenheit as the switch to Celsius did not occur until the 1960s.
Thursday December 18th 1919 was cold and clear, with blue cloudless skies and a maximum temperature of -10.5 (-23.6 C) in the morning and 2.2 (-16.5 C) in the evening. The minimum temperature on the other hand for morning and evening was -12.0 (-24.4 C) and -11.8 (-24.3) respectively. The wind was South/South-West and while our ledgers do not record the unit of measurement, 16-18 was the recorded value. What is particularly interesting to note is that there is a column for ‘Sleighing’ and it was noted on this day that it was ‘0 - none’. My assumption is that this means there was very little to no snow on the ground and therefore sleighing was not in fact possible.
When comparing modern day weather, 100 years ago was definitely a colder December. Wednesday December 18th 2019 dawned with -4 C (24.8 F) feeling like -8 C (17.6 F), South-West winds and snow flurries. The sky is definitely not blue and clear as 100 years ago, but in fact overcast. This afternoon’s predictions are -3 C (26.6 F) feeling like -7 C (19.4 F) and scattered flurries (I assume more overcast skies as a result). This evening, around a similar 7:45pm observation time, is expected to be -8 C (17.6 F) feeling like -18 C (-0.4 F) with light snow. Already we have a few centimetres of snow on the ground and if we were recording our values in similar ledgers today, I think our likelihood of sleighing would be a 1 or 2 (bad or good), depending on if our snow continues to amass and stick around.
In the future, we will compare a single day over multiple years and see what sort of pattern emerges. A similar project has been completed with the McGill ENV 401 class who explored and compared storms in January 1879-1884 and January 2014-2019, using analysis to not only find instances of storms but to also compare whether there has been an increase or decrease in storm activity. Check back in January 2020 for a post on this topic!
And finally, we at DRAW wish you a happy and safe holiday, whatever you celebrate, and we will see you back for more interesting and informative content in January 2020!
Weather Symbols in Real Life: Part 2
Weather symbols are important to the transcribing of weather data as they explain without words weather phenomena that is being experienced. We have dedicated a section of our website to exploring the different weather symbols we use in our transcription interface (Meteorological Observations) and a couple months ago looked at the history of weather symbols on this very blog (International Communication: Weather Symbols). But do we really know what the symbols mean when they are defined as ‘hoar frost’ or a ‘solar corona’?
This series will explore real life images of the weather symbols - taken by our own team!
Glazed Frost
Captured by team member Rachel

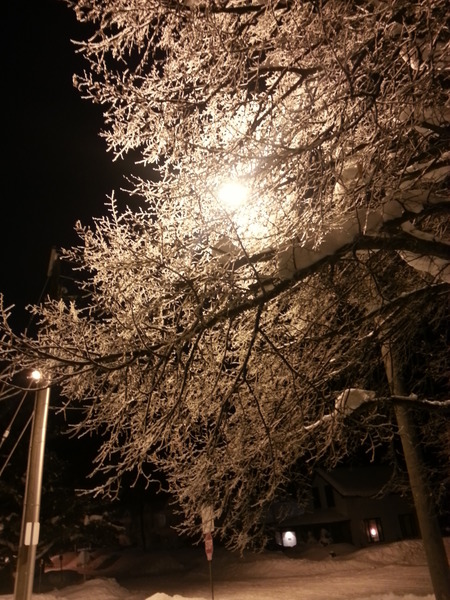
"Ugly" Threatening Appearance
Captured by team member Rachel
u
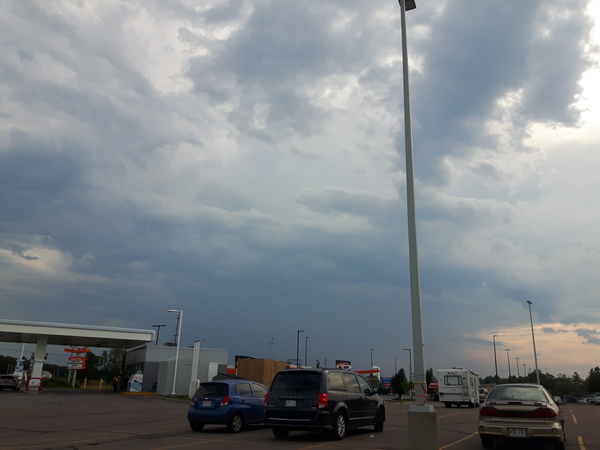
Flurries of Snow
Captured by team member Rachel>/p>

Thunderstorm
Captured by team member Rachel

Show us your own examples of weather symbols in real life on Facebook or Twitter!
Introducing DRAW Members: Gordon Burr
Introducing...
Who:
Gordon Burr
From:
Montreal
Role at DRAW:
Outreach and Workshop Coordinator
Favourite Part of DRAW?
Outreach, working with students, giving presentations - connecting with our users primarily
Favourite Season?
Summer
Favourite Weather Symbol?
Snow
Favourite Cloud Type? Why?
Cumulus - I like the fluffiness of them
Coolest thing you've learned while participating in DRAW?
That weather data models are only based on the data from the last 15 years - which means what we do is really important
And of Course:
Sweet or Salty?
Salty
Star Wars or Star Trek?
Star Trek
Cats or Dogs?
Dogs
Favourite Animal?
Deer
Favourite place in Montreal?
Bishop Street, with its variety of restaurants
Keep checking out the blog to see more DRAW Member Introductions in the coming weeks alongside our usual content!
Observing During the Wars
In commemoration of November 11, Vicky Slonosky talks a little bit today about the effect war has on meteorology.Meteorology is an important aspect of war, and during the two World Wars in the 20th century, weather observing was affected in a number of ways. Weather forecasts and reports had military strategic value, and the international exchange of weather observations, so laboriously and slowly organized over the course of the 19th century, was stopped during the world wars.
The effect of the First World War on weather recording in Canada was mainly in the reduced number of observers, as so many students and young men having enlisted to fight overseas. This can be seen in the McGill records, where the records are in some confusion: observing times are a bit more inconsistent. Not usually by more than five minutes, but on some occasions observing times vary by up to 30 minutes.
For example, the photo below shows an inconsistency in our own ledgers. This is from the end of February/early March 1916 and shows that observations could be off 30-40 minutes or not recorded at all.
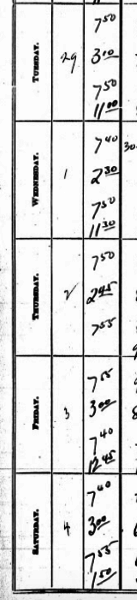
Aviation became important towards the end of the First World War, and pilots discovered many of the upper air currents that determine large scale weather patterns. Norwegian meteorologists led by Vilhelm Bjerknes developed the weather front theory which led to a breakthrough in weather forecasting. Their thinking was inspired in part by the system of trenches that defined the Western Fronts stretching from Switzerland through France to Belgium in the First World War.
Aviation was a much more important component of the Second World War, and weather forecasting was critically important for aircraft to take off, fly and land safely. This led to an expansion across Canada of training grounds for Allied pilots, and associated weather forecasting for these new airports. Morley Thomas described this period in Canada in his memoir “Metmen in Wartime: Meteorology in Canada 1939-1945.” Despite the title, some women were trained as meteorologists. Meteorologists were deemed so crucial to the war effort that they were forbidden from enlisting as soldiers, to the disgruntlement of some.
Despite this increase in observations, the effect of the wars can be seen in the reduced number of world wide weather observations for the duration of the wars, most notably for the Second World War for sea surface temperatures. After the wars, however, data exchange resumed and after the Second World War especially, the number of stations increased dramatically.
If you are interested in further reading about this topic, check out the following links:
Weather in the History of Science
Today we will be taking a quick look at the intersection between the history of science and weather observations/meteorology.
The movie The Aeronauts was shown at the Toronto Film Festival last month, dramatizing the lengths meteorologist James Glaisher went to in his exploration of the atmosphere, taking instruments such as thermometers and barometers up in hot-air balloons. The first balloon ascents with meteorological interests in mind were made in 1784 by Dr John Jeffries and Jean-Pierre Blanchard. In 1804 French scientists Joseph Gay-Lussac and Jean-Baptiste Biot ascended above Paris with their barometers and thermometers to investigate the behaviour of the atmosphere, atmospheric gases, and the magnetic field at high altitudes. They later became renowned for their work in chemistry and physics, Gay-Lussac especially for his work on the gases laws and chemical composition.
.jpg”)
A collecting card from The United States Library of Congress Prints and Pictures division depicting Gay-Lussac and Biot in an hot air balloon.
At a museum on the history of science in Philadelphia, John Dalton, Biot, and Gay-Lussac were all presented as chemists, and indeed much of their work and legacy are in the fields of chemistry or physics. Most of us know Dalton through our high school chemistry class’ introduction to gas laws and as the proponent of atomic theory. But it’s not generally known that Dalton arrived at his atomic theory partly through his lifelong interest in meteorology. His first biographer, William Charles Henry, wrote that “Dalton grappled in his early years with several fundamental problems in the philosophy of heat and meteorology”. Dalton published the first edition of his Meteorological Observations and Essays in 1793, before his work on atomic theory. It was Dalton’s lifelong fascination with the processes of precipitation, evaporation and water vapour which led to his work on gases, which led in turn to his atomic theory and ground-breaking work in the field of chemistry, for which is is revered today by chemists as a founder of their field. But he was also a meteorologist, and he kept daily weather records his entire life.
In fact, it has been suggested that Blaise Pascal launched the modern scientific age when in 1648, he set up with his brother-in law Florin Perier a quantitative scientific experiment for parallel measurements of the atmosphere with two barometers, one ascending a mountain (the Puy-du Dome in Clermont, France), and one stationary at the bottom of the mountain. By recording that the barometer which ascended the barometer dropped while the one which stayed at the bottom remained constant, the experiment established the existence of the atmosphere, and the fact that it was finite. The dawn of the scientific age began with the establishment of the atmosphere, and the units we measure pressure in today are named after Pascal.
There are other examples of major scientific breakthroughs that came about as part of studying the weather, and which led to fruitful discoveries in other fields: Edward Lorenz and chaos theory comes to mind. One lesson this history seems to show is that the reason weather forecasting and climate prediction are still not perfect is not because smart people aren’t working on the problem, or because the weather is boring and people aren’t interested in researching it, but because weather and climate prediction are really, really hard. Weather and climate are complicated, non-linear systems, which are affected by many things and on many time scales, and climate especially ultimately involves almost all the branches of science in one way or another, from astronomy to microbiology. Nevertheless, incredible strides have been made in weather forecasting, and every bit of data we can put towards understanding past weather and climate helps us improve that understanding.
If you're interested in learning more, check out:
BOOK REVIEW: Climate in the Age of Empire
In today’s edition of the DRAW Blog we will be looking at the book Climate in the Age of Empire: Weather Observers in Colonial Canada. This book, written by our own Victoria Slonosky, looks at the history of weather observations in Canada between the mid 18th century and the early 20th century. This examination as a result also traces the development of meteorology (a branch of science concerned with the processes and phenomena of the atmosphere as a means to forecast the weather) and climatology (the scientific study of climate). It also inadvertently traces the history of Montreal, Quebec City and Toronto during this time, showing another facet of the history of Canada.
Slonosky’s book aims to provide not a complete history of meteorology or climatology in Canada or a detailed analysis of the climate of the past few centuries but instead aims to look at the people involved and their motivations, ideas of weather, and their record-keeping practices. And this goal really shines through as she focuses on the individuals who drove forward meteorology and climatology to what they are today: John Samuel McCord, John Bethune, Jean-Francois Gaultier, Alexander and William Skakel, Charles Smallwood, John Henry Lefroy, and John Herschel to name a few.
The book is structured thematically and chronologically, looking at specific topics, such as the impact which the military and medical practices/ideas at the time had on weather observations, and tying them into the timeline. Slonosky finds great pleasure in highlighting how the practice of taking weather observations was not taken in a vacuum. The individuals spoken about in this book kept up a healthy correspondence with others who were interested in taking observations, whatever their motivations may be.
This means that we get a good look at how colonial expansion, war, and religion affect the taking of observations and how individuals were influenced by ideas emerging in France, England, the United States of America, and parts of Canada at the time. This can be traced through the letters and equipment exchanged across the atlantic, but also in the attendance at conferences were individuals, such as Charles Smallwood, presented to their contemporaries on topics of interest. Smallwood, for example, presented in 1857 at the American Association for the Advancement of Science (AAAS) conference on ozone and its potential influence on disease as a disinfectant. It was always a delight when Slonosky would mention a new person who was influential to the story only to tie them to others we had already had the pleasure of meeting, showing how interconnected this network really was.
As mentioned, motivations were differing among the individuals taking the observations. Some were part of the colonial machine, reporting their observations to their mother country to help with the understanding of the new world they encountered, such as Jean-Francois Gaultier. This included the idea that by clearing the land the settlers would change the climate for the better. Others were clergy with a private interest in understanding another aspect of God in nature, such as John Bethune. Physicians were also interested in weather, as it was the belief that the weather impacted disease, like malaria, and there were efforts to determine whether this could be true.
You might think that observing the weather and jotting it down would be a relatively easy practice but in fact it was highly complex and contentious. War could stop the observations completely or the communication of observations to other parts of the world; there was much debate about when the observations should be taken, where they should be taken; funding was often scarce when derived from private sources or tied up in the colonial expansion and thus the military structures of the time; and the observations themselves were not standalone facts of figures – they were often used to try and prove (or disprove) theories of the time, like the storm controversy which was at its heigh in early 19th century USA. Slonosky weaves these elements into discussions on the individuals effortlessly.
Overall, Slonosky’s book is a good look at this often forgotten part of our history. She takes great effort in describing the individuals, networks, equipment and ideas which existed at the time. This includes a discussion and analysis in the last two chapters of whether climate change, the ability to change the environment to better change the climate, was in fact occurring at the time as observers believed. It was interesting to note that climate change as a theory is in fact not a new concept and had been around in Canada for almost four centuries! My only criticism would be how jam-packed this book is with information, which is wonderful, but hard to get through at times. It is definitely more suitable as a textbook that you read a chapter or two as needed, rather than as a pleasure novel you read from cover to cover. This is mostly due to the jumping we do in the timeline as a new theme is introduced. What is beneficial though is a detailed biographical index at the end, allowing readers to quickly reference who the new (or not so new!) name that is being referenced is.
In conclusion, Slonosky’s book is an excellent addition to the history of Canada and sheds light on a topic that is not often (if at all) taught in formal history classes today. I would highly recommend seeking out a copy and learning more about the history of weather observations, meteorology and climatology in Canada.
Check out the Goodreads for the book here or find the book on Amazon.
DRAWn into Education
Bad puns aside, we’ve focused so far on historical weather, our ledgers and our members as well as the transcription process on the Blog so today we will explore other aspects of the DRAW project - namely fostering education and awareness.
DRAW, as you know, is a project dedicated to making the data from the old McGill Observatory ledgers available widely to the scientific community. We decided to do this by digitizing the pages of the ledgers and then making a platform in which the public (you!) can transcribe the data into datasets for further analysis. As part of this, we field questions about the process, troubleshoot any issues, and try to keep our users informed/interested in various topics through this Blog site. In addition, DRAW works with educators to inform students about not only the project, but to use the project as a case study in order to help students learn about not only weather but also the scientific process.
One such example is DRAW’s work with the Montreal CGEP Dawson College. As part of our efforts towards improving science literacy, DRAW has created a three week CGEP Course Module, where students utilize data transcription in DRAW to learn about citizen science, historical meteorology, and climate/weather research. You may remember a bit of our work with Dawson College discussed previously in Geoffrey Pearce’s guest post on Air Quality in July, as Pearce is the teacher for this module we developed.
To date there have been two iterations of this course, with the first in 2018 focusing more on social science research methods and the latter on environmental science and energy usage (2019). The students work in groups to utilize archival resources (i.e. historical newspaper archives, BANQ, first-hand published accounts) to match a specific day in history with the historical meteorological record from DRAW. This course helps to foster further interest in the sciences and helps us assess our transcription platform and processes to improve the site for our users.
DRAW is also focused on education at the post-secondary level. We will hear about it further in the coming weeks, but DRAW works with the School of Environment in the ENVR 401 Environmental Research Class as a topic for their interdisciplinary research project. Last year’s ENVR 401 group, for example, focused on determining how fit for use the DRAW archive data was based on both year and the columns within the ledgers.
This is just a peek at the work DRAW does in terms of helping improve scientific literacy and educational projects we are involved in. If you or your organization is interested in collaborating with DRAW please do not hesitate to get in touch!
Introducing DRAW Members: Rachel Black
Introducing...
Who:
Rachel Black
From:
Ontario
Role at DRAW:
Records Management, Social Media, Outreach - Jack of all trades!
Favourite Part of DRAW?
The interdisciplinary nature! Its awesome to interact with several different disciplines and explore new ways to look at projects.
Favourite Season? Why?
Autumn - I love the colours, the smell and the crisp air.
Favourite Weather Symbol? Why?
As much as I hate dealing with it in reality, I love the Snow symbol.
Favourite Cloud Type? Why?
I really love Cirrocumulus - I was told by my grandfather as a child that they predicted rain coming and its stuck with me since.
Coolest thing you've learned while participating in DRAW?
The vast communication network that existed between Europe and North America. Its really fascinating to see the influences individuals had on each other and weather recording practices.
And of Course:
Sweet or Salty?
Sweet! Such a sweet tooth.
Star Wars or Star Trek?
Star Trek.
Cats or Dogs?
cats
Favourite Animal?
Giraffes.
Favourite place in Montreal?
Probably any natural space - I love how many parks, parkettes, and just neat little crooks and crannies there are in Montreal to be discovered. A close second would be the large variety of vegetarian/vegan restaurants to explore!>
Keep checking out the blog to see more DRAW Member Introductions in the coming weeks alongside our usual content!
Sleighing
It’s hot and humid outside, and has been another sizzling summer. But before we complain too much, we should remember the past winter…
All Montrealers agree that this past winter was a difficult one, with the freezing rain and freeze-thaw giving us lots of ice everywhere. This ice then hardened making walking a dangerous activity, with the risk of slipping and spraining or breaking a limb high. But how unusual was it in historical terms?
The first person to ask me this was Natasha Hall from CJAD this past winter, so I ran a few statistics to answer her. It was definitely unusual, with the fifth highest number of hours of freezing rain since 1954 – 83 hours of freezing rain or drizzle between November 2018 and March 2019. For comparison, there were 104 hours in 1998, the year of the famous ice storm, and 103 hours in 1983, another year with severe ice storms. The average since 1954 is 43 hours of freezing rain and drizzle per winter.
Freezing rain is hard to compare with historical records as past observers usually only noted if freezing fell during a day, not the number of hours as observers have done since the start of hourly observations at the Dorval Airport. They also seem to have only recorded strong events. This is one of the reasons the DRAW project is so important: we need the weather data from DRAW to bridge the gap between historical weather diaries and modern synoptic observations, and to be able to tell the difference between real changes in weather, and changes that come about because of the different ways people observed in different periods. Despite this, it does look like freezing rain has increased since the 18th and 19th centuries.
The freeze-thaw effect, where warm temperatures during the day melt snow into puddles of water, only for the cold nights have the puddles refreeze into lethally slippery smooth patches of ice, was not unusual this past winter. The average number of freeze-thaw days over the winter is 42, and the winter of 2018-2019 winter had 45 freeze-thaw days. The winter of 2017-2018 holds the record number of freeze-thaw days, at 67, followed by 2002 and 1880, both tied at 65. The vast puddles turned into lethal ice surfaces might, somewhat counterproductively, have had more to do with efforts to melt the ice from freezing rain than with the actual air temperature.
Until the mid-20th century, transport in Montreal relied on horses and carriages or sleighs. Sleighing conditions were important, and warm winters with frequent melting and refreezing were harder to get through than cold ones. When the temperature went below freezing and stayed there, rivers froze and became roads. Snow accumulated, packed down hard and made conditions perfect for horse drawn sleighs. With fur lined robes and dressed for the cold, transport was sometimes easier in winter than on muddy roads in spring and summer.
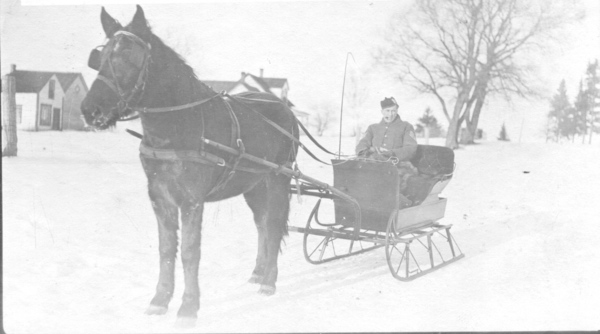
Figure 1: Horse and Sleigh with passenger
After 1900, ironically the same year that the first automobile came to Montreal (clipping thanks to V. de Serres),a column marking “Sleighing conditions” was added to the weather register.
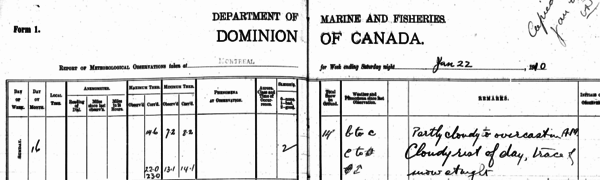
Figure 2: Sleighing Condition was on the form, but rarely recorded!
Despite the ever increasing presence of motor vehicles, horse-drawn vehicles were still used for deliveries in Montreal well into the 1950s.
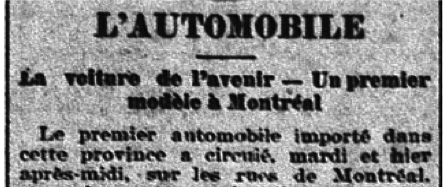
Figure 3: Clipping from La Presse, November 23 1899
In warm winters, with frequent freeze-up followed by thaws, roads became impassable mires of frozen slush or mud. With each snowfall the sleighs had to be brought out; with each thaw they had to be replaced again with wheeled carriages, which tended to get stuck in the half frozen mud. Years with high numbers of freeze-thaw days include 1805 and 1825, 63 days each between November and March, 1807 and 1849. The winter of 1848-1849 was described in detail by Dr William Sutherland of Montreal, who recorded having to switch between his carriage and sleigh through the entire winter.
“Almost all the snow gone; wheels in general use today,” he wrote in his weather diary on December 30th. After a snowfall in early January, sleighs were taken out again but “wheel carriages were in use” again on January 17th 1848. There was another switch to sleighs soon after, with carriages back out on January 25th 1848. There was enough snow on February 2nd for “sleighing fairs”, but by February 22nd, “sleighing was hard in town” due to a lack of snow.
When we remember that the roads weren’t paved, and imagine the state of the streets after the snow melted and horses, sleighs and wheeled carts and carriages have passed over, we might reflect that difficult as it might often be to get around in winter in the 21st century, it could be worse.
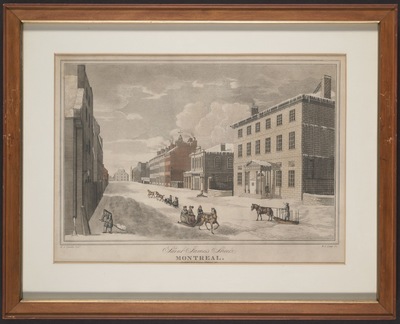
Figure 4: Saint James Street by R.A. Spoule, McGill Rare Books and Special Collections, Lande Collection (Lande 32)
Introducing DRAW Members: Renée Sieber
Ever interested in who is behind our project? In this series learn about our members!
Introducing...
Who:
Renée Sieber
From:
Ontario by way of Michigan and New Jersey
Role at DRAW:
Multifaceted - To answer citizen science related questions ; to look at non-experts collaboration with scientists to influence science policy ; To get people interested in the site and remain interested in the site ; To assess the quality of contributions and broader value of the contributions within science ; science literacy to help individuals become more educated about the world
Responsibilities?
Favourite Season? Why?
Spring - Spring in Quebec is explosive.
Favourite Weather Symbol?
Hoarfrost
Favourite Tree? Why?
Maple - because it has beautiful colours in the fall and many affordances (aesthetic in function - syrup)
And of Course:
Sweet or Savory?
Sweet
You are on a deserted island - three things you have to have?
A way to make fresh water, unlimited power, a laptop that could access the internet
Star Wars or Star Trek?
Star Wars 4-6
Cats or Dogs?
Cats
Favourite Animal?
Frog
Favourite Music Genre?
Alt-folk
If you'd like to find out more about Renée Sieber and her work with DRAW check out our News page or explore the following:
Keep checking out the blog to see more DRAW Member Introductions in the coming weeks alongside our usual content!
Horizontal and Vertical Montreal
This week on the DRAW blog : look at how the vertical and horizontal city can affect weather!
The urban heat island effect is one that’s well known to many city dwellers- the fact that heat tends to accumulate in large (and even not-so-large) built up areas, partly due to land use and partly due to heat sources from energy use by people. Roads, concrete, asphalt, buildings and other man-made structures all have different heat and water absorbing or shedding characteristics than do natural surfaces such as forests, grass and wetlands.
Large cities like Montreal have changed enormously in extent over time, starting from small centres, currently known as Old Montreal covering a few square kilometers in the early 19th century when continuous weather records began (Figure 1) to covering nearly two thousand square kilometers of urban conglomeration, suburbs and exurbs today (Figure 2).
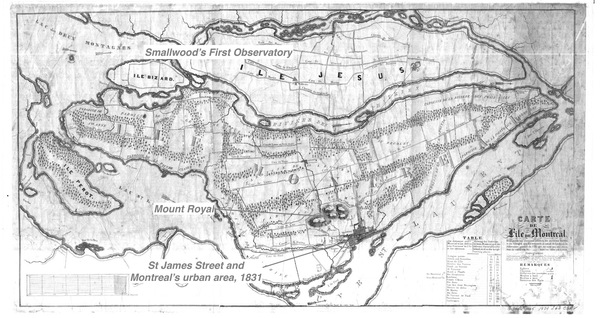
Figure 1: Annotated map of the Island of Montreal, 1834 (Original from Bibliothèque et Archives nationales du Québec
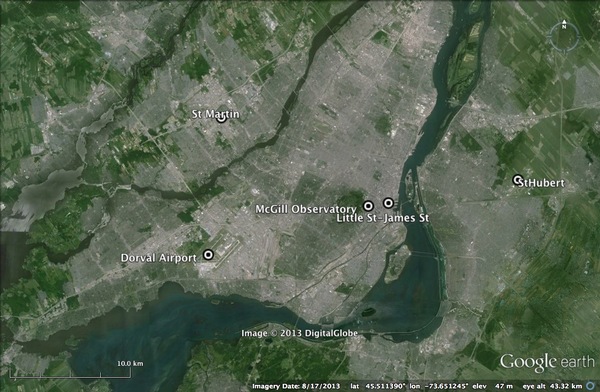
Figure 2: Island of Montreal, 2013
But not only has the horizontal extent of downtown Montreal changed, the vertical profile has as well.
For much of the 19th century, the Montreal skyline was dominated by churches, and most especially by the towers of the Notre-Dame cathedral. The cathedral towers could be seen from miles away and feature prominently in every landscape depicting Montreal (Figures 3-6).
Figure 3: Travelling in winter on the St-Lawrence river, 1866 (Library and Archives Canada, MIKAN 2897892)
Figure 4: View of Montreal from St Helen’s Island c.1830 (Library and Archives Canada, MIKAN 2837606)
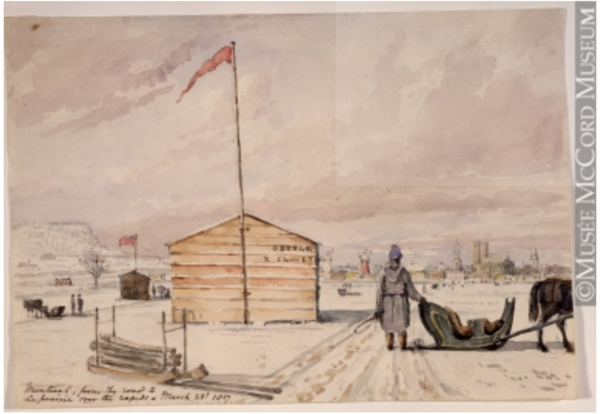
Figure 5: Montreal from the Road to LaPrairie over the Rapids (Philip John Bainbrigge (attributed to) 1837, 19th century M968.97, McCord Museum)
Figure 6: St. Lambert's Road, Montreal, QC, about 1870 (Alexander Henderson about 1870, 19th century MP-0000.1452.59, McCord Museum)
With the development of Montreal as a major port, and especially the construction of the huge grain elevators from the turn of the 20th century, and the proliferation of skyscrapers from the 1930s onwards,the vertical profile of the city of Montreal changed as well. The Sun Life building, completed in 1931, was the largest building in the British Empire at the time, with 24 storeys (though the Royal Bank of Canada building, near the cathedral on St Jacques / Saint James Street, was several storeys higher). Today, it’s almost impossible to find the towers of Notre-Dame amidst the soaring building surrounding the cathedral (Figure 7).
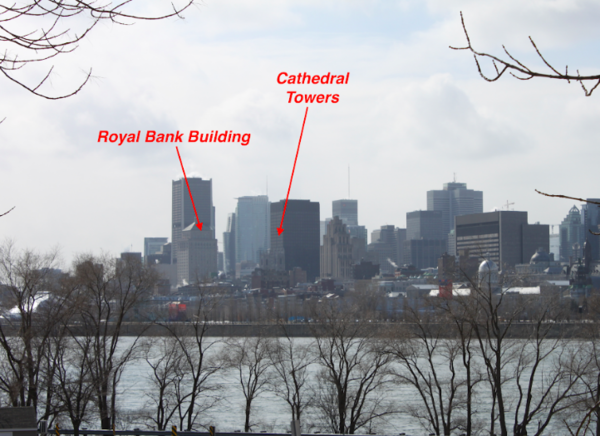
Figure 7: This more recent picture is taken from approximately the same vantage point as Figure 5 (Vicky Slonosky)
What does this mean for the weather? As downtown residents and workers can attest, the tall buildings often act as wind tunnels, funneling icy cold blasts down the artificial canyons from Mount Royal to the Saint Lawrence. The presence of tall buildings can also affect convection, changing vertical air movement and leading to more cumulus clouds and thunderstorms around urban areas. Increased warmth in winter, as well as active measures to melt snow and ice, contribute to the formation of slush, which then freezes into icy surfaces overnight. The inhabitants of a city truly can create their own climate.
In addition - if you are interested in having a great look at the vertical and horizontal changes yourself check out the lookout at the top of Mont Royal, La Grande Roue de Montréal in Old Port, or Musée Point à Callière where there is an exhibit on the changes!
Handwriting Help
Old handwriting can be difficult to read and interpret, even for the experienced. Are you having difficulty reading the pages you are transcribing? Look no further - today’s post is about tips and tricks to reading old handwriting.
I wasn’t aware of this before, but the study of old writing in fact has its own name : Palaeography! This discipline focuses on the reading, deciphering, dating and context of old documents throughout history. It is crucial for historians and philologists to be familiar with this discipline because language and the way we write is constantly evolving over time - to understand a document you are studying you need to know how it was created! This of course, is not to be confused with Graphology, which is the study or analysis of a person’s handwriting in order to identify personality, emotional state, or the person itself. Graphology is a little more controversial and seen as a pseudoscience in some circles.
It can be difficult to read old handwriting for several different reasons. Is it a diary, ledger, administrative record, or personal correspondence? Or none of the above? Each of these documents might have different short forms, abbreviations, or different handwriting which could cause the document to be difficult to read. Our own weather ledgers have predetermined short-hand which might not be known to the general layperson and which might not be found in personal diaries or correspondence of someone unconnected to the weather world.
Or spelling could be an issue. In older documents the letter ‘i’ could be substituted with a ‘y’ or the letter ‘s’ with a ‘f’. In addition, there are types of ‘mirror writing’ that can occur. I have personally seen this in notes my grandparents have made where they have inverted their ‘n’ to look like a ‘u’, their ‘w’ to look like a ‘m’ and vice versa! This can make for some amusing or confusing reading!
Or they could have used a technique such as cross-hatching (also known as cross letters or crossed writing) which was used to save paper and thus postage in the 19th century. By writing overtop of an existing part of the letter, in the same ink in one sitting, it can be difficult to distinguish specific letters or words without practice. This requires a little more patience to decipher and luckily it is not common practice in ledgers.
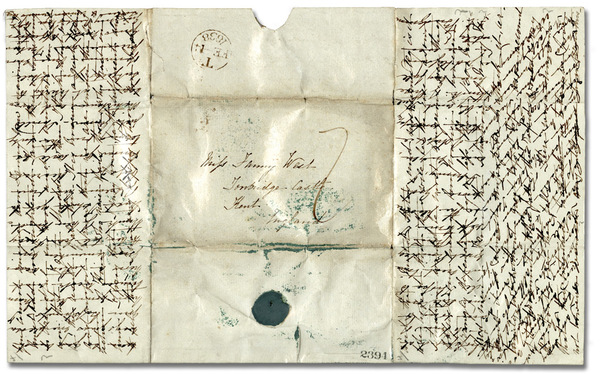
Here is an example of a cross-hatched letter (Wikipedia Commons).
Overall, learning how to navigate older handwritten primary source documents is extremely beneficial and takes practice, so don’t get discouraged! Here are some helpful tips and tricks on how to deal with handwriting on our weather ledgers:
Even the most experienced historians can have difficulty reading older documents. Take a deep breath, or a break, and carry on.
Under Meteorological Observations there is a handy chart for symbols, including those which are single letters or combinations of letters - check here to get an idea of what might be the closest to what you are seeing on the page Or check out the drop down menus that are available in the Transcription Panel - these have little images showing the options that could present in these cases - like cloud types or wind directions!
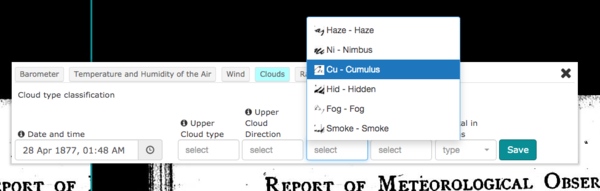
The drop down menu for Clouds in the transcription panel has images to help!
Is there anything else on the page that can help you identify it? Compare other letters or words or numbers to see if they are similar and hazard your best guess.
Check your numbers against others on the page - is this 7 similar to that 7? Or is it actually a 1?
Also, if you are looking at temperature, cross check it against the time of year! A temperature of 73F is not odd for the summer, but in the winter? Probably actually 13F!
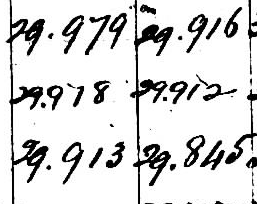
Is this a 2? A 7? Checking other parts of the page can clear up this confusion.
If it’s an issue of spelling getting you down, sound out the word. No spell-check can create some pretty interesting spellings so think phonetically!
Ask around! Ask your friends what they think; if you are at a DRAW event, ask those around you; Ask us via Facebook, Twitter or email what we think!
Or if you are truly stumped and no one else is sure, feel free to mark it as illegible! This will let us know that something wasn’t clear and we can get back to it for further review.
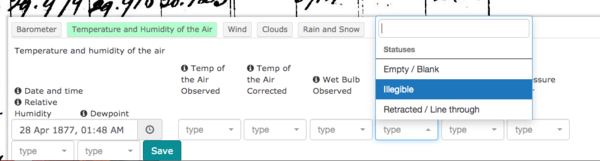
Feel free to select illegible.
Check out these interesting reads on palaeography, graphology and other tips of the trade when reading old handwriting!
Wikipedia - Graphology
Wikipedia - Palaeography
Graphology Handwriting Analysis
WikiHow - How to Read Old Handwriting
Ancestry.com - Tips for Reading Old Handwriting
UK National Archives - Palaeography
Find My Past Blog - 11 Tips for Reading Old Handwriting
Wikipedia - Mirror Writing
Guest Post: Air Quality in Montréal
Please join me in welcoming Geoffrey Pearce to the DRAW Blog!
Geoffrey Pearce has been teaching in the department of geography at Dawson College since 2011. Prior to that he completed a master's degree in planetary science at the University of Western Ontario with a research focus on the geology of the northern plains on Mars. His attention has since shifted to Earth and helping students to engage in urban field studies and citizen science projects.
Today he will be talking about Air Quality in Montreal
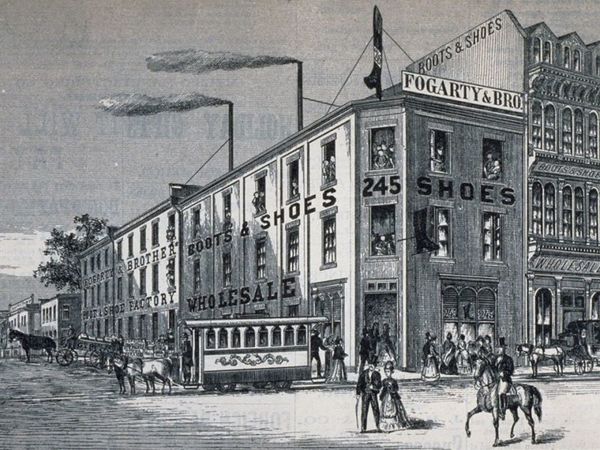
Figure 1: An engraving showing a shoe factory at the corner of Ste. Catherine and St. Laurent Blvd in 1875, with smoke being released from chimneys (source: Canadian Illustrated News, Dec. 1875/BANQ)
In the opening of his landmark 1897 study ‘The City Below the Hill’, the sociologist Herbert Ames draws a contrast between living conditions in the well-to-do Montreal neighbourhood of Ville-Marie, ‘The city above the hill’, and living conditions in the poor and industrial areas along the Lachine Canal, ‘The city below the hill’:
“Looking down from the mountain top upon these two areas, the former is seen to contain many spires, but no tall chimneys, the latter is thickly sprinkled with such evidences of industry and the air hangs heavy with their smoke.”
Ames’s text provides detailed insight into economic and social conditions in neighbourhoods along the Lachine Canal, but there is only vague mention of the smoky air. A similar sense of ambiguity recently struck me when looking at the DRAW website and seeing the word ‘smoke’ written in the margins of a meteorological entry made on McGill campus in June of 1878. Was this smoke from a distant forest fire, or from people in the city burning coal and wood? Was it a localized phenomenon or did it span the city?
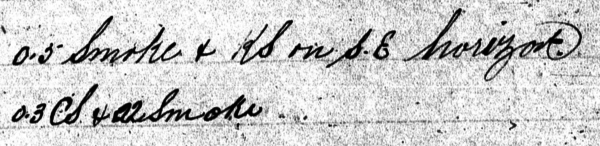
Figure 2: remark about smoke from an entry at McGill's observatory on June 15, 1878, taken from DRAW website
This spring I put the challenge to students in an Environmental Studies course at Dawson College, where I teach geography, to describe how air quality in Montreal has changed since the late 19th century.
Students had trouble finding discussion of Montreal’s air quality in the late 19th and early 20th centuries, and connecting entries of ‘smoke’ from the DRAW page with other sources proved challenging. This is related to the nascent state of public health science at the time, but is probably also influenced by the fact that air quality was so persistently poor that heavy smog was not newsworthy. Wood and coal were the main sources for cooking and heating, and a variety of industries that have since disappeared from the city landscape added to the unhealthy atmospheric mix. At the end of the assignment, several students expressed gratitude that the city smells much better than before. I suppose that this is one way to appreciate our heritage!
Today, the Air Quality Health Index is displayed on screens while waiting for the metro, and chasing up data from specific monitoring stations is relatively simple. A quick Google search yields peer-reviewed studies about risk factors for particular boroughs, and controversies surrounding air quality - such as debate about the fate of wood burning ovens in pizzerias and bagel shops - are regularly covered in the news. The challenges that students encountered in describing the current state of air quality in the city were related to the abundance of data, rather than its paucity.
With the semester over and the assignments graded, I was left reflecting on how difficult it is to create a succinct answer about the how, where, and why of Montreal’s changing air quality. The shift from coal to hydroelectricity beginning in the mid 20th century reduced smoke substantially, but globalization and the local disappearance of many industries was also significant, as were emissions regulations shoehorned by property developers in the 1930s. Many students were surprised to learn that coal-fired power plants in Ontario made significant contributions to pollution in Montreal until they were phased out a few years ago. And these are only a few of the main variables. While neighbourhood differences in inequality and exposure to environmental hazards in 19th century Montreal are striking, some students compared this with the current contrast in air quality between uphill and affluent areas, such as Westmount, and lower income communities bordering industrial sites, such as Montréal Est.
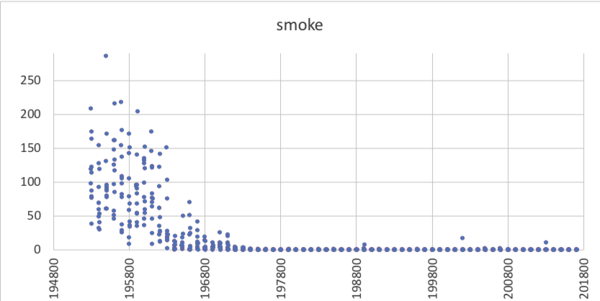
Figure 3: the graph shows the # of smoke days recorded at Dorval Airport for each year between 1953 and 2018; the drop in smoke days was strongly influenced by the shift to hydroelectricity (graph courtesy of Victoria Slonosky)
The general trend for air quality in Montreal in recent decades is one of significant improvement, but I have found that students are much more aware of harmful but short-term events then they are long-term trends. One of the drivers of science is to understand and respond to things that were formerly invisible or misunderstood. In this sense, increased awareness and measurement of smoke, and concern about its health effects, can be seen as reflective of impressive and hard-won progress. We can look to the past to understand how progress occurred and to help guide us as new challenges occur.
Weather Symbols in Real Life
Weather symbols are important to the transcribing of weather data as they explain without words weather phenomena that is being experienced. We have dedicated a section of our website to exploring the different weather symbols we use in our transcription interface (Meteorological Observations) and a couple months ago looked at the history of weather symbols on this very blog (International Communication: Weather Symbols). But do we really know what the symbols mean when they are defined as ‘hoar frost’ or a ‘solar corona’?
This series will explore real life images of the weather symbols - taken by our own team!
Lunar Halo
Captured by our developer, Rob
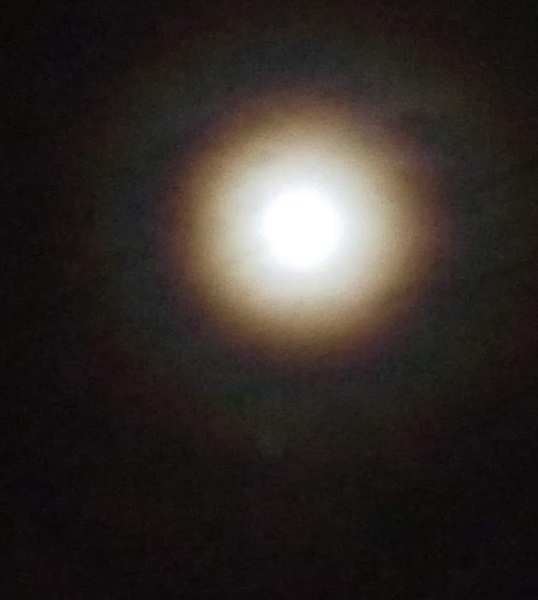
Rainbow
Captured by team member Rachel
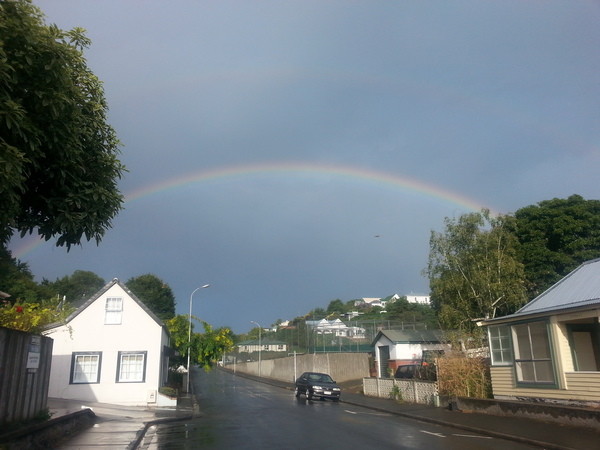
Solar Halo
With two small “mock suns” or “sun dogs” on either side, captured by team lead Vicky

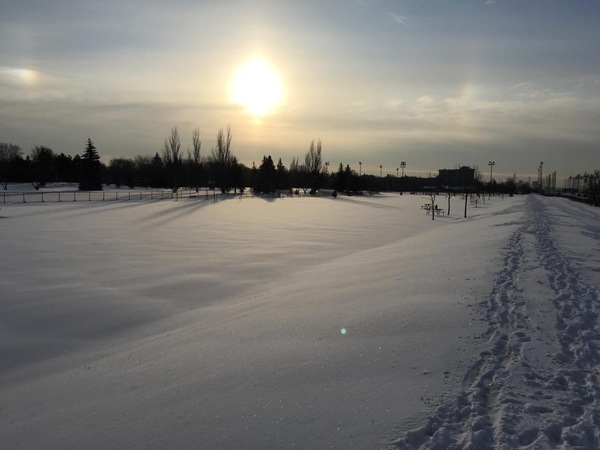
Overcast
Captured by team member Rachel

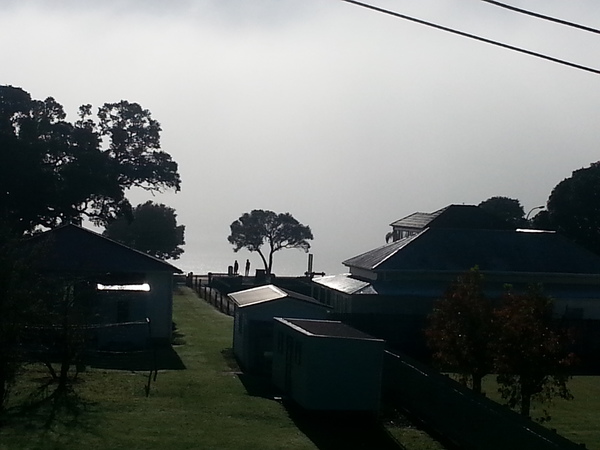
Overcast
Clear
Show us your own examples of symbols in real life on Facebook or Twitter!
Who Were the Observers?
This week we will explore a little about the individuals who were taking the observations we are transcribing.
The McGill observatory was originally founded by Dr. Charles Smallwood. An emigrant from England, Smallwood arrived in Montreal in the 1830s and set up a country practice in St Martin on the island north of the island of Montreal, then called Ile-Jesus, and now called Laval. By the 1840s, he had built an observatory with an impressive array of home-made instruments and arrangements for automatic recording. In 1863, he was invited to move the Observatory to McGill College. For some time it was known as the Montreal Observatory.
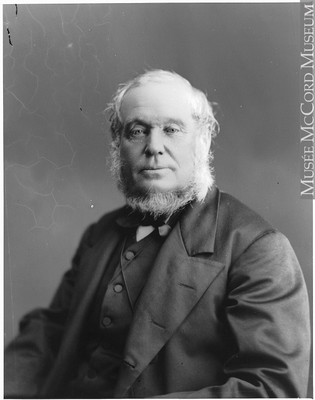
Dr. Charles Smallwood
Smallwood had an honorary position as Professor of Meteorology, but he wasn’t paid to be a Professor or a weather observer, and although the observatory had some subsidy from the Meteorological Service of Canada (MSC) for instruments and for student assistants, he continued to earn his living as a doctor, living in Montreal on Beaver Hall Hill. One of his student assistants, Clement McLeod, was given permission by the College to room in the main building to make it easier for him to take observations in the adjacent Observatory.
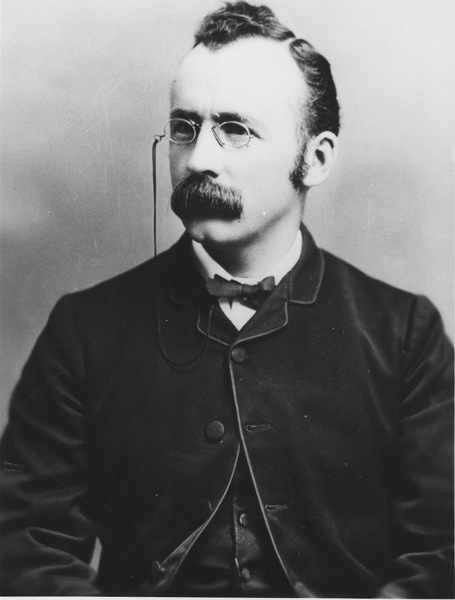
Clement "Bunty" McLeod
Smallwood died in November 1873, without an obvious meteorological successor. After some consultation with the Director of the MSC, George Kingston, McLeod, who had just graduated in Civil Engineering, was nominated to take over the observations. MacLeod was dispatched to Kingston in Toronto with a number of the instruments for a crash training course, and observations resumed in January 1874.
McLeod was the Director of the Observatory for the next 40 years, until his death in 1917. Letters from 1875 show that salaries were paid for the Superintendent and two assistants. In 1880, McLeod applied to have a “the desirability and necessity” of residence built at the Observatory for the observer consider; this was granted and a house was built onto the Observatory building, where McLeod and his wife raised their family.
McLeod with surveying students
We know one student assistant was James Weir. Another, A.J. Kelly, graduated in 1911, served in the Princess Patricia regiment in World War I, and returned to McGill, where he eventually became Superintendent of the Observatory in turn.
A budget for 1937-39 has listed the salaries of the Observer, A.J. Kelly, Weather Man, J.C. Kelly, and Day Clerk, C.L. Henry. Further wages are listed “for exposure of Sun Card”. A later document describes Charles Henry as having been the Chief Observer in 1958 “for over twenty years”.
If you'd like to learn more about the observers and the history of the observatory itself, don't hesitate to contact us!
Communicating Weather: Storm Warnings and Telegraphs
This week we will look at how weather, especially dangerous weather, was communicated in a time before telephones, cell phones and the internet. It is no surprise that weather observations played a significant part!
Space and Time: the Observatory, The Transit Telescope and Longitude
One of the most important functions of the McGill Observatory, and one which brought in much needed revenue to help pay for the meteorological and other scientific observations, was timekeeping. Timekeeping is fundamental to any kind of observing. In the 19th and early 20th century, timekeeping relied on observing the transit of certain stars. Midnight was defined as the moment certain stars, depending on the season, passed overhead. The transit telescope was one of the most important instruments in the observatory, although for timekeeping purposes it didn’t need to be as sophisticated and powerful as for astronomical discovery.
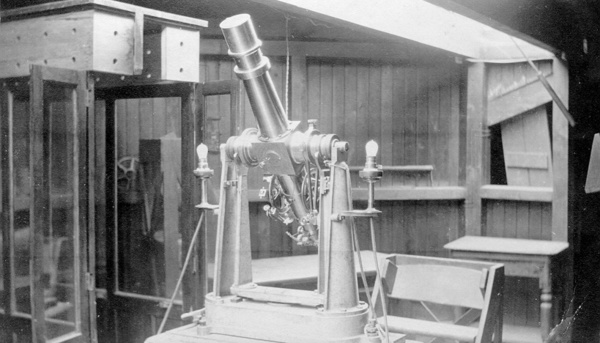
Accurate time was important in the age of railways to co-ordinate schedules, but was also crucial in determining longitude, both for ships in an Empire connected by sea and across the North American continent being surveyed, mapped and settled. Time and space are linked by the Earth’s rotation; the Earth rotates through 15 degrees of longitude every hour. With an accurate clock, the difference in time between two places can also be translated into the difference in longitude between those two places, and location can be determined. Somewhere 4 hours west of Montreal is also somewhere 60 degrees west of Montreal.
Clement McLeod, the Observatory’s second Director, used time and the exchange of telegraph signals with Waterford, Ireland in 1891 to obtain the most precise determination of longitude in North America for the McGill Observatory. McGill’s time signal was communicated to Montreal’s harbour, then one of the busiest in Canada, and by telegraph to Ottawa and westwards across the country. Once telegraph lines were laid under the Pacific, the time signal travelled across the ocean as far as Australia.
Storm warnings and telegraphs
Time was also very important for weather observations, both for exchanging weather observations across many time zones and for tracking fast moving weather like storms. Before the telegraph, storms moved faster than any human communications could. If a storm developed on the Great Lakes and passed up the St Lawrence towards the Atlantic, it moved faster than a rider on a horse or a ship could travel to warn people downstream in the path of the storm that danger was on the way- to say nothing of the hazard of trying to travel in a storm. With the invention and widespread use of the telegraph in the second half of the 19th century, for the first time there was a means of communication which could travel faster than weather systems, and so storm warnings became possible. It was to develop storm warnings, and to try to lessen to terrible losses of life from shipping at sea, on the St Lawrence and on the Great Lakes that the Meteorological Service of Canada (MSC) was first started. For many years, the MSC was a part of the Department of the Marine.
This is the reason the observations times in the McGill records tend to be at odd, but precise times such as 7:48 am or 11:13 pm. It’s partly to allow for synchronous observations across many longitudes, and partly to allow for the weather observation collators at a central observatory such as Toronto or Washington enough time to receive all the reports by telegraph, plot them all on a map, analyze the results and then issue a storm warning or forecast at, say 9am or midnight.
We will see you next time with more information on the principal observers at the McGill Observatory!
Introducing DRAW Members: Vicky Slonosky
This week we will explore who is behind our project, starting with Vicky Slonosky!
Introducing...
Who:
Vicky Slonosky
From:
Montreal (south shore) via England, France and Toronto and back to Montreal
Role at DRAW:
General wrangler & worrier, and historical weather data expert
Favourite Part of DRAW?
The enthusiasm! Everyone working on it is there because they want to be, and because they believe it’s an interesting and worthwhile project.
Favourite Season? Why?
Autumn- after the summer heat, the relief of the first cool breeze and hint of chill is like a promise of renewal- I think we should start our new year in October. Also, harvest season is a great time for any baker.
Favourite Weather Symbol? Why?
Tough one to choose, but I think snow drift, because it’s so quintessentially Canadian, with “poudrerie”, “blowing” and “drift” seen in the earliest Canada records going back to the 18th century (though admittedly often accompanied by words such as “violent", “affreuse" and “horrible"!)

Favourite Cloud Type? Why?
Cumulus- I love watching them grow, change shape, and billow out against a bright blue sky. Also very cool when they become dark and turn into dramatic storm clouds.
Coolest thing you've learned while participating in DRAW?
The sheer number of people who are interested in weather and giving up their precious free time to type in old weather records, as well as the variety of way people have found to use the results.
And of Course:
Sweet or Salty?
Sweet (I'm a baker)
Star Wars or Star Trek?
Star Trek. I used to do all my math homework watching after school reruns
Cats or Dogs?
Allergic to cats, so dogs, but would be happy to have cats if I could
Favourite Animal?
Chickadees. I watch them from my kitchen window and have a special bird feeder only they can get into
Favourite place in Montreal?
So many to choose from! Toss up between St Helen’s Island for outdoors and BAnQ for indoors.
If you'd like to find out more about Vicky Slonosky and her work with DRAW check out our News page or explore the following:
Keep checking out the blog to see more DRAW Member Introductions in the coming weeks alongside our usual content!
Marginalia in the Ledgers
Welcome to the third installment of the DRAW Blog! This week we will be discussing Marginalia and the incidences of marginalia which we have found in our own ledgers.
Have you ever encountered a book in which someone wrote in the margins? Or did you ever draw or doodle in the margins of your class notes as a student or while in a meeting? If you have, you have either encountered or created marginalia.
Marginalia are marks that are made as additions to an existing book or document. Specifically marginalia can be drawings, scribbles, comments or critiques which appear in the margins (or sometimes between the lines of the actual text too!). These marks can be placed by a reader after the fact (like if you wrote in notes regarding the text content in order to help organize your thoughts) but can also be created by the author or publisher during the documents’ creation. This can be seen in many biblical manuscripts through liturgical notes in the margins and even in popular fiction, like in the case of 16-18th century copies of Reynard the Fox where moralistic notes are placed in the margins for readers to muse on.
A good example, and one of the better known ones is the marginalia found in medieval manuscripts. Scribes would test their pens on the outer leaves of the manuscripts, and later books, to ensure their strokes would be consistent. These marks could be as random as scribbles or be the full alphabet, musical notation, or drawings. In one case, even a cat added marginalia to the manuscript, leaving paw prints on the pages! You will also see instances of marginalia in archival documents, such as personal papers. McGill University Archives holds private fonds from individuals and some contain marginalia, like the Ross Family Fonds which contains doodles in the student notes of Dorothy Ross - she drew her professors during class!
But why does marginalia matter?
Marginalia can provide a different layer of understanding to the document for modern day readers as information about the construction of the document and who was doing the writing is not usually recorded. As a result, these random doodles can tell us about trends (styles of writing in different parts of Europe for example) or even about the people involved. Marginalia is incredibly important to historians and archivists - even Citizen Scientists too!
We were surprised and excited then that while digitizing the ledgers for transcription that we found marginalia in the pages. Highlighted today are 8 images from ledger pages dating from 1902,and 1904-1906. The marginalia found in our ledgers are interesting; they appear to be something possibly to pass the time as they are not notes or commentary or pen tests - they are specifically portraits of people
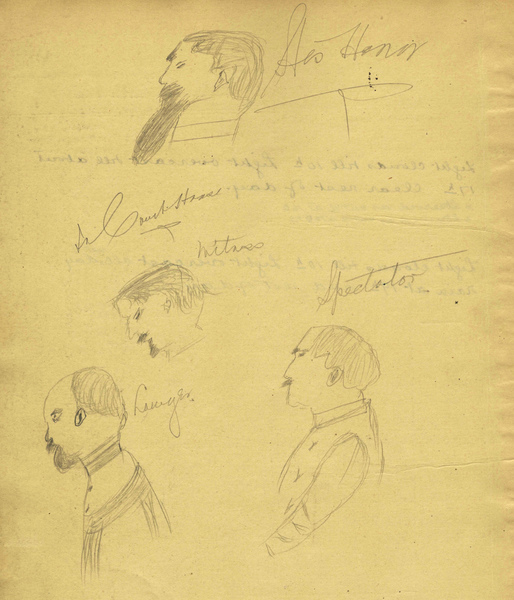
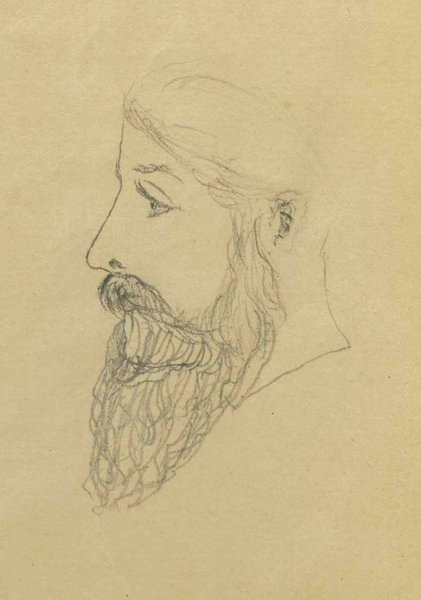
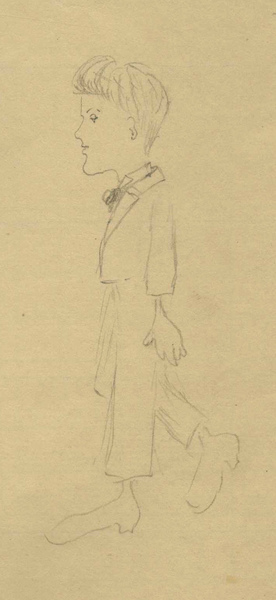
Our observers have drawn several people they likely knew in profile view, replicating not only several men (with impressive facial hair) but also several women with fancy up-dos and details such as dress ruffles and hair accessories.
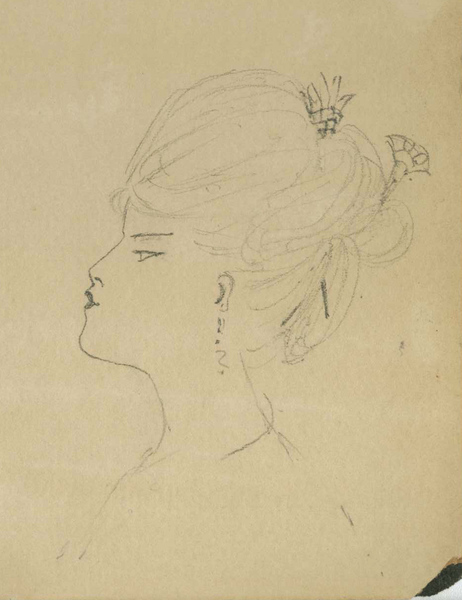
We honestly don’t know too much about these doodles as of yet - a few of the men have names scrawled underneath them and one of the portraits is initialed. We will have to research further into who these people might be or who could have drawn the portraits - all which could provide context to the observatory at the time and who was involved!

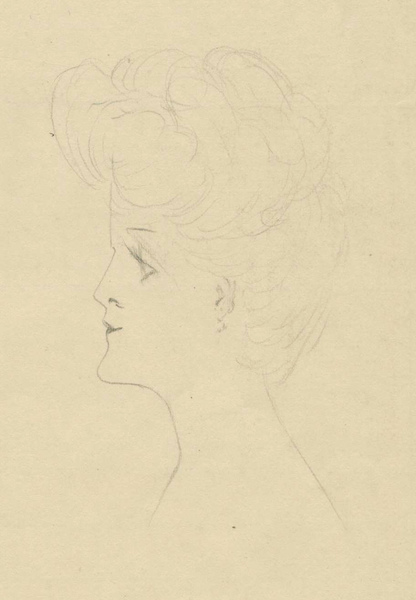
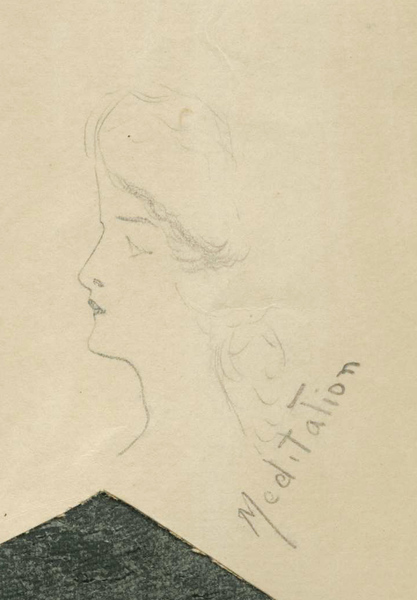
If you are interested in reading more about marginalia check out the following:
Or, if you would like to see the marginalia featured here up close, contact the McGill University Archives here.
International Communication: Weather Symbols
Welcome to another DRAW Blog post! This week we will be looking at the why and how of weather symbols.
While transcribing you may have come across little symbols used to depict different types of weather, rather than writing. It was one of the most difficult challenges we faced in designing our interface in fact. We can’t just ask our citizen scientists to type them in - there are no keys for these symbols after all! Do we provide a table to consult? Do we ask them to type them in as “rain” or “snow”? What sort of standard should we use that is both accurate and easy for citizen scientists to transcribe?
Our developer Rob came up with the answer: a drop-down menu which let the users match the handwritten symbol on the page with a list of pre-determined symbols. We created this list from a variety of print sources, including the Instructions to Observers (1878) by George Kingston, the director of the Meteorological Service of Canada and Hints to Meteorological Observers (1908, 6th edition) by Marriott.
This difficulty we faced in trying to figure out a standard to transcribe the weather symbols is not new. The idea of trying to use standard words to describe weather goes back to at least the 18th century. One of the first attempts to coordinate standardized international weather observation was undertaken by the Societas Meteorologica Palatina, in Mannheim. The Mannheim network had stations across Europe and in North America and Greenland. A number of factors including cost and the Napoleonic Wars contributed to its demise in 1795 as international correspondence, even about the weather, came under suspicion of potential espionage!
In the early 19th century, Francis Beaufort and Luke Howard continued the search for a standard way to discuss weather. Howard was the topic of our last blog post about cloud classification systems, and Francis Beaufort was a member of the Royal Navy. As such, he was interested in trying to classify wind strength for ships at sea. The Beaufort Scale describes the force of the wind based on visual cues, such as white caps on waves or the filling of the ships’ sails. Beaufort also devised one or two letter codes for weather such as “rn” for rain. He used “b” for “blue sky”, which is why we sometimes see “b” as an indicator for “clear” - this is a common symbol found in our own ledgers!
This system worked well enough for the English but as time went on countries wanted to exchange weather data and an international standard was needed. Letter codes for weather conditions based on each country’s language were too confusing. A standard that transcended language was needed.
The first international meeting to set standards for land-based meteorological measurements was held in Vienna in September 1872. Question 15 on the docket was “Is it desirable to introduce for Clouds, Hydrometeors, and for other extraordinary phenomena, symbols which shall be independent of local language, and therefore universally intelligible?” According to the minutes there was a long debate on the “advisability and the difficulty of the adoptions of symbols”, in which scientists from Brussels, Christiania, Geneva, Florence, Vienna, London, Padua, and St. Petersburg took part.
Consensus was met though and the following symbols were agreed upon:
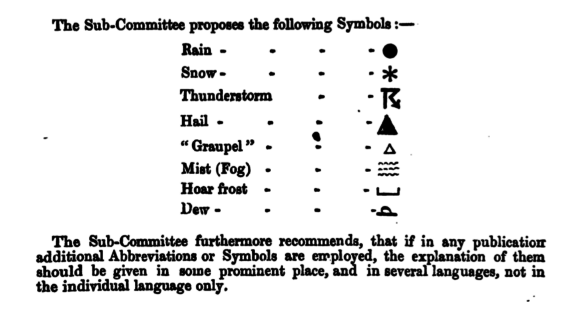
And well, the rest is history! You can see these symbols in use when transcribing the weather data from our ledgers. If you are interested in looking at further weather symbols, check out Meteorological Observations for a full list of symbols you might see while transcribing!
For more information check out:
The Invention of Clouds - Richard Hamblyn
The Weather Experiment: The Pioneers who Sought to see the Future - Peter Moore
Clouds, Cloud Types and Abbreviations
Clouds or the lack of, are an ever present part of our skyscape. It is no wonder then that when the classification of the world around us began during the 18th century Enlightenment, with Carl Linne in Sweden developing the binomial system of plant classification (still used today for all living things) that the classification of clouds wouldn't be far behind. The classification began in the early 19th century with Luke Howard.
Luke Howard was a Quaker chemist who spent hours as a boy watching the clouds. He was among the first to realize that clouds had a limited number of distinct types, rather than endlessly drifting from one shape to the next (Jean-Baptiste Lamarck was another who tried to classify clouds by type and height). He based his Latin cloud names on the typical shapes and heights of the clouds. Cumulus clouds are heap-like, stratus clouds by definition and have some form of precipitation falling from them. As they were based on Latin, Howard’s cloud types were able to be used internationally since he first devised them in 1817.
Howard gave his first lecture on cloud types in London in 1802, when he proposed that there were three main types of clouds: Cirrus, Cumulus, and Stratus. He recognized also that clouds morphed from one type to another, often in recognizable ways as the weather changed. For example, cumulus clouds could spread and merge into a stratus layer. He proposed that the basic cloud formations reflected the physical process by which the clouds were formed, such as cumulus clouds being formed by convection, which turned clouds from mysterious, ever-changing entities into physical sciences which could be studied and related to weather such as participation. In a way, we could say that the classification of clouds launched the scientific field of meteorology.
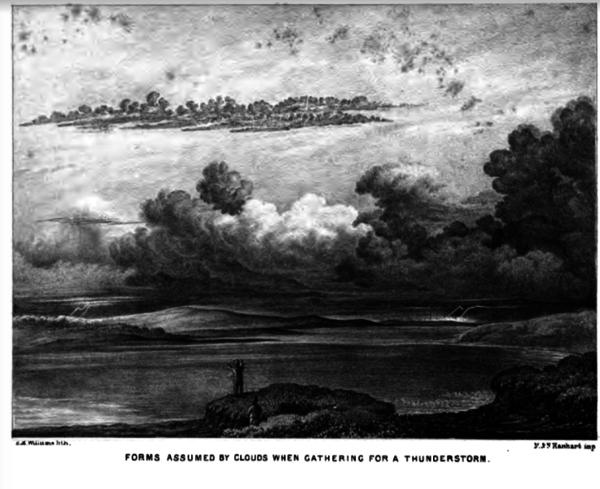
Thunderclouds gathering - frontispiece of Essay on the Modification of Clouds, 3rd Ed. Luke Howard, 1865
When writing down the observations for clouds in ledgers such as the ones which DRAW is transcribing from, using the full name of a cloud could be cumbersome. Clouds as a result have two letter abbreviations, such as Ci for Cirrus. They can be combined, such as when there is a layer of cumulus clouds to form Cumulo-stratus, Cu-St, or the most impressive of all, the towering thunderstorm clouds which all the way through the atmosphere to the top of the troposphere, Cumulonimbus, CuNi. All clouds with precipitation falling from them are nimbus clouds, so if while transcribing you see an entry for nimbus, check to see if there’s also some precipitation, usually in the form of rain or snow in the same observation time!
If you’re interested in reading more about the history of cloud classification, check out the free e-book of Luke Howard’s Essay on the Modification of Clouds (1865) available here. You can also check out our Meteorological Observations page for a full list of cloud types and their abbreviations!