Getting started
Do I need to make an account to be part of this project?
Yes! You need to create a login to transcribe so that the website will save your progress, and so that you can go back to your transcriptions.
How do I sign up?
Click Sign Up and it will bring you to a new page where you enter your email, password, full name, and display name. Then just click Sign Up button on the bottom, and you’re done!
What does DRAW do with my login information?
DRAW does not use login information for anything but user identification on the site. We will never sell your information or provide it to third parties outside of any requirement by law.
What browser version does DRAW Support?
DRAW supports the latest version of Chrome, with Firefox partially supported. We do not recommend using Internet Explorer or Safari while transcribing on the site
I already have an account, but have forgotten the password/login. What do I do?
On the Log In page, there is a link called “Forgot your password?” which, once you click it, will prompt you for the email you used for DRAW. This will send you instructions on how to reset your password.
What happens to the information I transcribe?
Three things:
1. A group of McGill researchers will perform statistical analyses of the weather data in order to identify trends in the past climate.
2. The data will be committed to international databases where it will be used - along with millions of other observations from all around the globe - to reconstruct models of past climate.
3. The data will be made accessible to historians and sociologists interested in the impact of weather on culture and population dynamics.
For more information, look at the DRAW Terms of Use.
Entering Data
What do I do if the observations in the anemometer columns on Sunday do not line up with the observation times?
Consult the Transcription Tips: City Hall Barometer on Sundays (page 2) blog post for detailed information on what is occurring here and why.
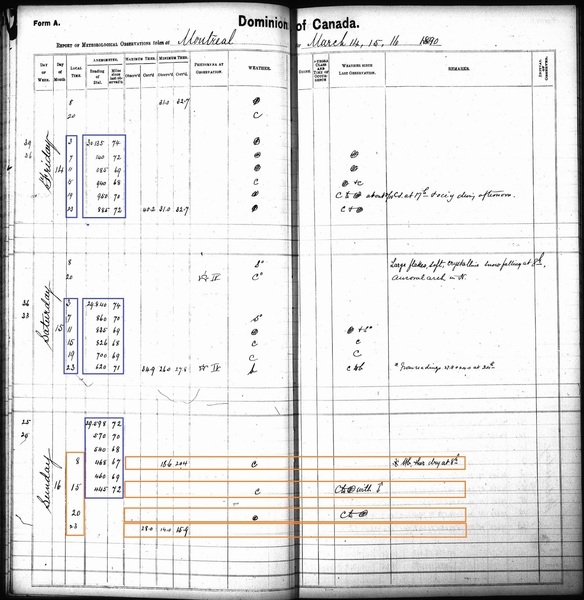
To transcribe these pages:
1. Verify the number of rows
a.If the same observation time appears twice on Sunday, only count it once.
b. Count the rows for the other days on the page as you normally would.
2. Transcribe the two days which are not Sundays normally, using the times in the “Local Time” column.
3. For Sunday, transcribe the rows of barometric values under “Reading of Dial,” “Miles Since Last Observ,” and “Maximum Ther. - Observ’d” following the observation times used on the other days of the week (3am, 7am, 11am, 3pm 7pm, 11pm).
a. If other times are written just to the left of the barometer data, use the times supplied on the page instead.
4. For all other data on Sunday outside the Anemometer columns, use the times in that day’s “Local Time” column (usually 8am, 3pm, 8pm, and 11pm) to transcribe the data in the corresponding field.
a. If other times are written in the “Local Time” column, use the times supplied on the page instead.
b. If the observations do not align exactly, transcribe them at the time they most closely align to.
5. Continue until the page is fully transcribed.
What does "inapp" mean?
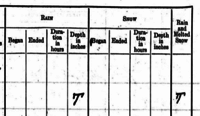
"Inapp" or something similar is an abbreviation of "inappreciable", a word used to indicate some precipitation fell but not enough to measure. Today the word used is "trace" for "trace amount." In very cold climates such as Canada's north, a significant portion of precipitation, especially in winter, falls in slight amounts.
They wrote a 'T' in the cell - what do I do?
A 'T' written in the cell represents the word 'trace', which in turn means that there was an amount too small to measure. When you encounter this type of observation, either transcribe what you see ('T') or the word 'trace'.
What do I do if there is a sum and/or average under relative humidity?
Consult the “Transcription Tips: Relative Humidity Average” blog post for the different variations of relative humidity average that may appear, and how to recognize them. Once you have identified a relative humidity average, it should be transcribed using the “Transcriber comments” field, which can be found furthest to the right in your Transcriber panel. Type “Relative humidity average:” or “RH avg:” followed by the value. Use 11:59pm as the associated time for this Transcriber Comment so that it appears in a logical place in the data table relative to the other observations. Using a Transcriber Comment will cause the data to stand out in post-processing, so that it can be correctly interpreted.
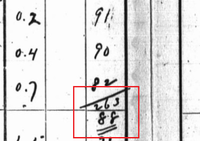
In this example, 263 is the sum of 91+90+82, and 88 is the average, calculated by dividing the sum (263) by the number of observations (3).
Should I type the observations exactly as written or make corrections?
Yes! It is important that the data be as close to the original ledgers as possible. If you think the observer made a mistake, please resist the urge to correct it. We will analyze the entries later on and identify the unlikely observations at that time.
How should I write the times?
Please write the times as HH:MM, so 12:25 or 3:47. If the observer wrote AM or PM, add that as written, so 12:25 AM or 3:47 PM
"" or 'ditto' is written in the cell - what do I do?
Ditto marks are used sometimes when the value in the cell immediately above is repeated. Observations were usually taken every 3 hours starting at 1:48 AM. On some pages, all the subsequent observation times are written as 4:"", 7:"", 10"", etc.
There is no field to add in the Sums and Means rows for the logbook I am working on. What do I do?
Please ignore the Sums and Means rows when you encounter them!
Why are there only three entries on some days?
On Sundays they would only take three readings, so this is not unusual. Only fill in teh three rows of observations that you see.
Why are two rows of observations at the top, separate from the others? Do I transcribe these like normal rows?
While usually observations were taken down in order from morning to night, sometimes our observers would extract two times 12 hours apart (8am and 8pm for example) and place them at the top of the day's observations for easy comparison. Please transcribe these like any other row of data!
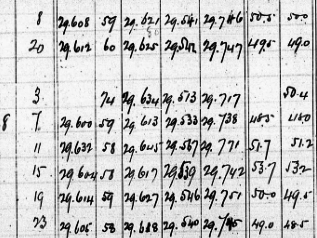
How do I transcribe offset observations?
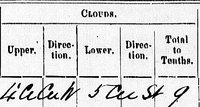
It often happens that observers wrote observations across many columns, especially in the 'Clouds' fields. In the example below, '4CiCu' belongs in the 'Upper' column. 'W' which stands for West goes in the 'Direction' column. '5CuSt' goes in the 'Lower' column and '9' goes in the 'Total to Tenths' column.
How do I transcribe stacked observations?
Stacking observations one on top of the other is also relatively common. In this case, simply write the stacked observations in the same field box.

What do I do if there are observations at the far left, before the date and time column?
If you see observations in this column, like the example page seen here, please transcribe this data in the "Transcriber's Comments" field.

What do I do if there is a single dot or period in the cell?
As seen in this image, a dot or period indicates an empty cell with no data. Transcribe it as you would an empty cell selecting 'Empty' from the options in the dropdown menu.

What are the units for water vapour- sometimes there's a decimal point, so the value is less than zero, but sometimes it's a value in the hundreds.
The water vapour is a measure of the amount of atmospheric pressure due to water vapour, so it is measured in inches of mercury (in Hg), the same unit as the atmospheric pressure, and is usually a very small fraction of the total atmospheric pressure. Sometimes, especially in the later part of the record, the observers recorded the value as just the hundreths of an inch, without recording the leading zero or decimal point before value. A vapour pressure of 0.314 inches of mercury would thus be recorded as 314. We have code to check for this and correct it in post processing, so it's fine for you to type in 314 if that's what's written, but now you know it should really be 0.314 in Hg.
How do I mark an empty cell?
If nothing is written in a given column, select 'Empty' from the options in the dropdown menu
What if the observations are illegible and I can't read it?
You are not alone. Reading the handwriting can be hard – even the experts struggle with it. Try to do your best, but sometimes all you can do is guess.
Look for clues – if you are dealing with a numerical value, look at the other measurements on the page for hints. For instance, "1"s and "7"s can sometimes be hard to differentiate. Say you are hesitating between a temperature measurement of 13°F or 73°F, look at the other temperature measurement on the page as well as the date. If it is winter, 13°F is more plausible. Whereas, if it is a summer month, opt for 73°F.
Sound out the word - there was no spellcheck when the observations were recorded. Hence, some words may be misspelled or spelled phonetically.
Ask for help - turn to those around you for their suggestions or contact us via Facebook or email to get help!
What do I do if there is a line through the data or if it is scratched out?
When entering data, there is an option in the drop-down menu for “Retracted/ Line Through.” Instead of entering any numbers/symbols, simply use that option in the drop-down.
What do I do if the highlighted box doesn’t cover the observation?
Don’t worry! You can resize, move, or delete the highlighted box. Hover over the highlighted box. Three little white boxes will appear on the left: edit the annotation, resize the annotation, reposition the annotation. You can use them to make changes to your transcription, or the highlighted box you have created.
On the right in the highlighted box is a little red box: delete the annotation. This can be used to delete the transcription data that the highlighted box represents.
Check out Step 4: Start Transcribing in the Getting Started Tutorial for more information.
It's Not You, It's Me (Known Issues)
We are currently working on these issues so we thank you for your patience!
Rolling pop-up boxes appear when I create annotation boxes
This issue can occur when you choose the option 'Mark annotated area and don't show me again' after you save the annotation successfully. It will cause the coloured pop-up to appear in multiples (if you have completed 6 sections, you will have 6 pop-ups, etc.).
A work around for the moment is refreshing the page between transcribing tabs, or by closing and re-opening the transcriber panel after each row of data.
The wrong fields appear in the transcriber panel
The pages which make up the DRAW dataset consist of two different page templates – page 1 and page 2 – which each correspond to different sets of variables; for example, page 1 usually contains barometric readings, while page 2 usually contains anemometer readings. Some pages have been incorrectly identified as page 1 when they are actually page 2. When pages are misidentified, the incorrect field groups appear in the transcriber panel and the data on the page cannot accurately be transcribed.
If you encounter one of these pages, please send us an email to let us know about it, along with the transcription ID associated with your transcription. You can find the transcription ID on your profile, in the “My Active Transcriptions” section. Once you’ve informed us of a misidentified page, we will investigate the situation and do our best to make that page visible with the correct fields as soon as possible; in the meantime, feel free to start another page!


